How to Create a Campaign Report for Clients [Structure & Steps]
The easiest (and fastest) way to create a campaign report is to use a dedicated marketing reporting tool. In this article, you’ll learn how to choose the right data and reporting tool and use it to structure your campaign so it’s the most useful for clients.

Nov 14 2024●8 min read


Putting together a campaign report but not sure where to start? We get it.
With so many channels, campaigns, and clients, it can feel like a Herculean task to pull together all these different data points and patch together a presentable report.
You might have questions like:
❓Which metrics should I report on?
❓How do I structure the report so I don’t bore the stakeholders?
❓Which tools should I use so I can create a report in minutes (instead of hours)?
To help, we asked eight digital marketers these questions and compiled their insights in this article.
You’ll hear from:
- Tom Jauncey, Head Nerd (a.k.a CEO) @ Nautilus Marketing
- James Taylor, SEO Strategist @ Embryo
- Saul Marquez, CEO @ Outcomes Rocket
- Cheyenne Skye, Digital Marketing Analyst @ Noise New Media
- Thomas Hasset, Owner @ TH Results
- Zach Pittman, Digital Marketing Consultant @ Forrest Property Group
- Jordan Stevens, Digital Marketing Consultant @ Jordan Stevens
- Peter Murphy Lewis, CEO & CMO @ Strategic Pete
Plus, we'll also share two resources: a free Google Sheets template for campaign reporting and Whatagraph's campaign report template.
Let's dig in.
What Should You Put on Your Campaign Report so Clients Will Care?
A campaign report is a document that summarizes the results of your marketing campaigns. It highlights key performance metrics, outcomes, and insights you gather throughout the campaign. This way marketers and stakeholders can better understand how well the campaign performs.
This report not only provides transparency but also offers valuable data to inform future marketing strategies.
But what should you put in these campaign reports so you’re showing your value to clients right away?
This depends on each specific client.
Clear and proactive communication with your clients is so important to understand what to put in your reports.
Cheyenne Skye, Digital Marketing Analyst at Noise New Media, shares:
Whenever we're onboarding a client we make sure to ask what they’re really looking for. There's a ton of metrics that we as marketers look at that would make no sense and probably overwhelm the customers. So we always try to be very specific about what is the client’s goal and then just show the metrics for that.
Depending on the type of clients you serve and the industries they’re in, these metrics will vary.
For instance, Cheyenne works with clients who sell event tickets online. This means they care most about:
- Revenue
- Return on Investment
- Conversions
But she also shares that this is not always the case for every client. Some clients are just starting out in the event business and they just care about brand awareness metrics like Impressions.
Again, the key is clear and open communication with your clients.
Tom Jauncey, CEO at Nautilus Marketing also shares this sentiment. He tells us:
Clients don’t all care about the same metrics, so focus on what matters to them. Keep it clear, concise, and actionable. Start with the wins, explain what’s driving results, and then outline the next steps.
When creating a campaign report, a good rule of thumb is to ask yourself who will be reading it. For example:
- Executive-level clients: Typically focus on ROI, revenue growth, conversion metrics, and customer lifetime value as these directly reflect business impact.
- Marketing and sales teams: More interested in engagement, audience insights, cost efficiency, and behavioral metrics as these can help optimize future campaigns and refine targeting.
- Financial teams: Zoom in to cost efficiency metrics (like CPC, CPA) and overall ROI, which directly impact budget allocations.
In fact, Peter Lewis, CEO and CMO of Strategic Pete says he always takes into account the report audience:
C-Suite executives want to see one thing: bottom-line impact. If I’m reporting to a CEO, they need to see how specific campaign elements drive revenue growth or influence customer acquisition cost (CAC). They care about KPIs that matter directly to business performance, like customer retention rate for B2C or SQL-to-opportunity conversion rate for B2B.
If you’re not sure which metrics to include in different types of campaigns, check out our 35 Digital Marketing KPIs and Metrics guide.
But, it’s not enough to just add these metrics in and call it a day. You need to explain them. This includes:
Explain which metrics trended up or down, whether X campaign was a huge success or not, whether Y channel surprised you, and the next steps you will take.
Saul Marquez, CEO of Outcomes Rocket, says:
It’s about telling a story with the data; a story that represents both current impact and future opportunities.
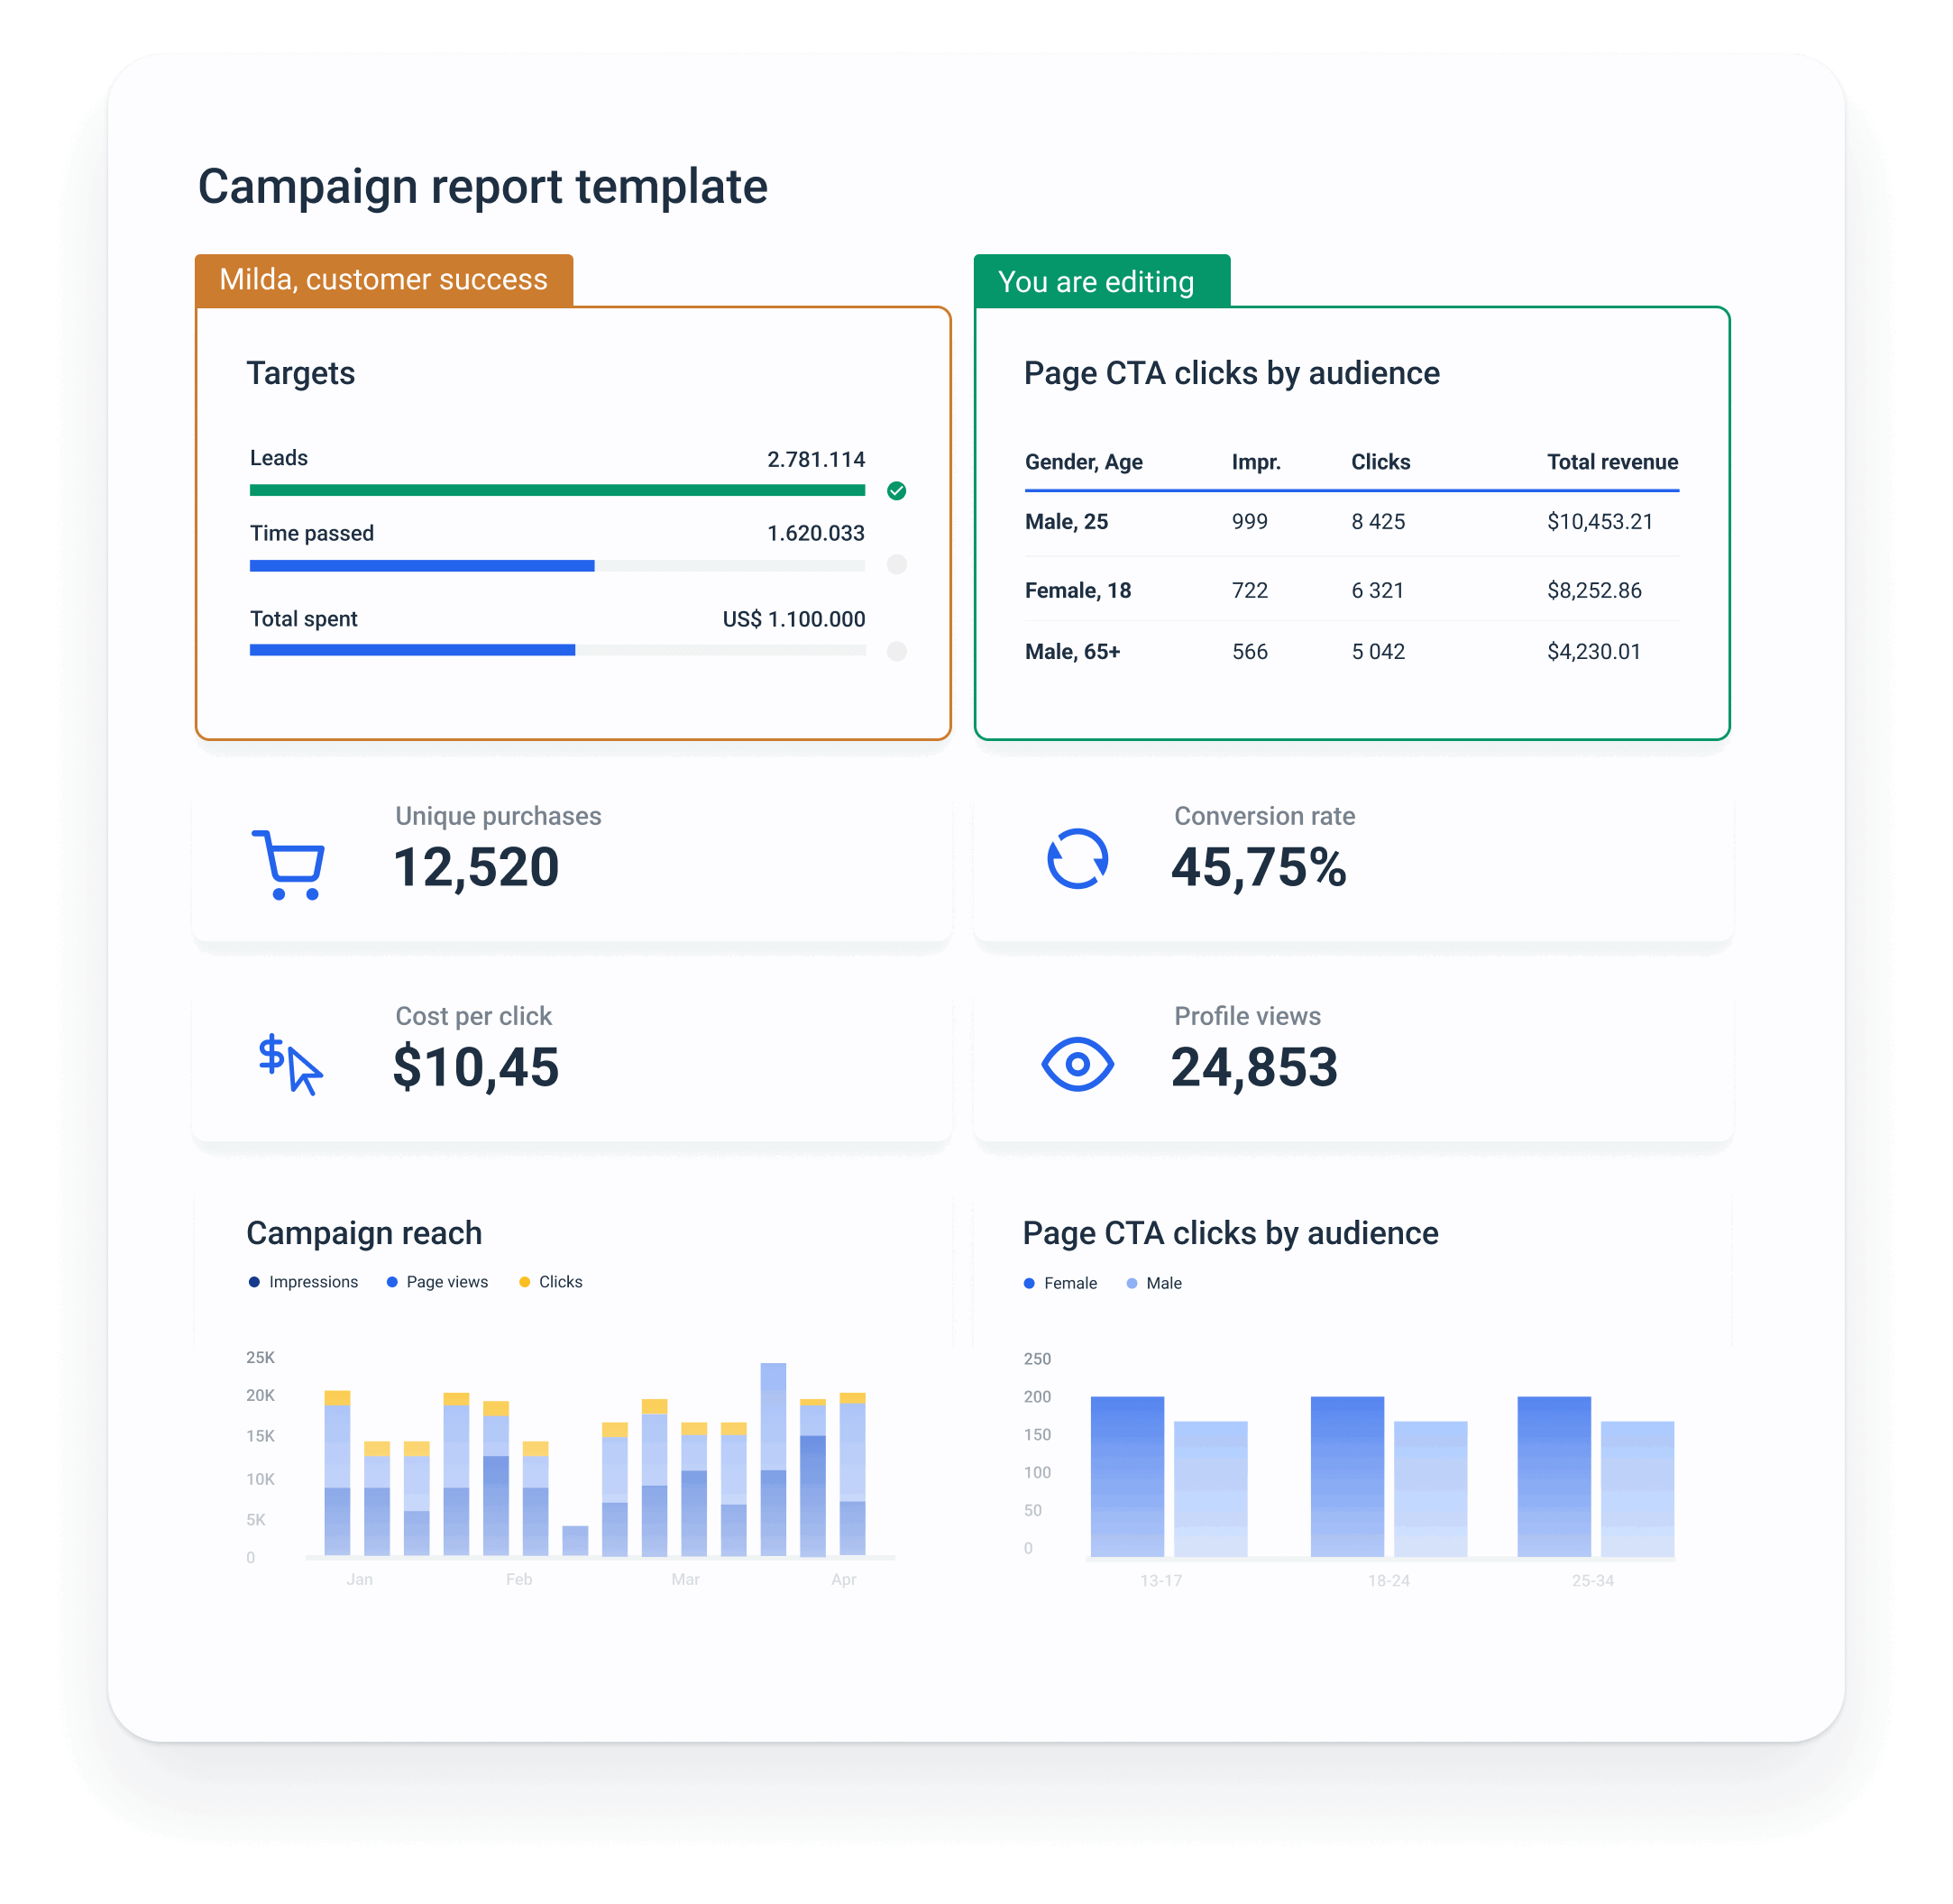
This is why it’s important to add a “Notes” section in your report, just underneath your key metrics to highlight these explanations. On Whatagraph, you can easily drag and drop the Notes widget like so:
Here comes the million dollar question: how do you create a marketing campaign report? The easiest and fastest way is to use a reporting and data platform, like Whatagraph.
How to Create a Campaign Report: Step-by-Step Guide
You can create a campaign report in two key ways:
- Make a copy of this FREE Google Sheet – this is free but you won't get comprehensive cross-channel insights and you'll need to spend a lot of time copying and pasting data points.
- Follow the steps below to use Whatagraph – this is easy and fast since you don't need to do any manual work. Whatagraph collects, cleans, and visualizes your data automatically.
Step 1: Compile your data in one place
Start by connecting the data from all the marketing tools and platforms you’re using for a campaign.
Lewis combines automation with selective manual oversight:
We pull core metrics from Google Analytics, HubSpot, and LinkedIn Ads Manager for lead generation campaigns, centralizing everything to create visual reports for easy client review.
Even in this first step, the way you report on your campaigns makes a huge difference.
Spreadsheets are free and already available, and chances are that all account executives in your agency know how to use them.
However, connecting scattered data using sheets is a time-consuming and manual job with a huge margin for error.
For Thomas Hasset of TH Results, having one dashboard that pulls data from all their sources is a key to not getting lost in “data purgatory”:
We work with a mix of Google Analytics, Meta Ads Manager, and Whatagraph to keep it visual and client-friendly. It keeps things clear, fast, and lets us answer those big client questions, like “What actually worked?”
And when it comes to connecting data, Whatagraph has fully managed integrations with popular marketing tools.
- Google Analytics 4
- Google Search Console
- Ahrefs
- Semrush
- Facebook Ads
- LinkedIn Ads
- YouTube
- Mailchimp
- CallRail
- Salesforce
- HubSpot
And many others.
These direct connectors are much more reliable than third-party connectors and can slow down your online report or give you inaccurate data as they can refresh at different rates from one another.
You should be especially careful if you use Looker Studio as your reporting tool. It works fine with Google data sources, but with third-party connectors, things can get complicated.
Zach Pittman of Forrest Property Group explains some of the problems he had with Looker Studio:
We've had issues with data not updating correctly or graphs suddenly showing incorrect information. When data is wrong in our reports, we find ourselves spending a lot of time problem-solving by looking at the original data in GA4 or Google ads, and in some cases, simply explaining to the client that the data is not showing correctly.
With Whatagraph, you can pull scattered data from scattered sources right into your reports without missing a beat.
The integrations are developed and maintained by our dedicated team of engineers, so once you connect your accounts, there’s nothing to update or re-connect on your part.
How to do it:
- Open Whatagraph, go to Data Sources, and select the marketing platforms you need.
- Follow the on-screen prompts to provide the necessary credentials and connect each platform.
- Once integrated, Whatagraph will automatically pull in the latest data, updating in real-time.
What do you get:
- A centralized view of all your campaign metrics across platforms and tools.
- Accurate and relevant data in every campaign report you send.
Step 2: Choose a report template or start from scratch
Starting your campaign report from scratch gives you the freedom to structure your report just the way you want it.
Still, having a template to start with saves a lot of time.
Especially if you need to report to several clients or stakeholders regularly.
Lewis is a big fan of report templates:
Consistency also matters—use the same report format every time so clients can quickly find and interpret what matters to them.
To help you out, we created this campaign report template, which you can use right away.
On the other hand, if reporting in spreadsheets takes too much of your time, you should look into a dedicated data and reporting tool.
Whatagraph offers pre-made digital marketing report templates that you can customize for each campaign.
Pick a template as a starting point, and pick the metrics and sections that best present your campaign’s results.
How to do it:
- Go to the Templates section in Whatagraph and search for campaign-related templates.
- Choose a template that aligns with the KPIs you want to display (e.g., audience engagement, cost per lead, conversions).
- Alternatively, select Create New Report to build a report from scratch, choosing only the widgets and metrics that you need.
What you'll get:
Faster report building for multiple campaigns and stakeholders.
You can tailor each report for a specific campaign by highlighting the most relevant data.
Step 3: Customize the campaign report template for a specific client
In Whatagraph, you can quickly create a customizable campaign report. Once you find a template that is the closest match to your campaign KPIs, you can start tailoring it.
James Taylor of Embryo advises to keep the campaign report on one page:
We’d rather reduce the amount of data so that we can focus on exactly what the client wants to see, and make it as easy as possible to see how a certain strategy approach benefited their organic visibility and revenue.
Let’s just make sure not to miss any steps here:
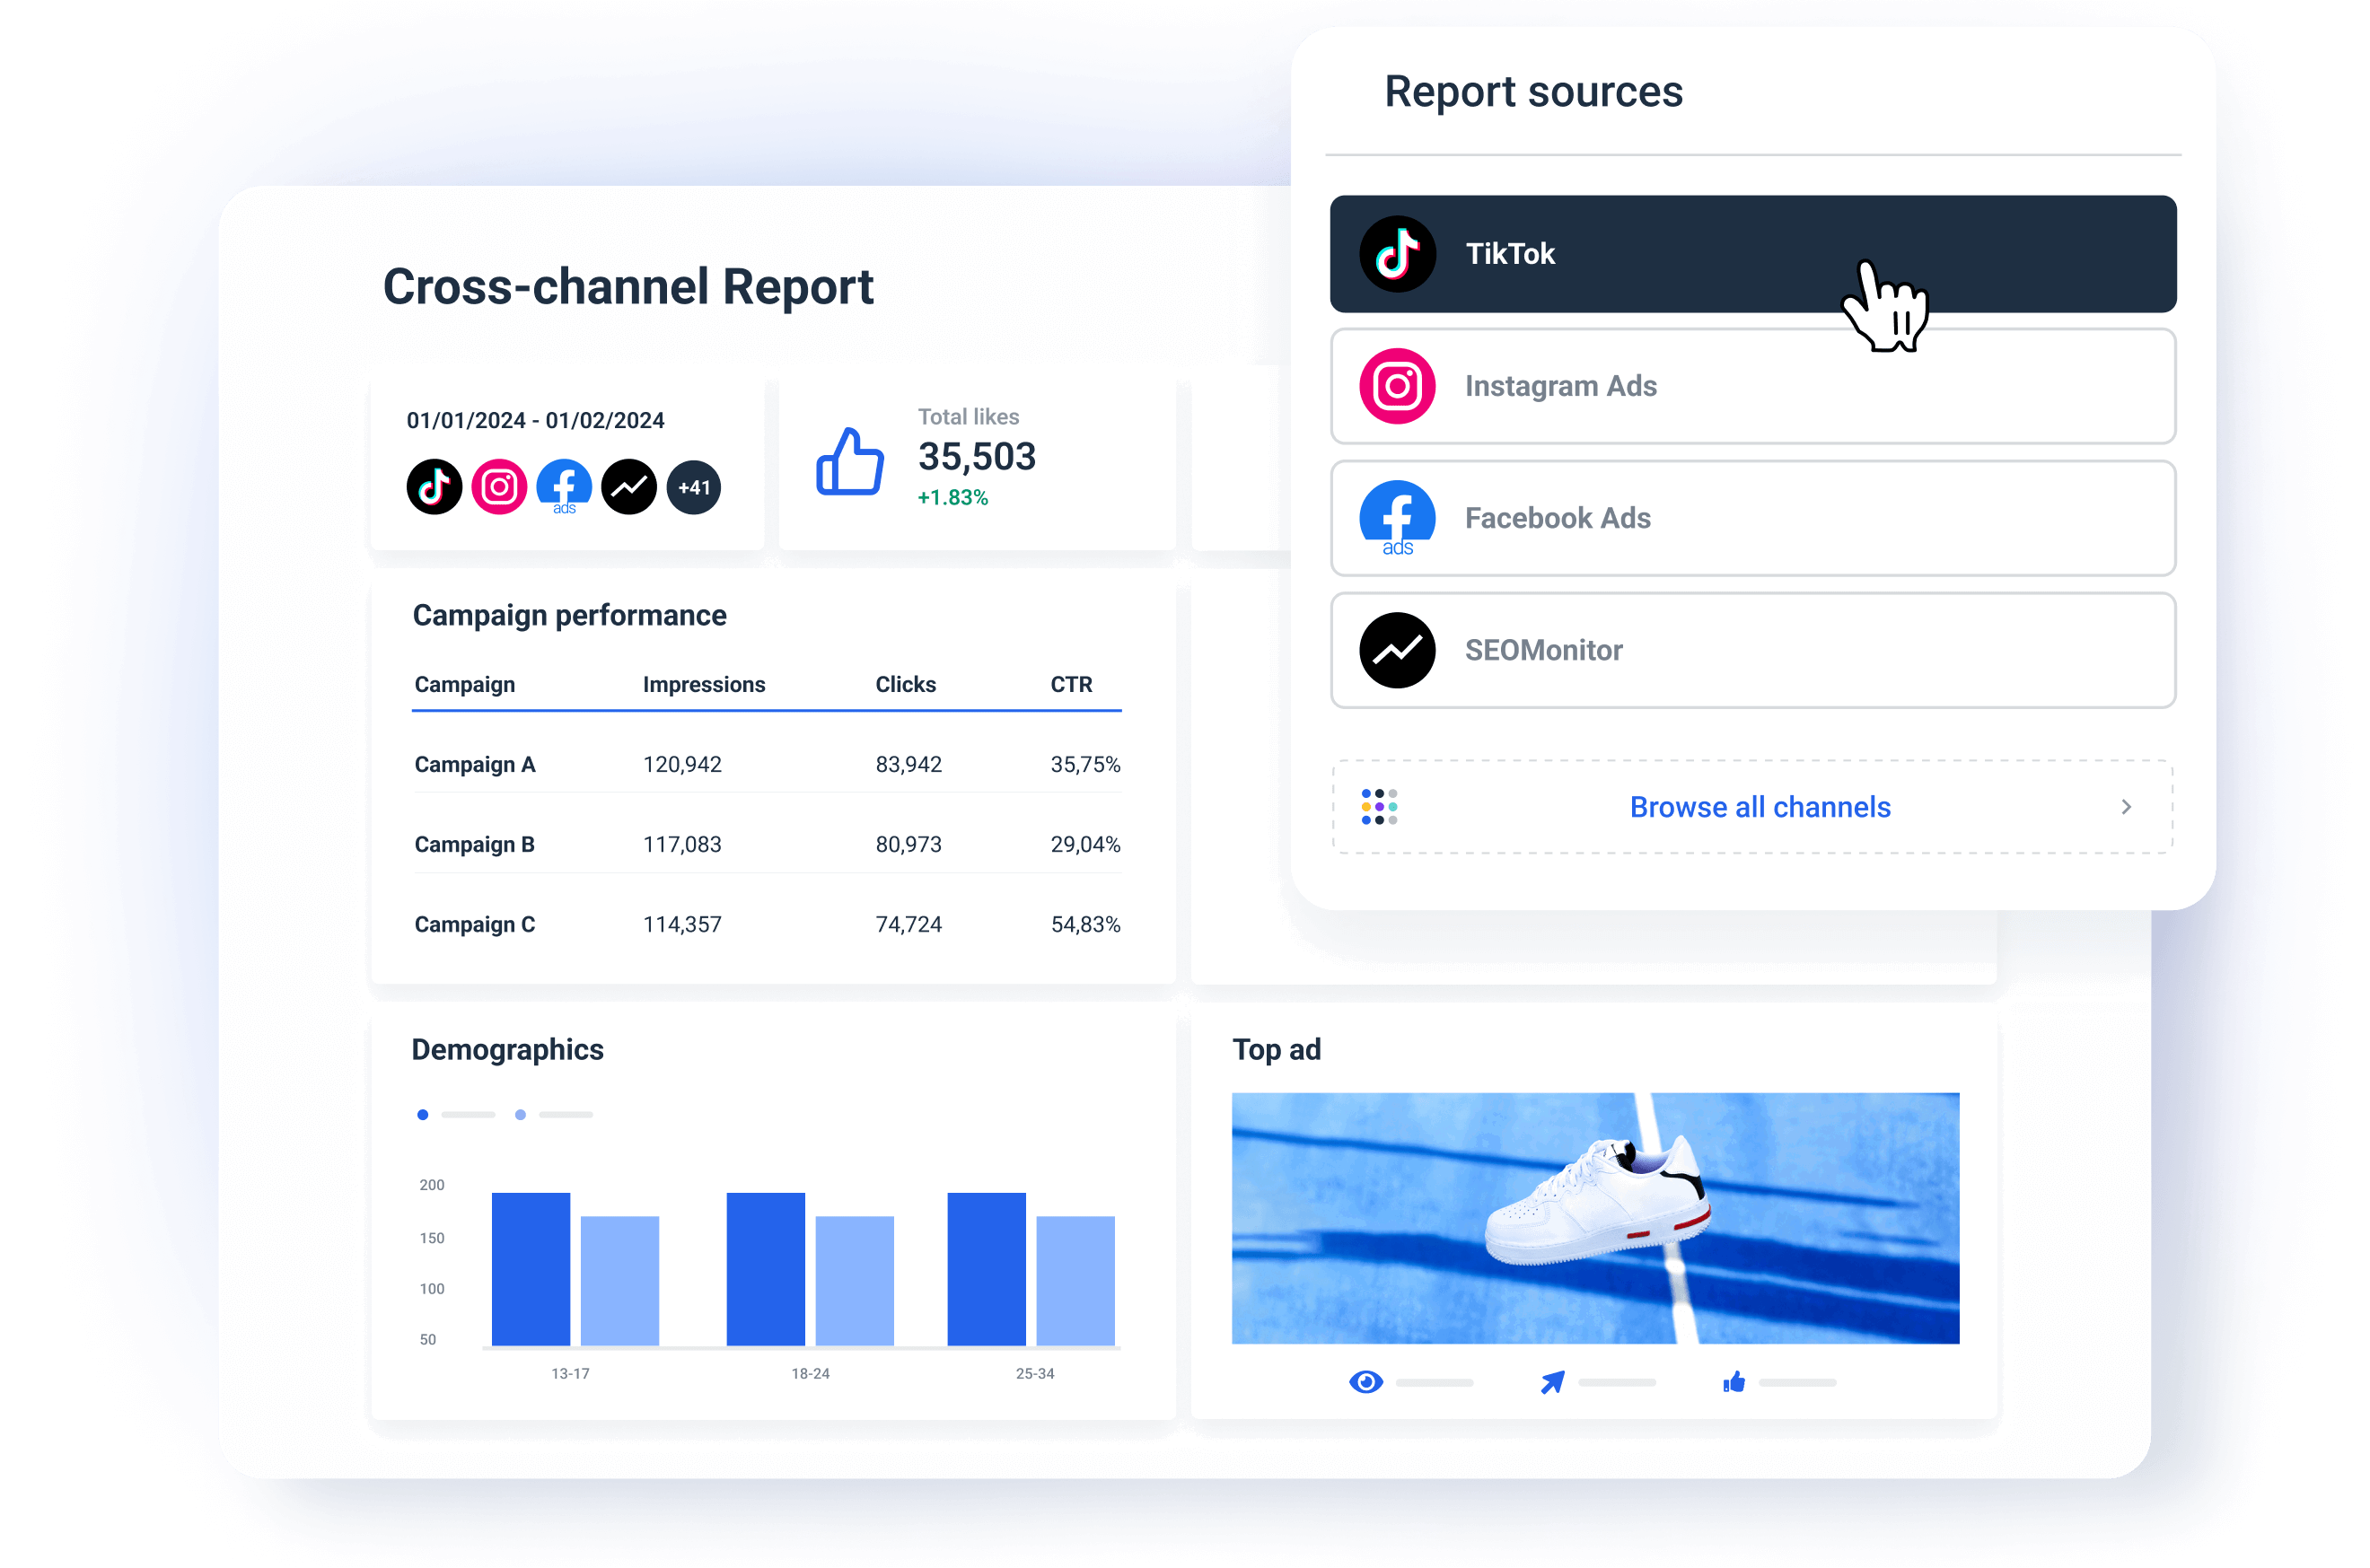
✅ Connect the relevant data sources: You can load a template with just one source connected, but now you need to add other sources that hold your campaign data.
✅ Customize metrics and widgets: Check out the metric already included in the template and decide if you need to remove some of them, so the stakeholders can really focus just on the important ones.
For example, if you’re reporting on a TikTok campaign, add Followers Over Time and Likes by Campaign. For a PPC campaign, highlight the ROAS and Keyword Performance.
Lewis adds:
I create a custom layer that tracks key performance indicators specific to each client’s goals. For example, for eCommerce clients, we measure customer lifetime value alongside conversion metrics to showcase long-term impact rather than short-term gains.
In Whatagraph, you can go one step further and create custom metrics, such as Cost per Lead from Paid or Leads from Organic.
The metrics you want to use often depend on the industry.
Marquez explains:
Our healthcare clients often focus on metrics that show patient engagement, lead quality, and brand trust. We make sure that patient engagement is front and center because this is a key indicator of marketing success.
✅ Choose the appropriate visuals: Whatagraph offers different chart options, such as line charts, bar graphs, funnels, and pie charts. If your client prefers a bar chart to a pie chart for a specific metric — nothing easier. Pick the bar chart widget and select the metrics and dimensions you want to see.
(Hey, did you know you can also create custom charts and save them as template widgets?)
✅ Arrange the widgets for easy interpretation: Always put the most critical KPIs like Cost per Lead or Campaign Budget at the top of your report, right next to the Campaign Goals widget.
Jordan Stevens of Jordan Stevens says the structure of widgets should always follow the story you want to tell:
What is the main point you want to get across? The content of the report should flow from there. One flow that's useful for a lot of digital marketing projects is to follow your ABCs: Acquisition (how did the traffic arrive), Behaviour (what did the traffic do on your site), and Conversions (did the traffic convert to a lead or sale).
The best practice is to group related metrics together, such as engagement metrics (bounce rate, avg. session duration, etc.) and on-page metrics (pageviews, time on site, etc.)
Before we continue, let’s just say a few things briefly about Whatagraph’s proprietary Goals widget.
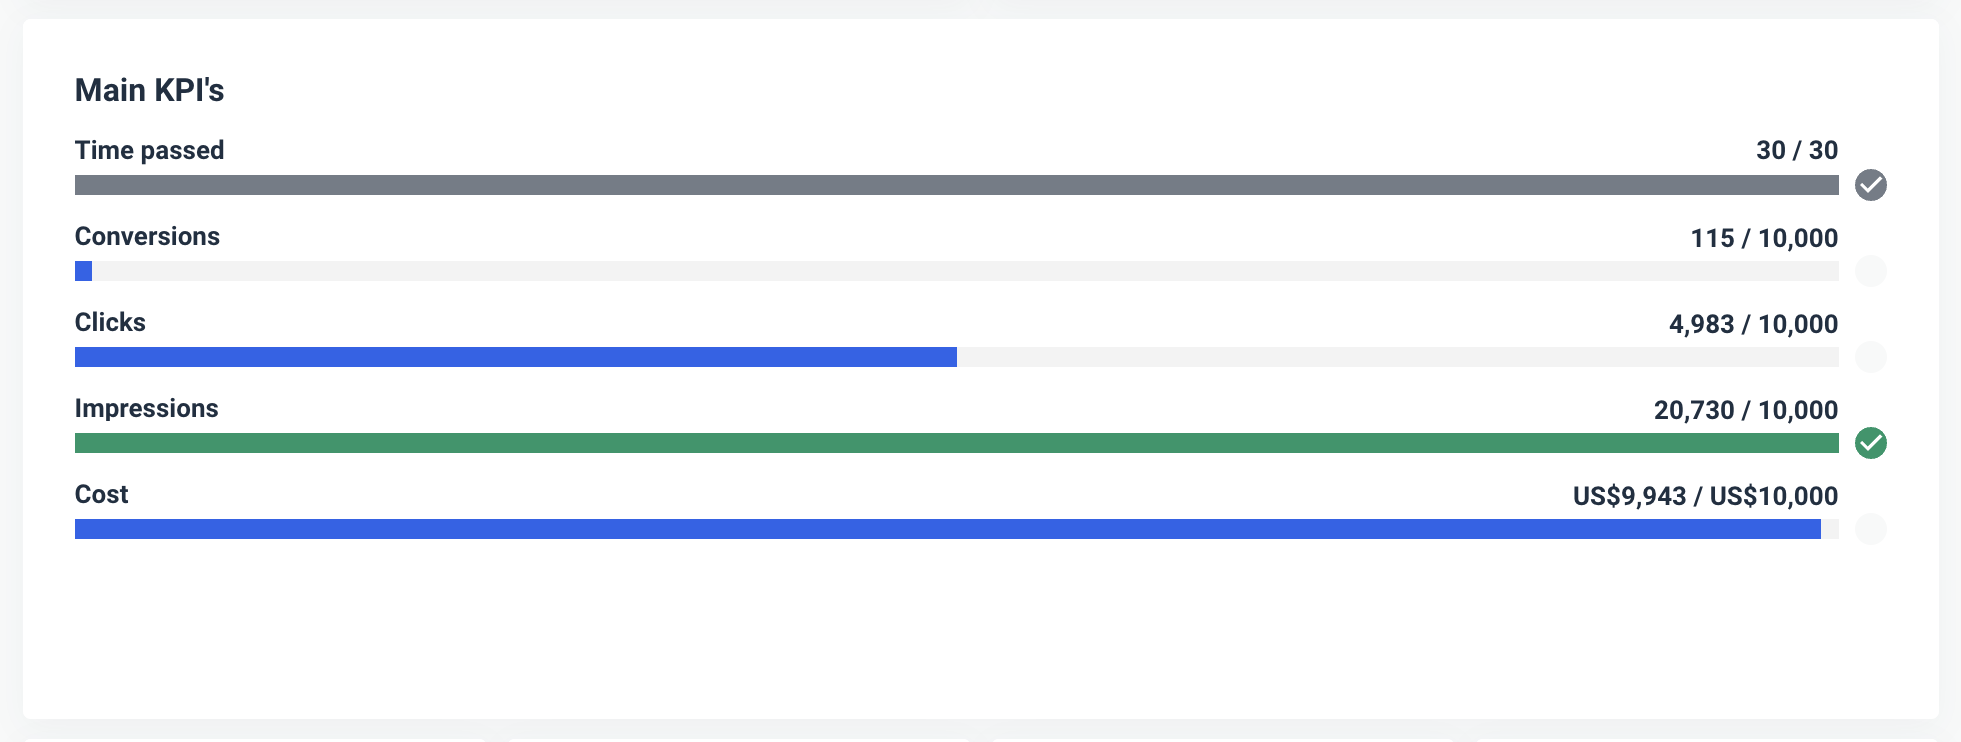
You guessed it right: Whatagraph has developed a special Goals widget that is great for tracking how your campaign is progressing toward its targets.
For example, you can set up the goal to reach 1,000 conversions and track how far you are from achieving that.
The widget has a visual progress bar highlighting how your digital marketing efforts come up against set objectives.
You can create goals on any metrics to break up the monthly marketing performance targets into day-to-day action items.
Step 4. Organize campaign data for actionable insights
Let’s run a quick checklist:
- Connect scattered sources - Done ✅
- Pick a template - Done ✅
- Tweak it for your campaign - Done ✅
The problem is that actionable insights are still hidden under a heap of data.
Hasset puts data overload as one of the top challenges:
Every platform speaks a different language, so finding the story within all that noise takes patience. On top of that, clients often want a single “magic number” that’ll tell them everything, and, as we know, there’s no one metric that does it all.
Now you need to get those insights and truly pinpoint the high and low points of your campaign so you can optimize it on the go.
In other words, you need to Organize your data.
But don’t worry, no need to involve data engineers.
In Whatagraph, you can organize your scattered data so you can get insights in seconds.
How? In several ways.
- Custom metrics: You can unify and change names of different metrics permanently in your report or create a new metric using a simple formula.
- Custom dimensions: You can also unify names of different cross-channel dimensions and group data points from different sources.
- Data blending: Great for combining different sources together into one unified data source for getting quicker insights and keeping your dashboard neat.
If you ever used two tools – one to connect and prepare your data and one to visualize it – you know what a hassle it is to switch between two workspaces all the time.
In Whatagraph, everything happens in one workspace. You connect, organize, and visualize data inside your report, and you can see the changes immediately.
Thanks to recently launched Performance Monitoring, you can get actionable insights from your data even faster.
You can:
- Group 100s of scattered data sources into unified Source Groups in seconds
- Add custom tags to your data and filter it by client, business type, location, Account Manager, etc.
- Visualize your key metrics in one view and easily spot performance trends
Step 5: White-label the report with client branding
In Whatagraph, you can personalize your reports with your client’s brand colors, logo, and custom headings.
Alternatively, you can apply your agency’s branding so every report you send looks like a part of your agency’s website.
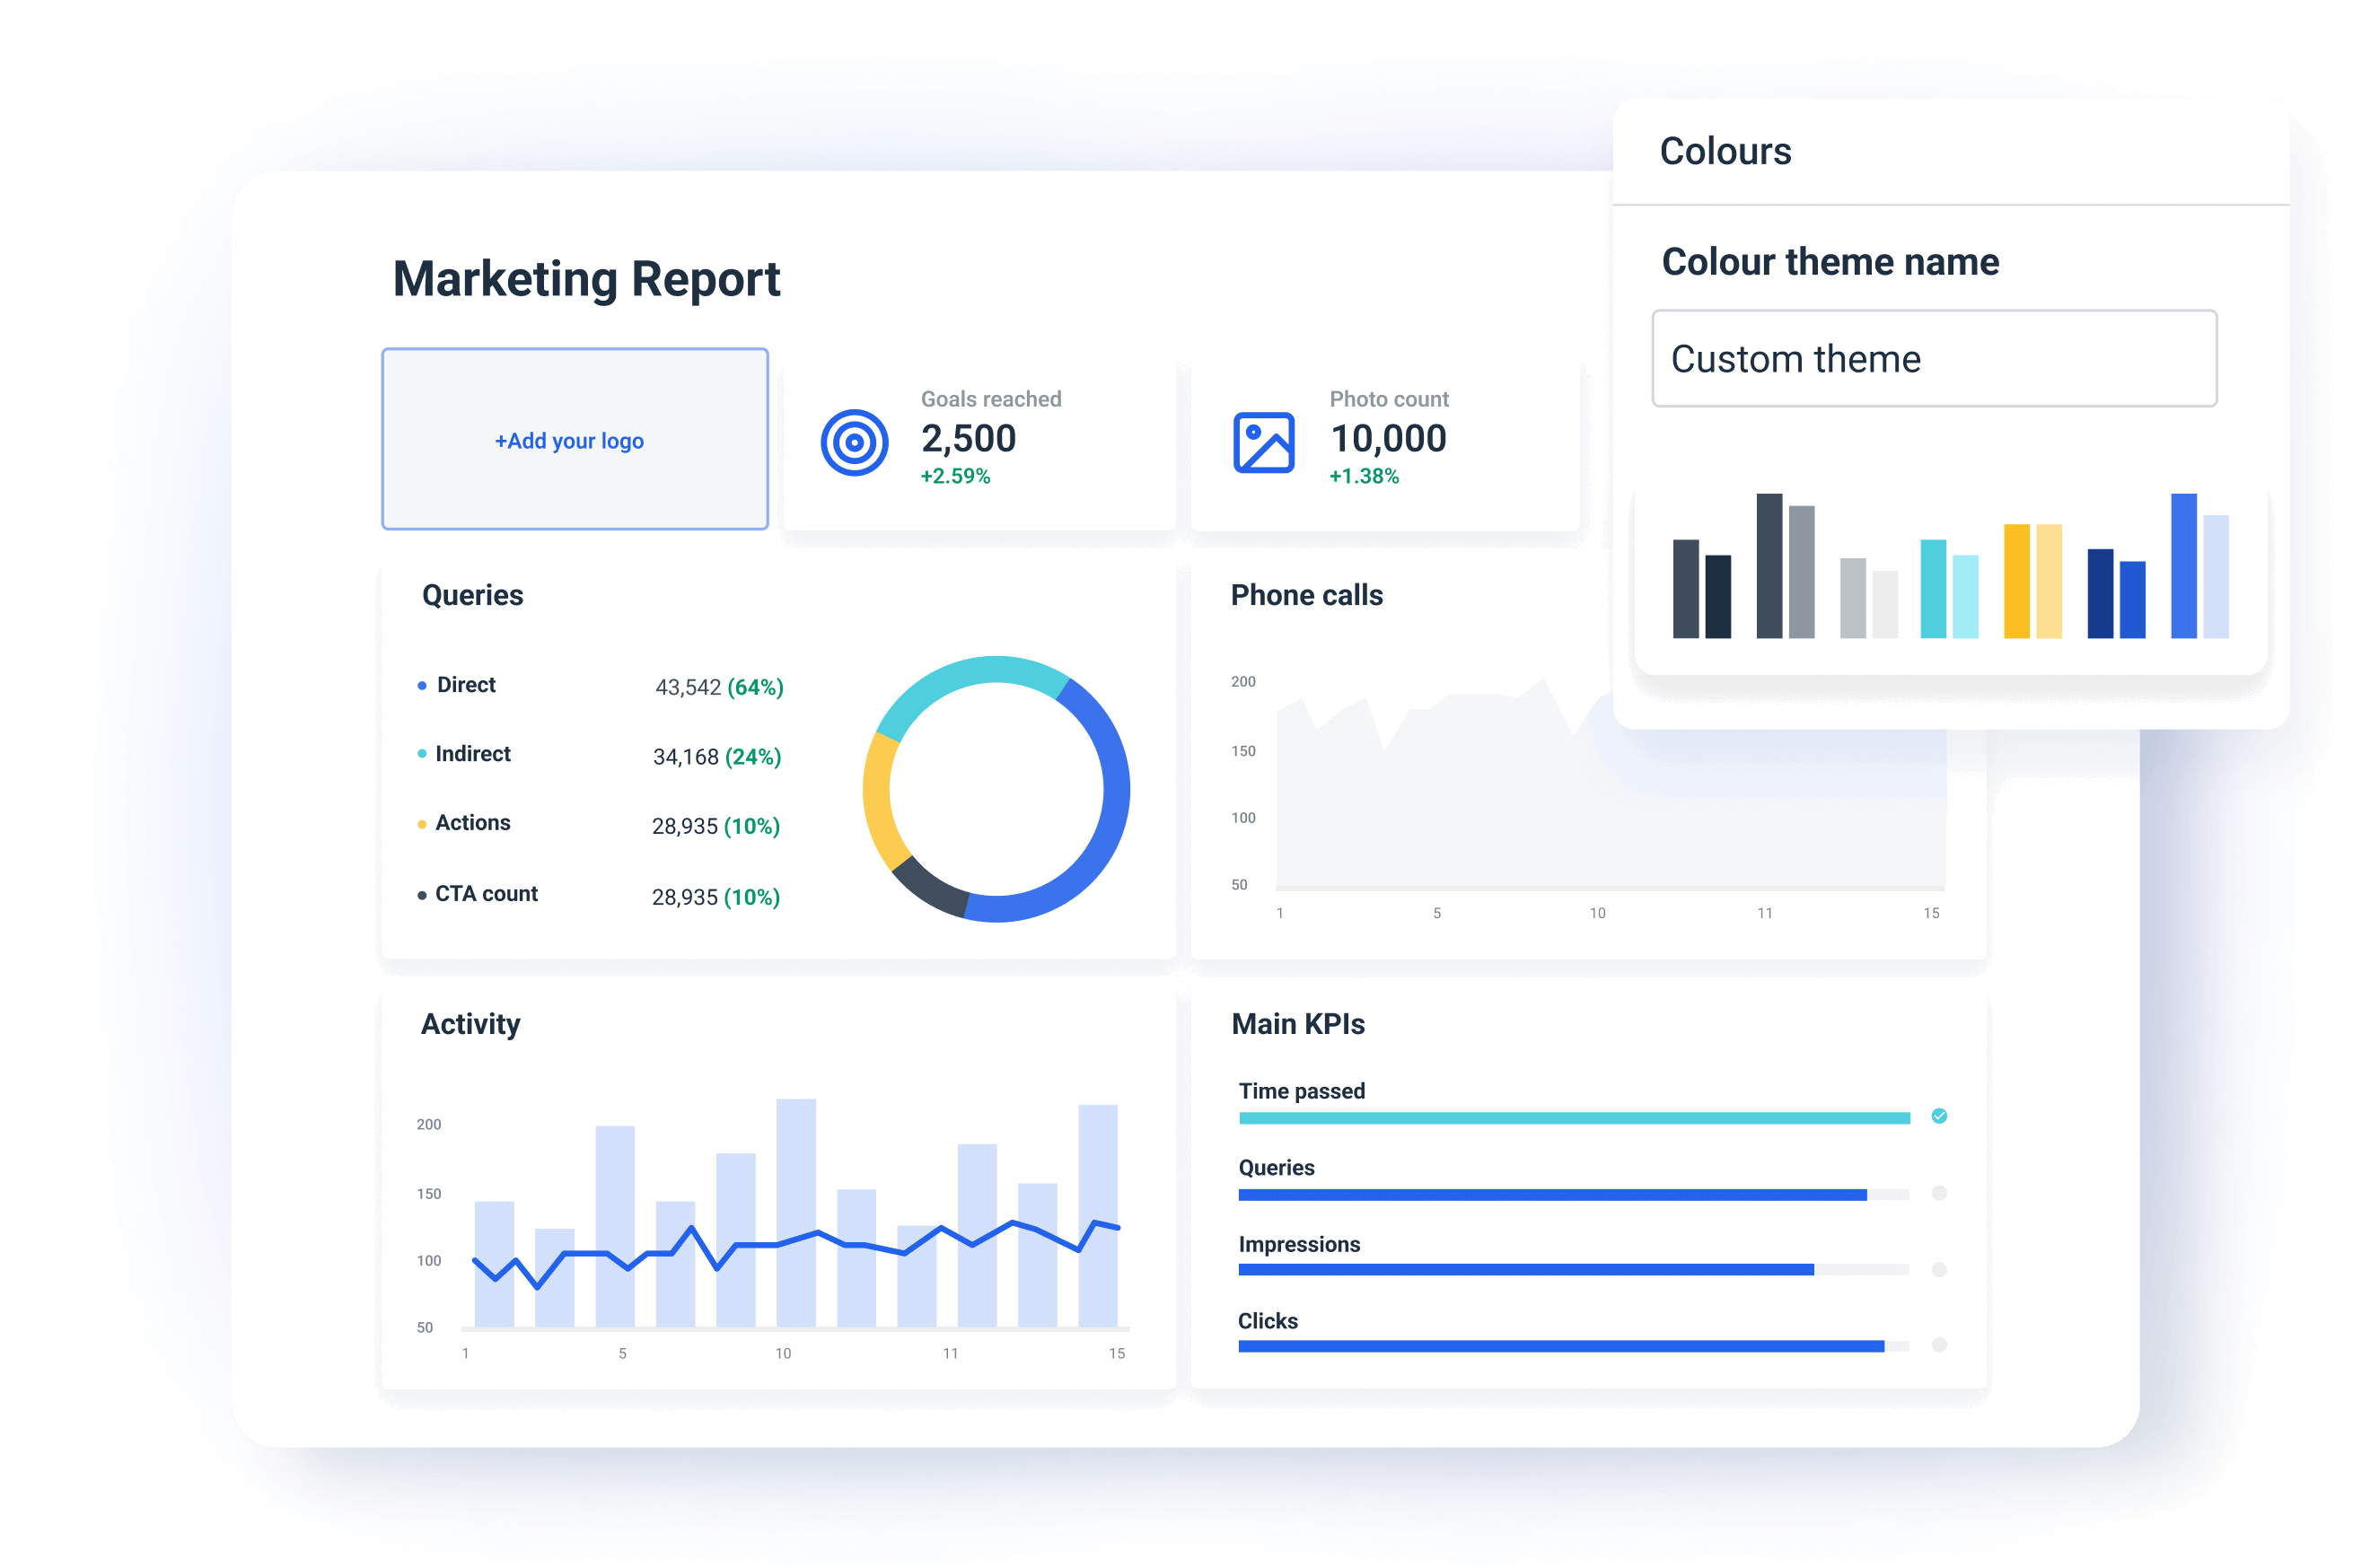
This means your clients will immediately recognize your campaign performance report as a part of your brand. You can create a global theme for your agency or create multiple themes on the report and even at the widget level.
You can also share your white label reports on a custom domain and cut all ties to Whatagraph as the software provider. The client will be no smarter than to believe you custom-built the whole thing yourself.
Step 6. Automate how you share your report
The last step is to share your campaign performance reports with your clients or stakeholders.
You can do this on Whatagraph in three main ways:
- Share password-protected links to a live report.
- Send reports as automated emails on a regular timetable (e.g. every week, month, …)
- Export as Excel or CSV files.
(Psst. Now you can export data from Whatagraph to Looker Studio too)
That being said, how do you structure your campaign reports so your clients can clearly see the impact you drove? We lay it out in the next section.
How to Structure Your Campaign Report
A structured campaign report helps your clients grasp the key points of the campaigns that you’re running for them.
Lewis likes to keep the high-impact metrics at the top:
I start every report with a “Key Insights” section - this is the CEO’s two-minute takeaway. Here, we include a short, data-backed summary of what’s working, what’s not, and what’s next.
This is a good approach, as it sets the stage for secondary KPIs that provide additional context.
At Whatagraph, we've created multiple campaign reporting templates for marketers like yourself. Below, we're going to break down how we typically structure these templates.
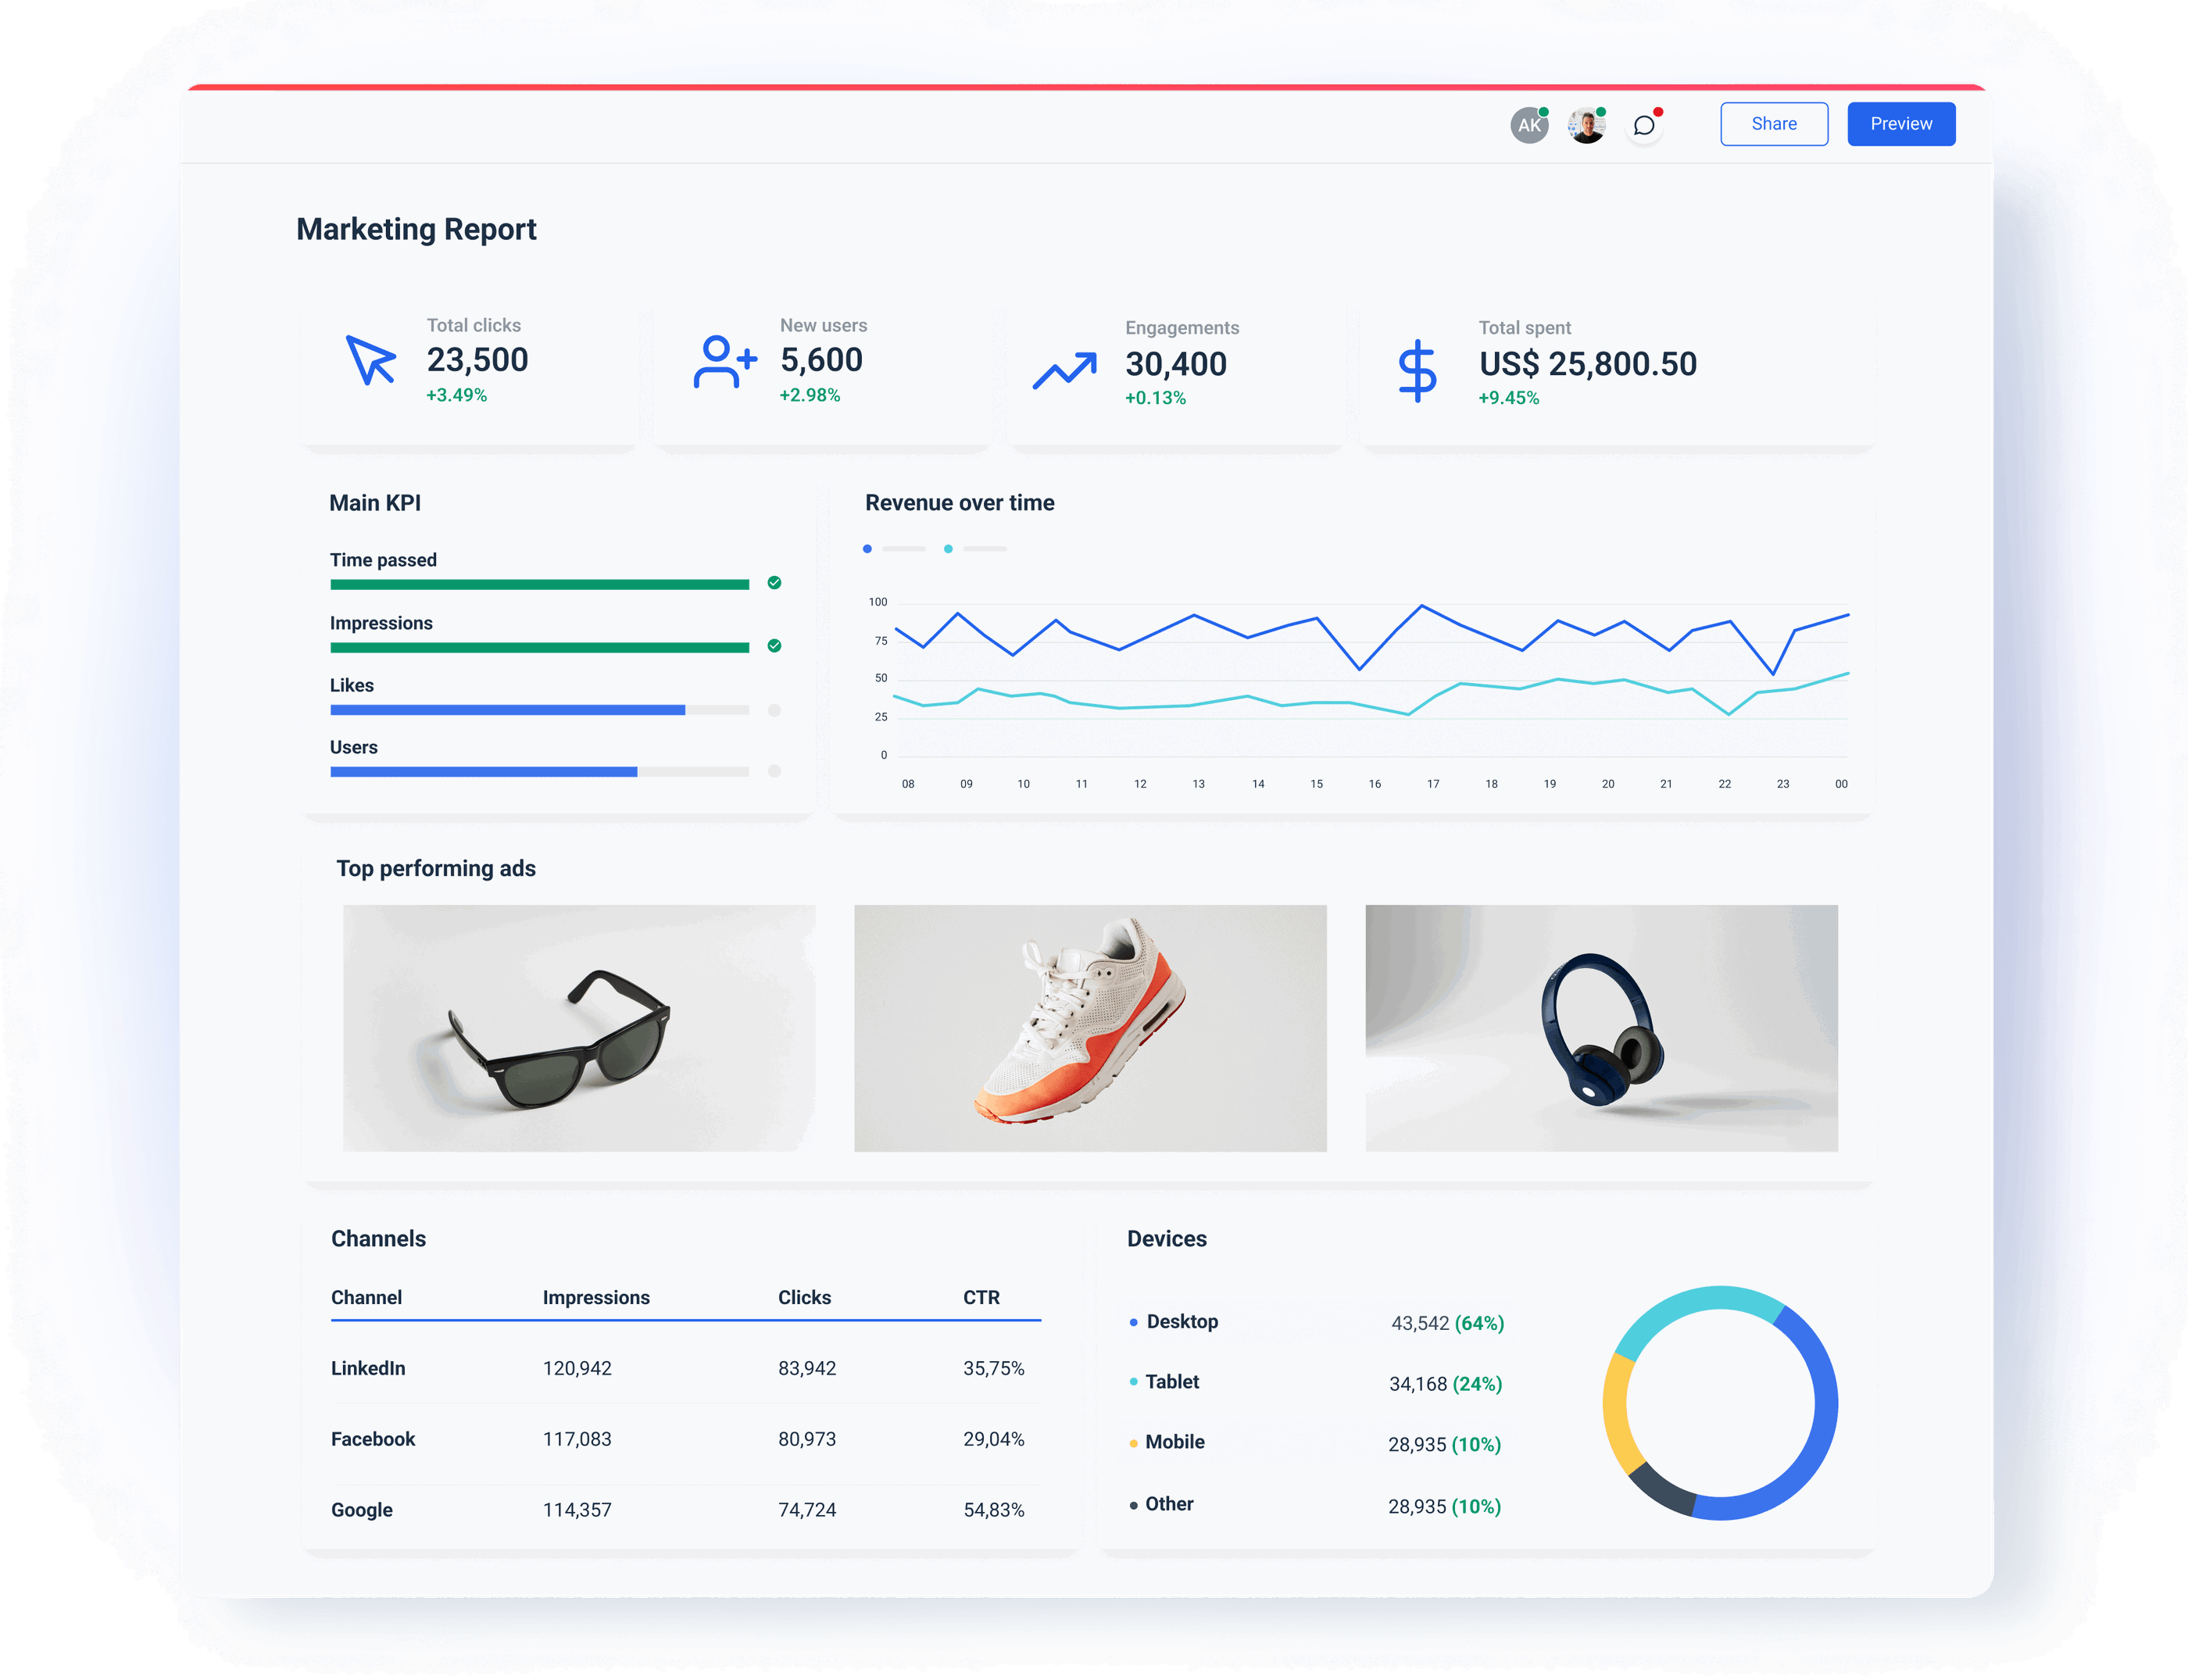
1. Cover image + campaign goals
A branded cover won’t tip your campaign this way or the other, but will make your report look professional at all times.
Use your logo to strengthen your brand or your client’s branding to make them feel valued.
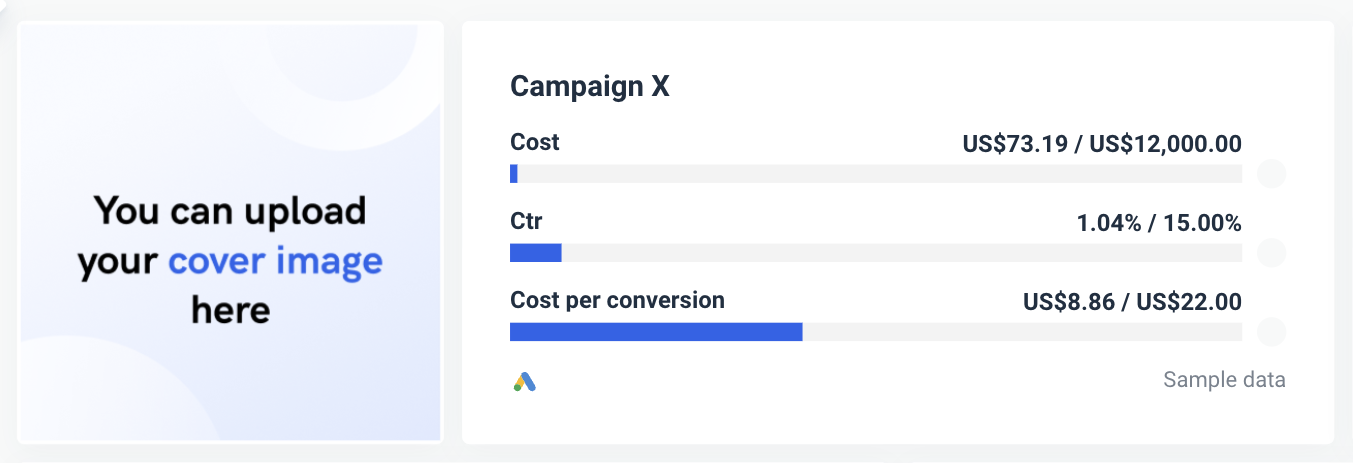
The campaign goals widget summary is a snapshot of your key campaign metrics, such as cost, click-through rate (CTR), and conversions.
It gives you quick information on how the campaign is doing.
Depending on the campaign objectives, you can customize this widget with different KPIs.
2. Campaign conversion funnel
The funnel charts break down the user journey so your clients or stakeholders can see how many impressions convert into clicks and clicks into conversions.
It’s useful for highlighting the drop-off points.
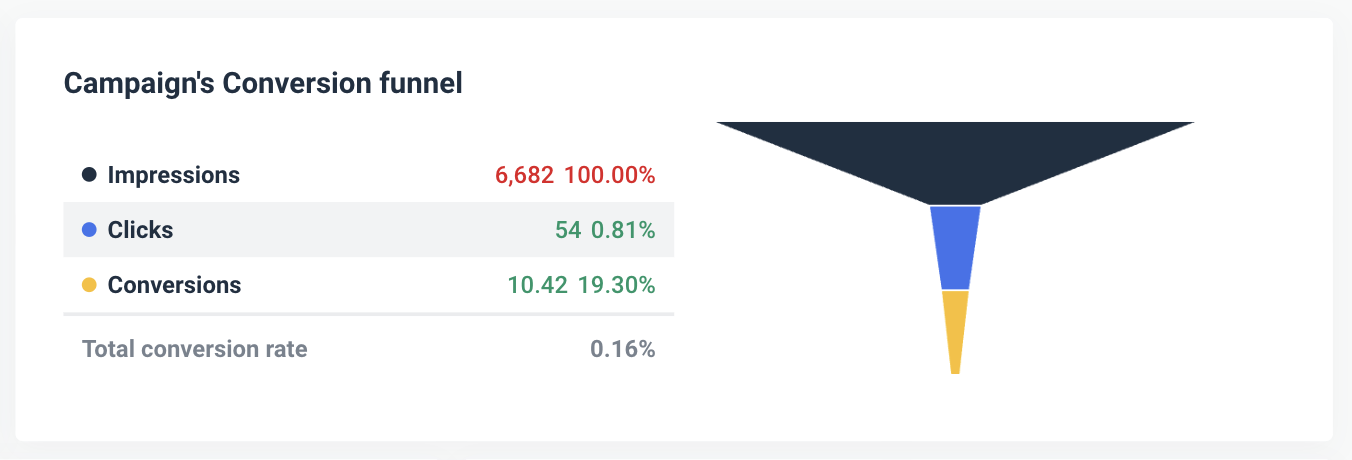
For example, if you have high impressions with low conversions, it might be a sign that you need to improve your landing pages or tweak the calls to action.
3. Single value widgets
Single value widgets give you important metrics such as cost-per-click (CPC), cost per conversion, and return on ad spend (ROAS) in a simple format that is easy to digest.
By looking at these, your clients can assess campaign profitability instantly.
For example, tracking CPC and conversion cost helps you manage campaign spending so your clients get maximum value for their ad budget.

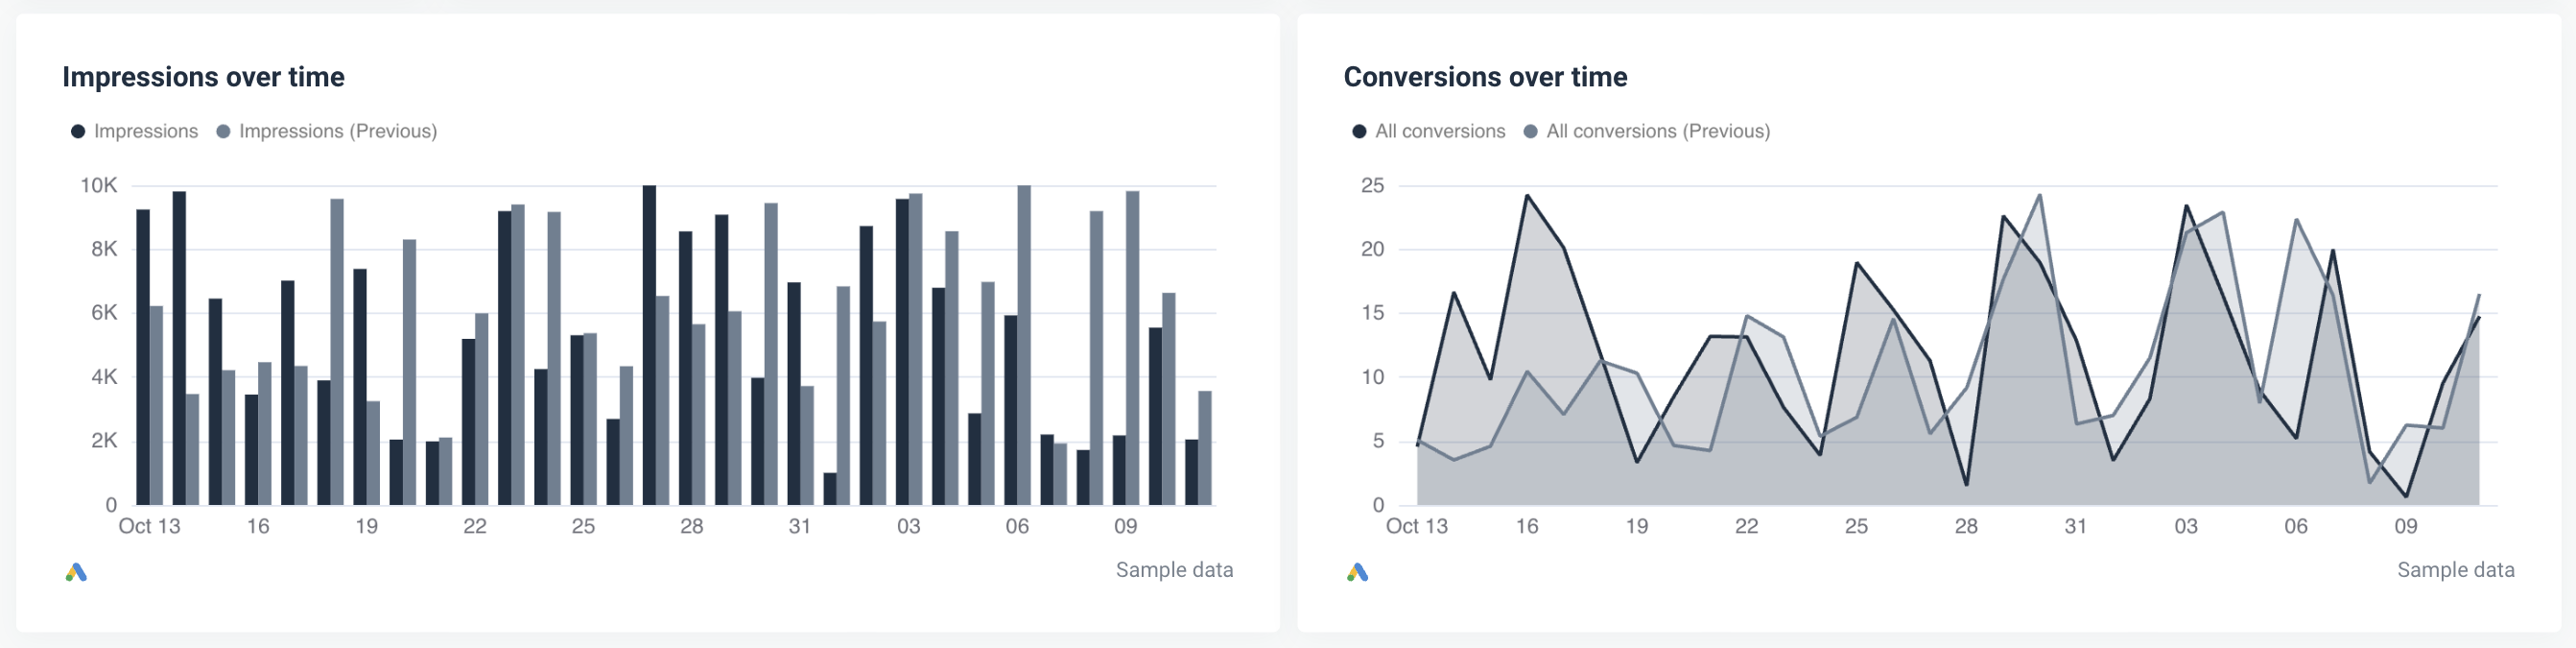
4. Impressions and conversions over time
Monitoring impressions and conversions over time helps you spot visibility patterns and correlate them to conversion spikes or specific campaign initiatives.
It shows you how visibility is impacted by seasonal trends or holidays and reveals conversion trends that can guide future campaigns.
For example, if you spot a high-impression period, you can increase ad spending or SEO activities to take advantage of those times.
5. Keyword performance
This table shows each keyword’s performance, including metrics such as impressions, clicks, average cost-per-click (CPC), and total conversions.
It shows how average CPC affects campaign costs, so clients can understand where they need to increase spending to maximize cost efficiency.
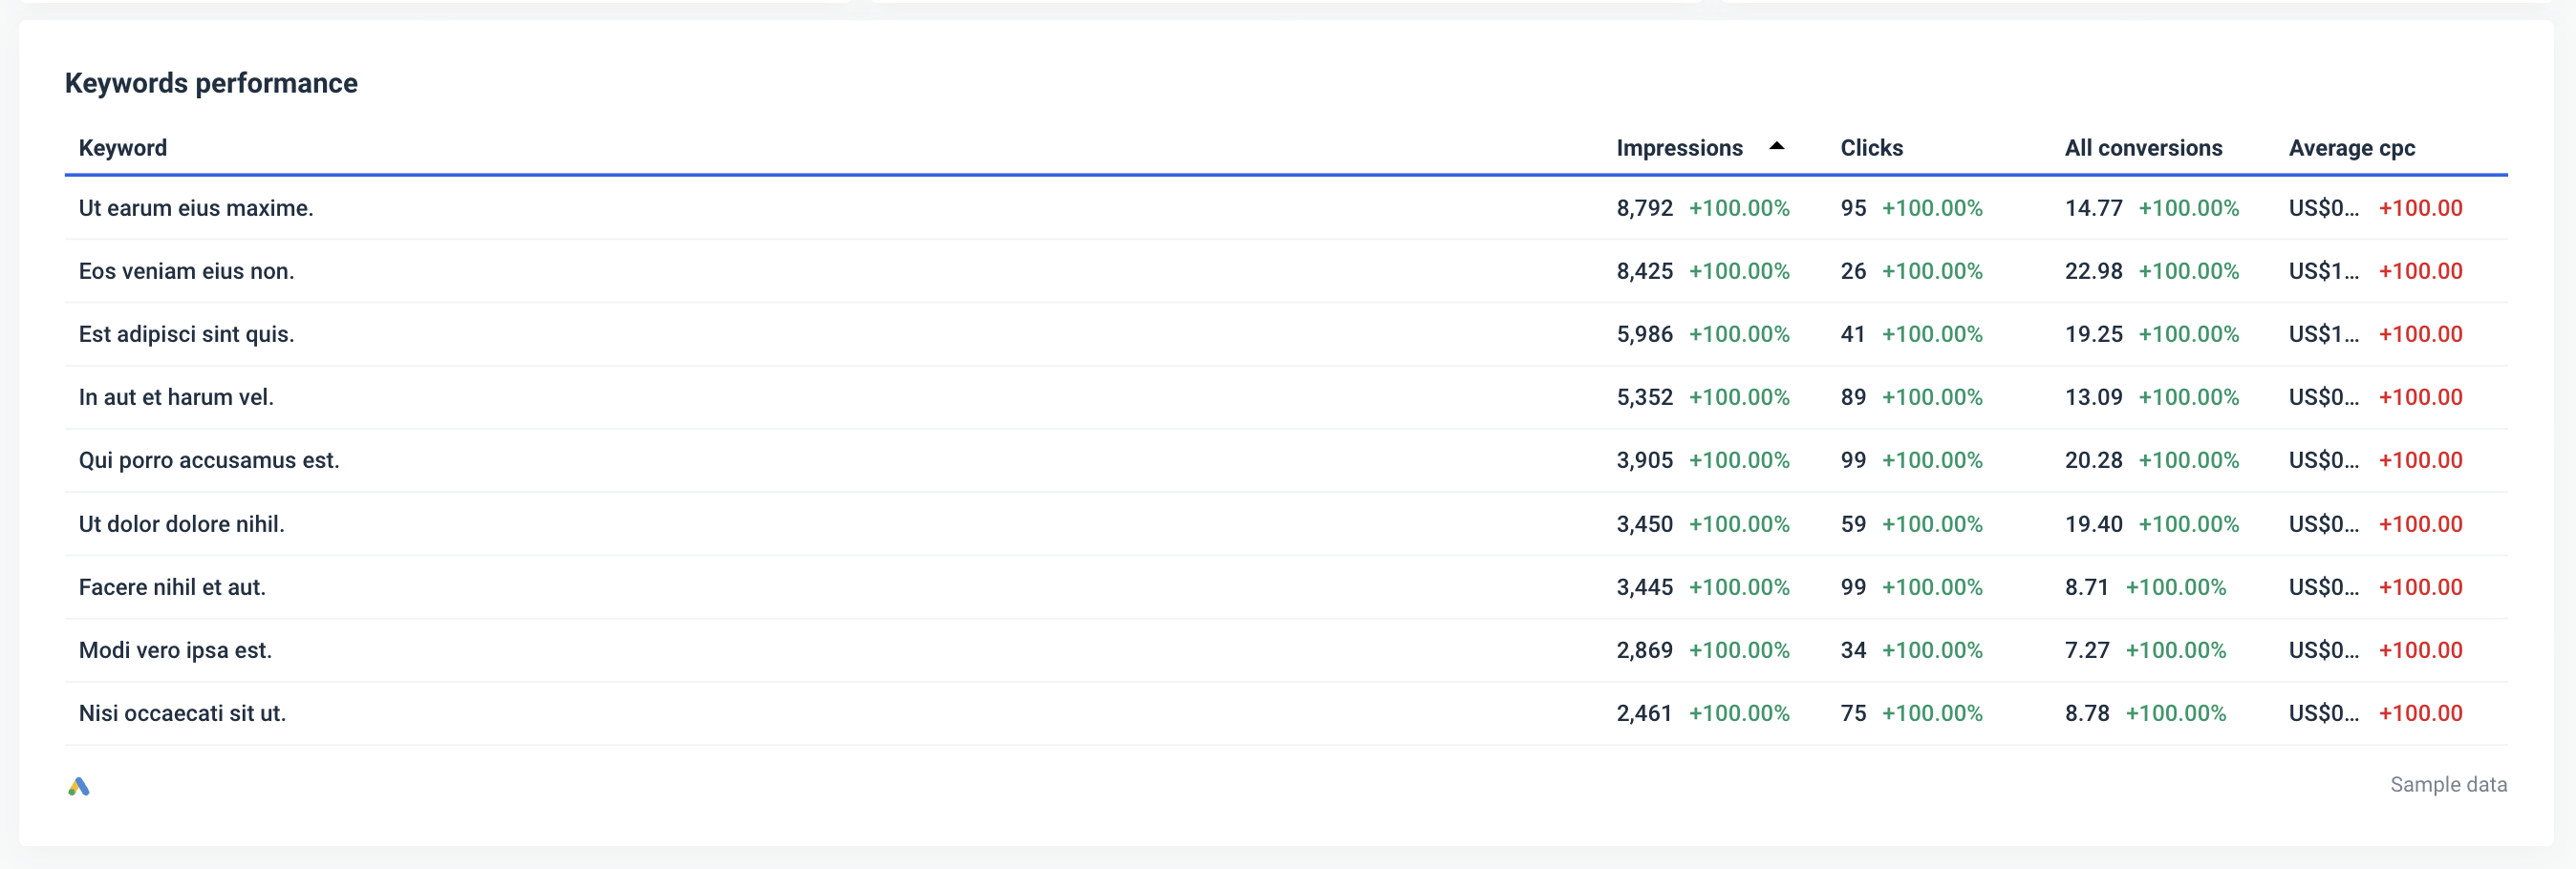
This section also helps you identify high-performing keywords to invest in, as well as low-performing ones that could benefit from optimization or removal.
6. Insights and recommendations
In this section you should provide specific further actions for optimizing your campaign. These should be actionable insights based on the data from the report.
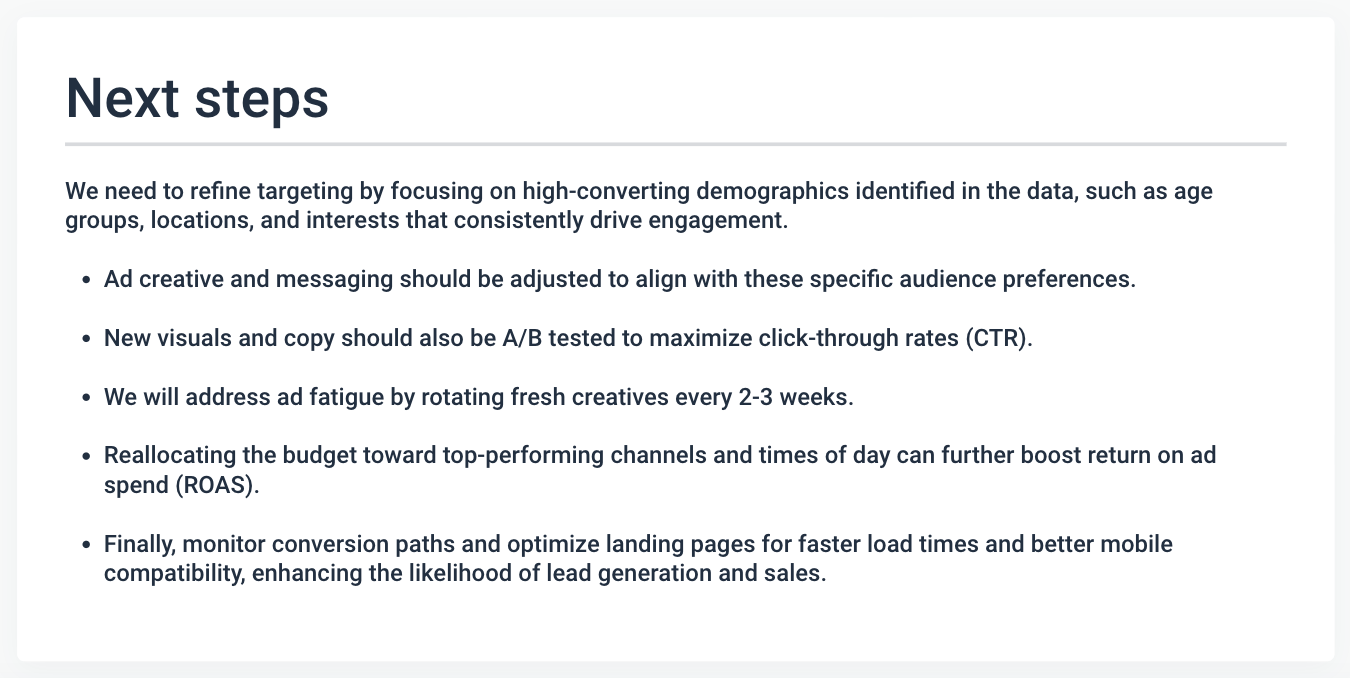
This is a key section that sums up all the data, and you should never skip it.
Jauncey goes one step further from written insights:
We also send a personalised loom recording to those clients who can't jump on a call to go over data making it super easy for them to access data.
---
We hope this guide has been helpful in creating a campaign report for your clients.
If you'd like to try out Whatagraph, book a demo and tell us exactly how we can level up your reporting.
Not sure we’re the right choice for you? Compare Whatagraph with competitors and make your decision with more confidence.
Published on Feb 25 2021
WRITTEN BY
Nikola GemesNikola is a content marketer at Whatagraph with extensive writing experience in SaaS and tech niches. With a background in content management apps and composable architectures, it's his job to educate readers about the latest developments in the world of marketing data, data warehousing, headless architectures, and federated content platforms.