How Market Solutions Saves 30% of time on Creating Reports While Managing 150+ Clients
How do you scale your marketing reporting for 150+ clients with just 15 people in your agency? By switching from Powerpoint presentations as your reports to a modern reporting solution.

Sep 09 2022 ● min read
Table of Contents
- The challenge: scaling an agency with manual reporting
- Searching for a solution: automating reports with Whatagraph to save time and money
- The results: saving 3-7 hours on each report
- The takeaway
This is the story of MarketSolutions, a marketing agency operating in Sweden. They offer services such as media planning, analysis, leading projects, media buying, and many others. Before trying out Whatagraph, they created marketing reports using Powerpoint, wasting precious time and resources.
Today, we’ll show you how they get to manage 150+ clients with a team of just 15 people and save 30-70% of time on reporting by using Whatagraph, depending on the sources being used.
The challenge: scaling an agency with manual reporting
Market Solutions used Powerpoint presentations for reporting on their results, which was far from practical. According to Karl-Viktor Jorkby who is in charge of digital media planning at the agency, it took them an average of 5-10 hours to create a single report. As a result, the agency could not scale and get new clients as that meant even more time spent on reports.
The biggest downside to creating report presentations manually is that because so much time was spent on creation, they had no time left for analysis. In other words, they want to analyze and explain the results of the report instead of just presenting raw data.
Searching for a solution: automating reports with Whatagraph to save time and money
Market Solutions knew that they needed a tool that would help connect, visualize, and share all their clients’ marketing data bringing intuitiveness and automation to the table. The following criteria were considered:
- A good number of native connections with marketing platforms used, including analytics, social media, Google Ads. And the ability to bring in custom data with Google Sheets if needed.
- Ease of use. The intuitiveness of the report building, having sources connected in a few clicks, pre-made and custom building blocks, etc
- Seamless report sharing. Both automated send-out of emails at the beginning of the month and the ability to create links to live dashboards for on-demand data access.
Because of the wide range of services Market Solutions provides and the variety of clients, they need access to a myriad of different sources and Whatagraph fit the bill perfectly together with meeting all of the criteria above + more.
The results: saving 3-7 hours on each report
If you’re wondering how a team of 15 can serve 150+ clients, the answer is efficiency. And much of that ability to scale comes from the time freed up with marketing reports. Karl-Viktor says that they could save even more time if some reports did not require additional images and screenshots.
The time they need to create a report varies by client because some reports require more hands-on work. However, they currently save 30-70% of the time on each report (depending on how many sources are connected) with Whatagraph compared to creating reports manually in PowerPoint.
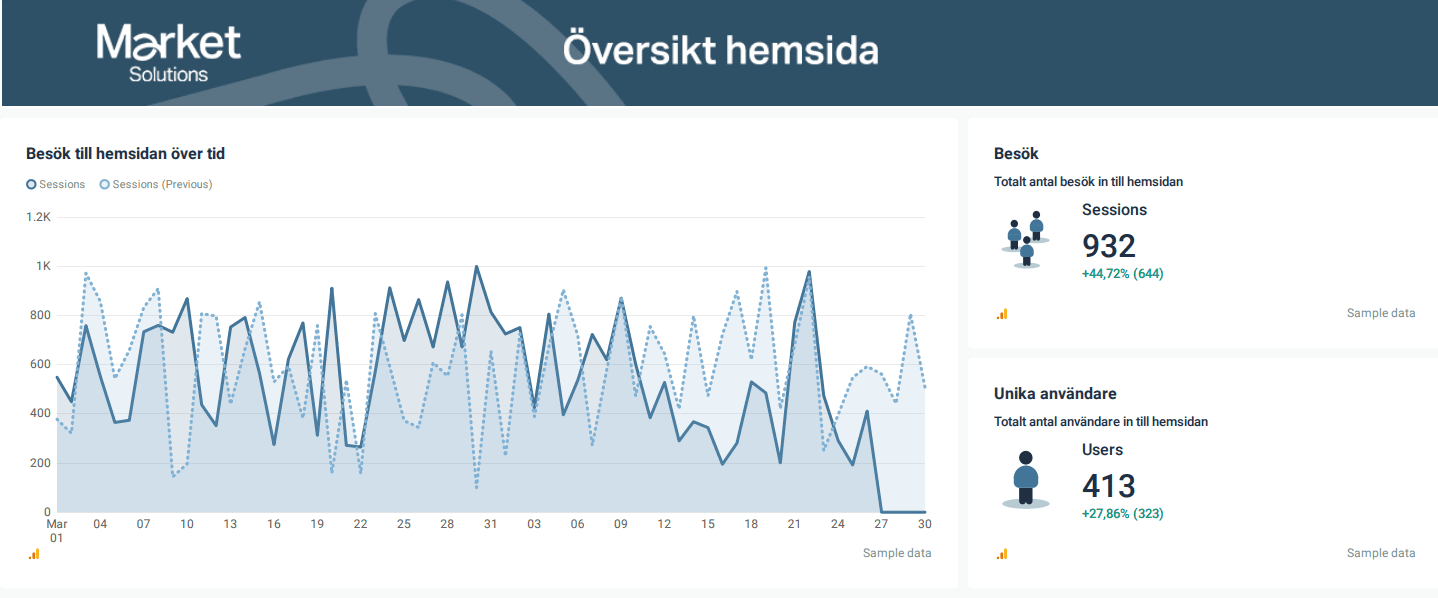
Speaking of which, the time the agency saves on reports is spent on clients who are much happier with clear and insightful reports. The agency achieves this by doing small things such as grouping the report items according to the channel. This way, all social media channels are in one place. Or dividing reports into clear sections with separators like this:
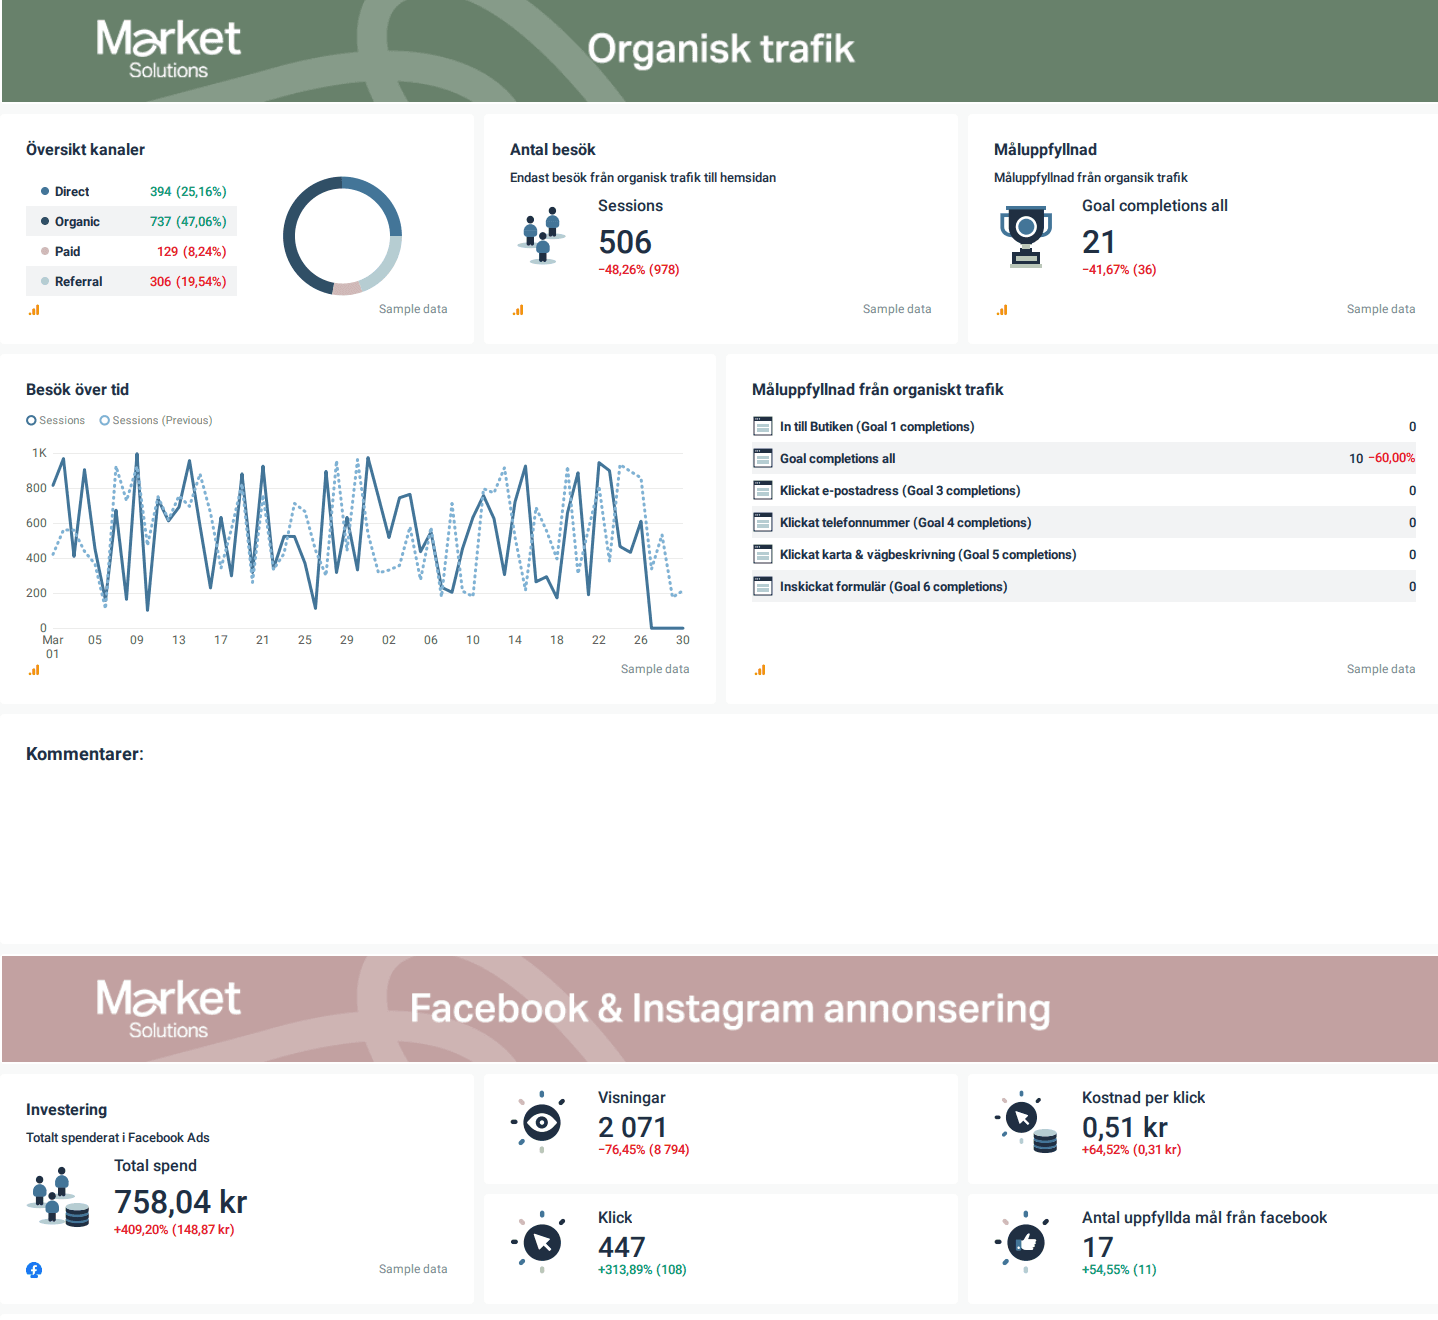
However, the one area where Market Solutions excels is insights. After each segment in the report, they add a few comments about the results - what went wrong, what worked well and what can be improved. Here you can see the comment section after one of the report parts:
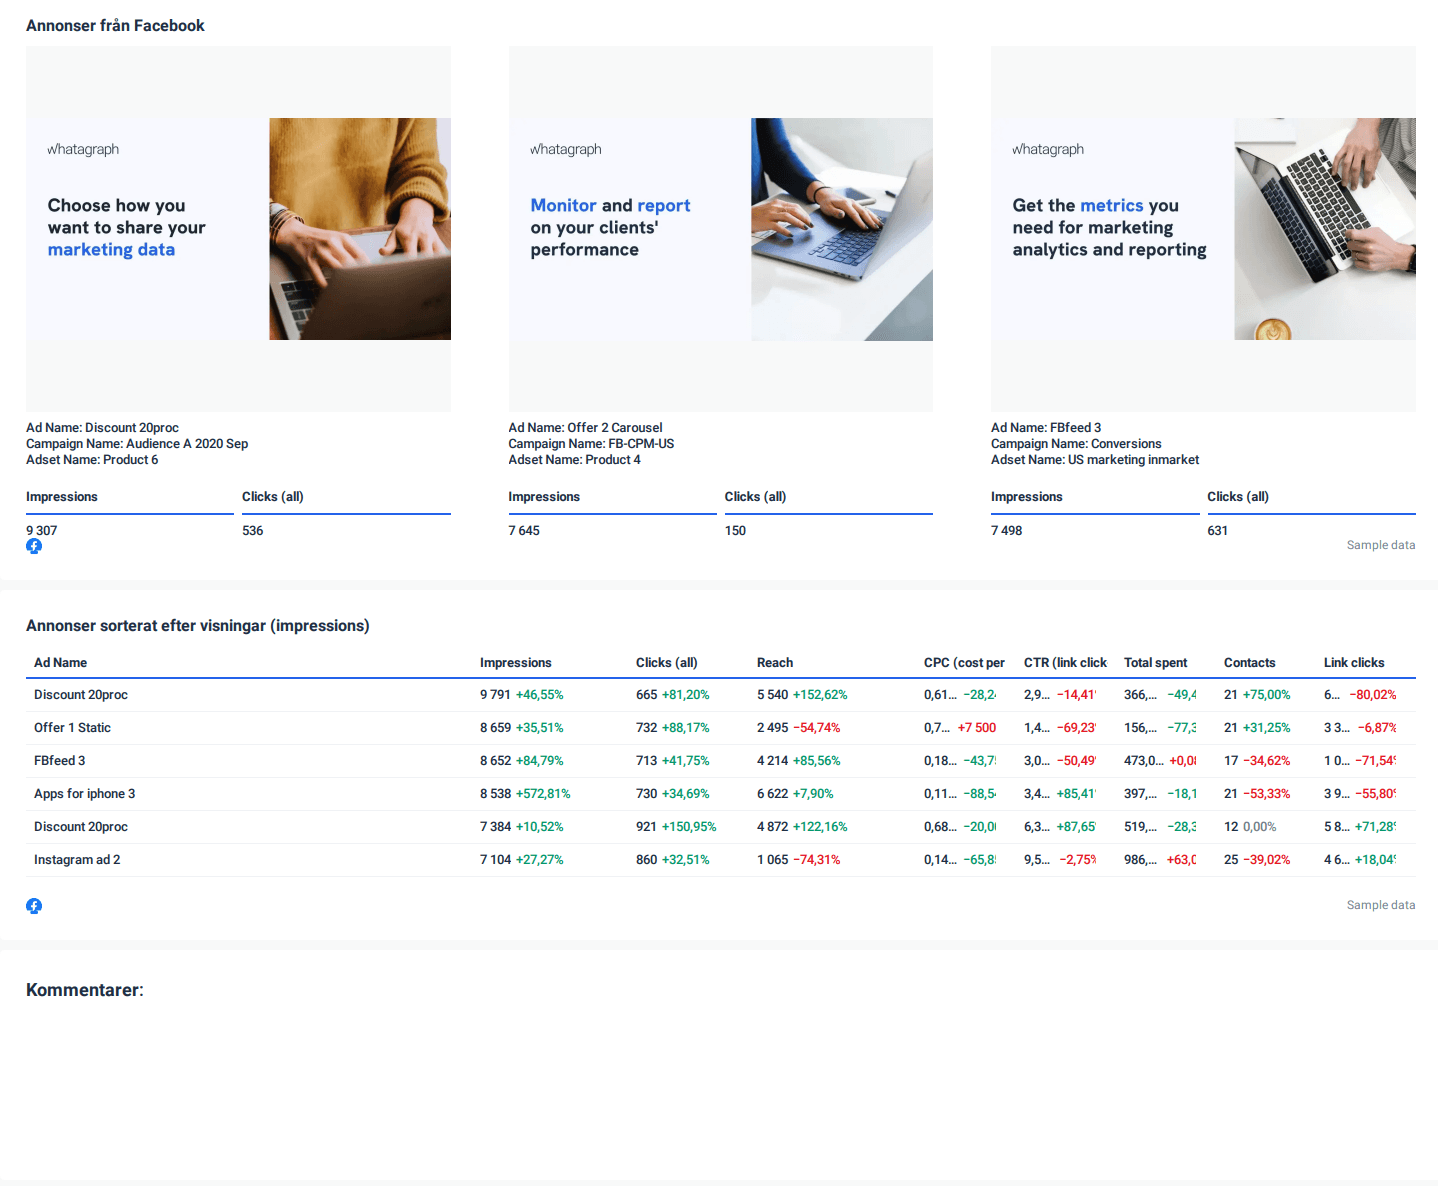
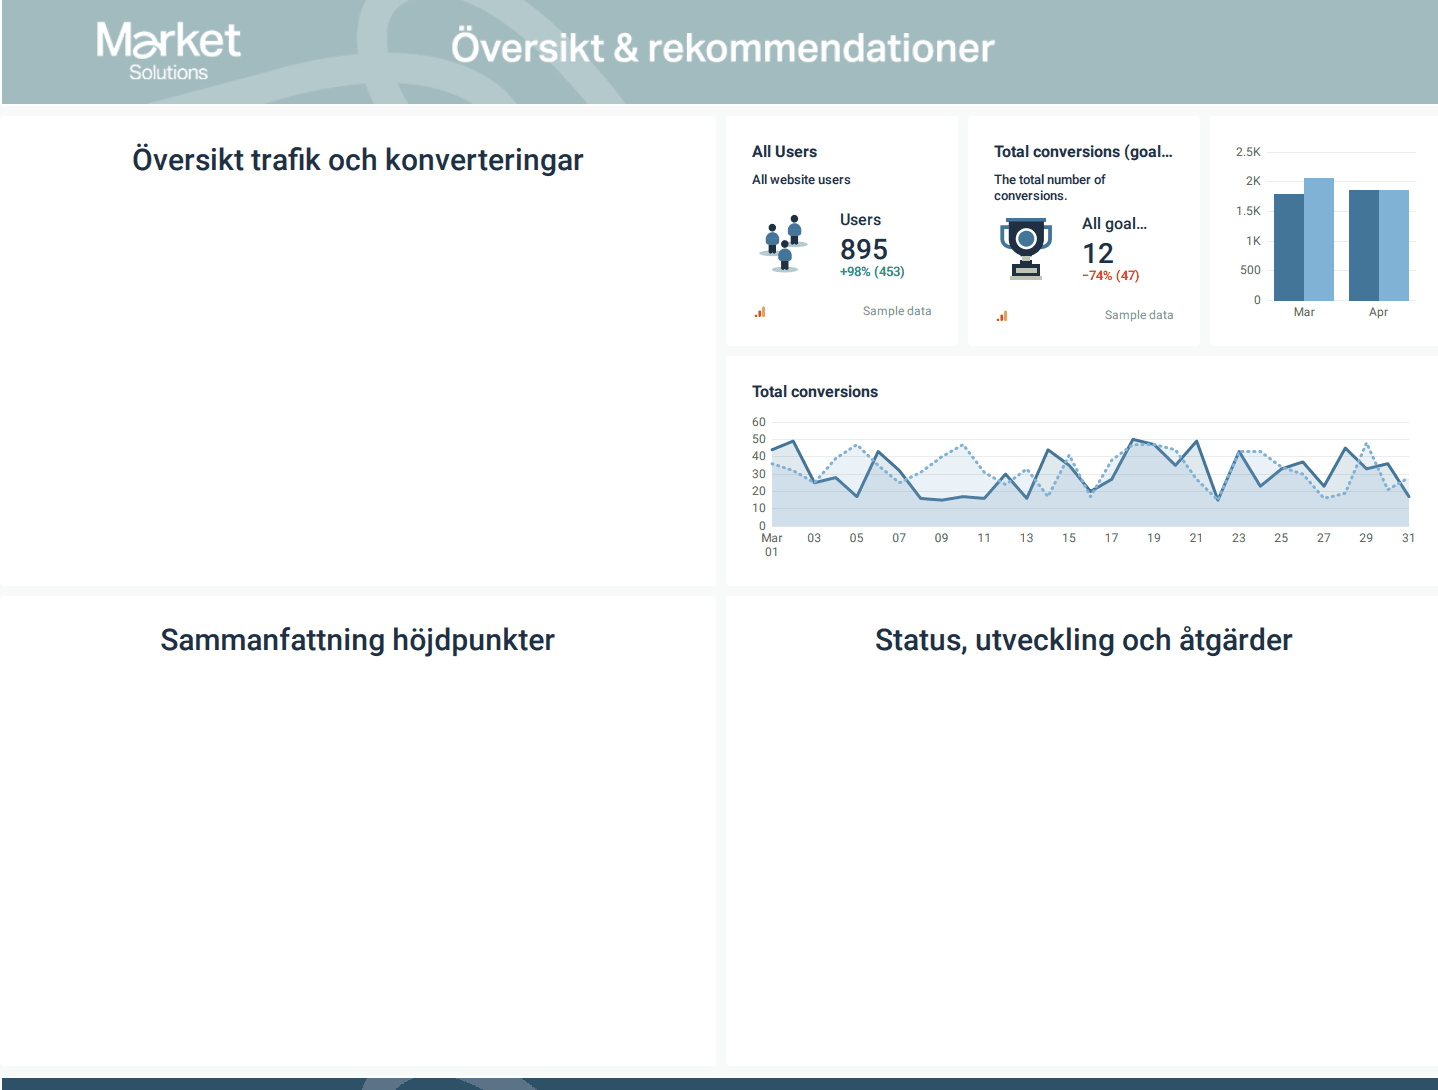
This gives clients a much better idea of the work that was done compared to plain numbers. When they finish with all the segments, they take the comments and add them all together at the beginning of the report as a summary. Here we can see multiple comment fields to insert findings and recommendations into the executive summary:
Finally, when it comes to sharing, a direct link to a report with interactive data and the ability to pick date ranges is one click away. It provides Market Solutions’ clients with access to data from anywhere at any time without involving someone on the agency side in ad-hoc requests.
The takeaway
Saving time and increasing productivity is just one aspect of choosing a robust reporting tool such as Whatagraph. With the time they won back, Market Solutions expanded their client base but also ensured that they provide more value to their clients, not just with their work, but also with improved and personalized reports.
Do you want to scale your agency, win more clients and create better reports today? Sign up for a free trial of Whatagraph to get started!
Published on Sep 09 2022
WRITTEN BY
Mile ZivkovicMile is the head of content at Whatagraph in charge of all content and communications for Whatagraph’s marketing data platform. A marketing heavy with almost a decade of SaaS industry experience, Mile has managed multiple content marketing teams without losing an ounce of his writing passion. The author behind some of the most-read pieces on our blog.
