How Rekom Group leverages Whatagraph to track marketing activities for 200+ venues across four countries
A global player in the nightlife industry with 200+ brands now uses Whatagraph to connect data across all countries and evaluate the results of its marketing tactics for the whole business or, if needed, drop down to a single venue with a few clicks.

Jun 05 2023 ● 5 min read
Rekom Group is the largest "nightlife" group in Northern Europe, with over 20,000,000 guests every year across the UK, Denmark, Norway, Finland, and more incoming.
Their business is split into multiple brands and brand groups. It includes nightclubs, dining, events, and bars. Each brand in each country has its own online paid and organic social media presence, runs its campaigns, and operates websites.
The challenge: tracking multiple marketing assets spread across countries and brands
With so many venues’ marketing assets spread across Europe and divided by brand names and custom styles, the challenge for Rekom was: how do we track all this and bring it all together for both executive-level reports and more granular analytics? Specific tasks included:
- Connect marketing sources for all those venues, like analytics for their websites and social media accounts to one platform.
- Bring metrics from those sources into cross-channel marketing reports and dashboards. Create reports by single venue, country, and for all brands on the executive level. And track marketing performance all across.
- Share that data internally with stakeholders and board members.
Why do Rekom and other cross-national businesses choose Whatagraph?
Whatagraph is an all-in-one platform where marketing teams connect, visualize, and share their marketing data. Whether it's hundreds of venues across Europe, clients across the world, or multiple branches in one country, we make marketing reporting and monitoring easy and scalable.
It’s easy to connect all the marketing data under one roof with smooth source management. It takes a few clicks to get multiple channels in one report or dashboard. That data is visualized in cross-channel reports that are easy to make with pre-made or custom blocks, intuitive filters, and formulas, saving anything as a template for bulk edits, etc.
And when it comes to sharing, there are multiple options, including automation or direct links to live dashboards.
In this case study, we'll take a closer look at how Whatagraph solved Rekom’s challenges.
Connecting scattered accounts, platforms, and channels in one place
Rekom does all the source management in a single hub in Whatagraph, accessible both from the Home page and inside their reports and dashboards.
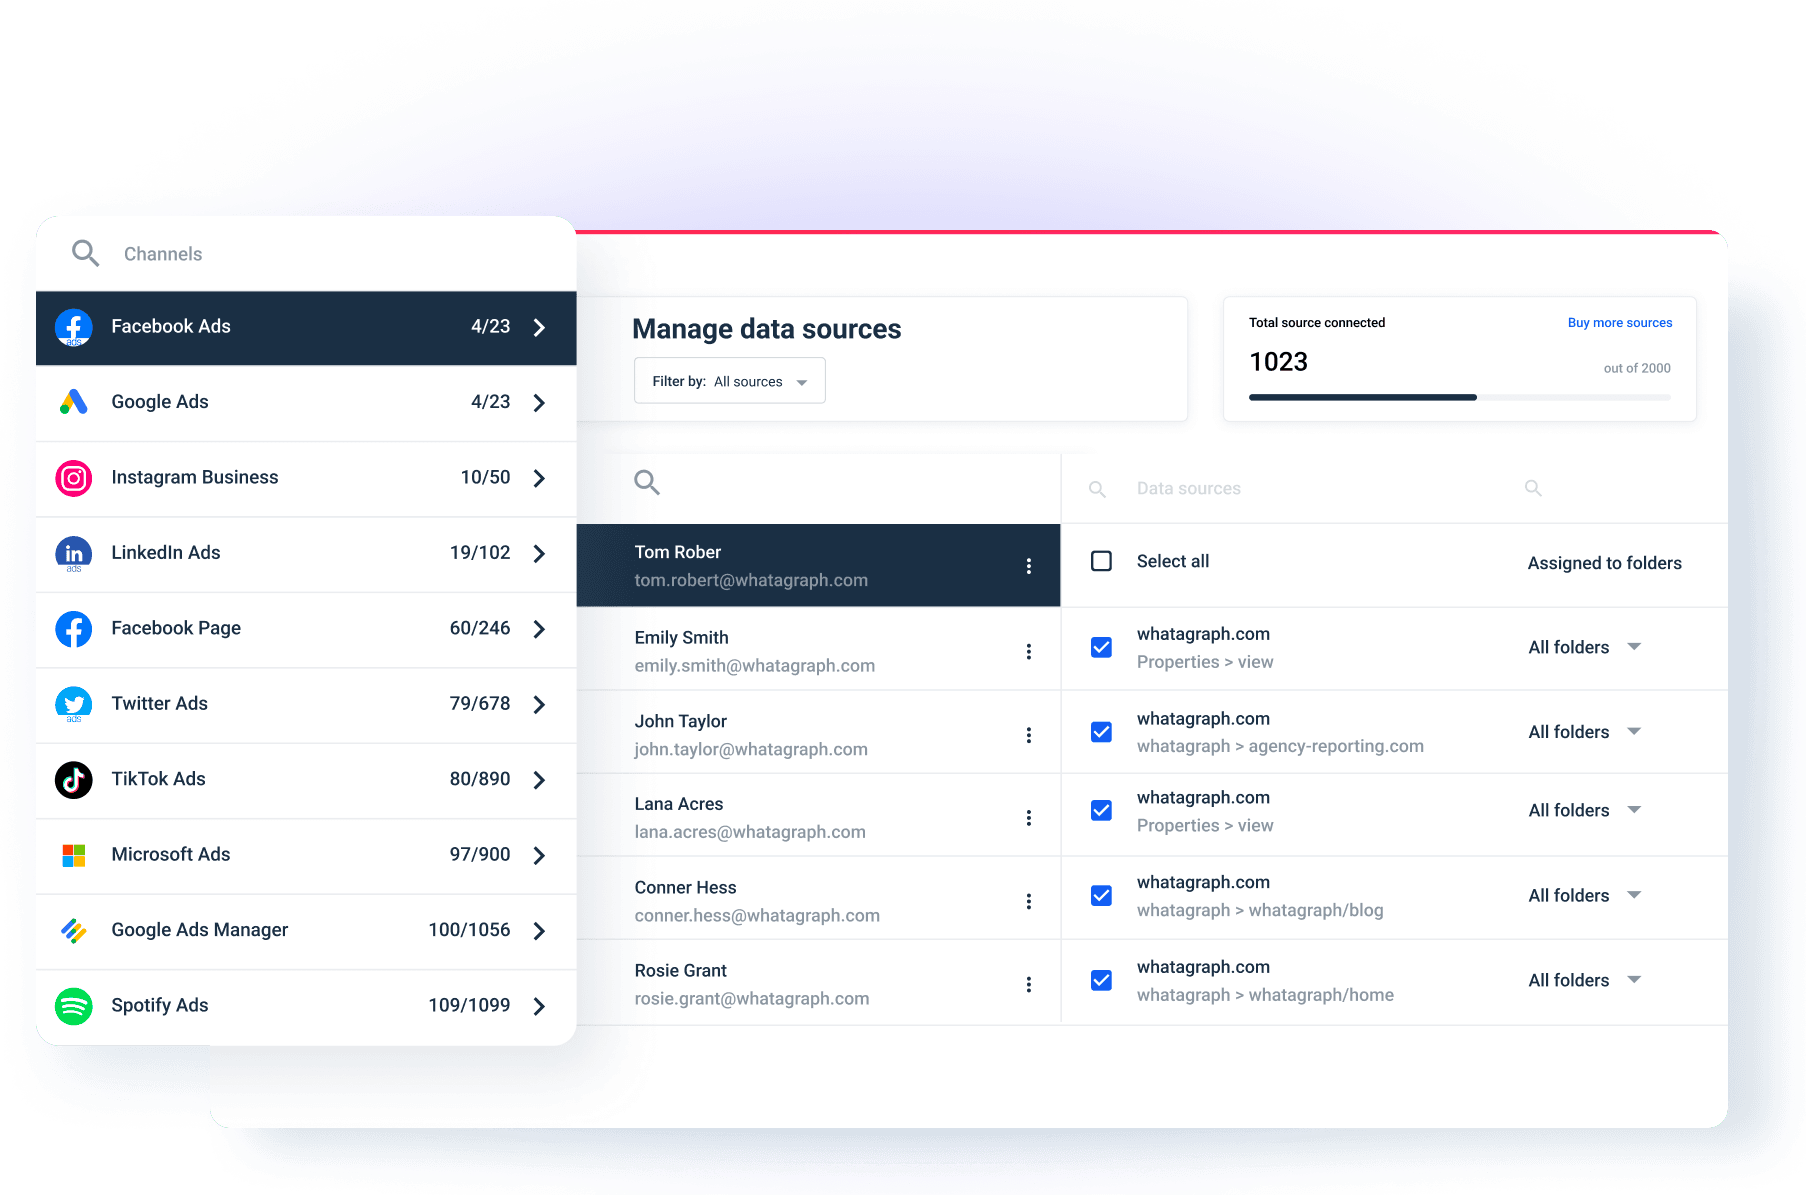
Here Rekom can see all their sources. In their case, it's mainly social media and Google Analytics 4. And which channels (accounts or websites for each venue) are connected. It's also the single tab where they can assign those sources to specific folders.
In Rekom's workspace, folders represent different countries. But Whatagraph allows you to create any custom folder structure, depending on your business units, functions, and teams.
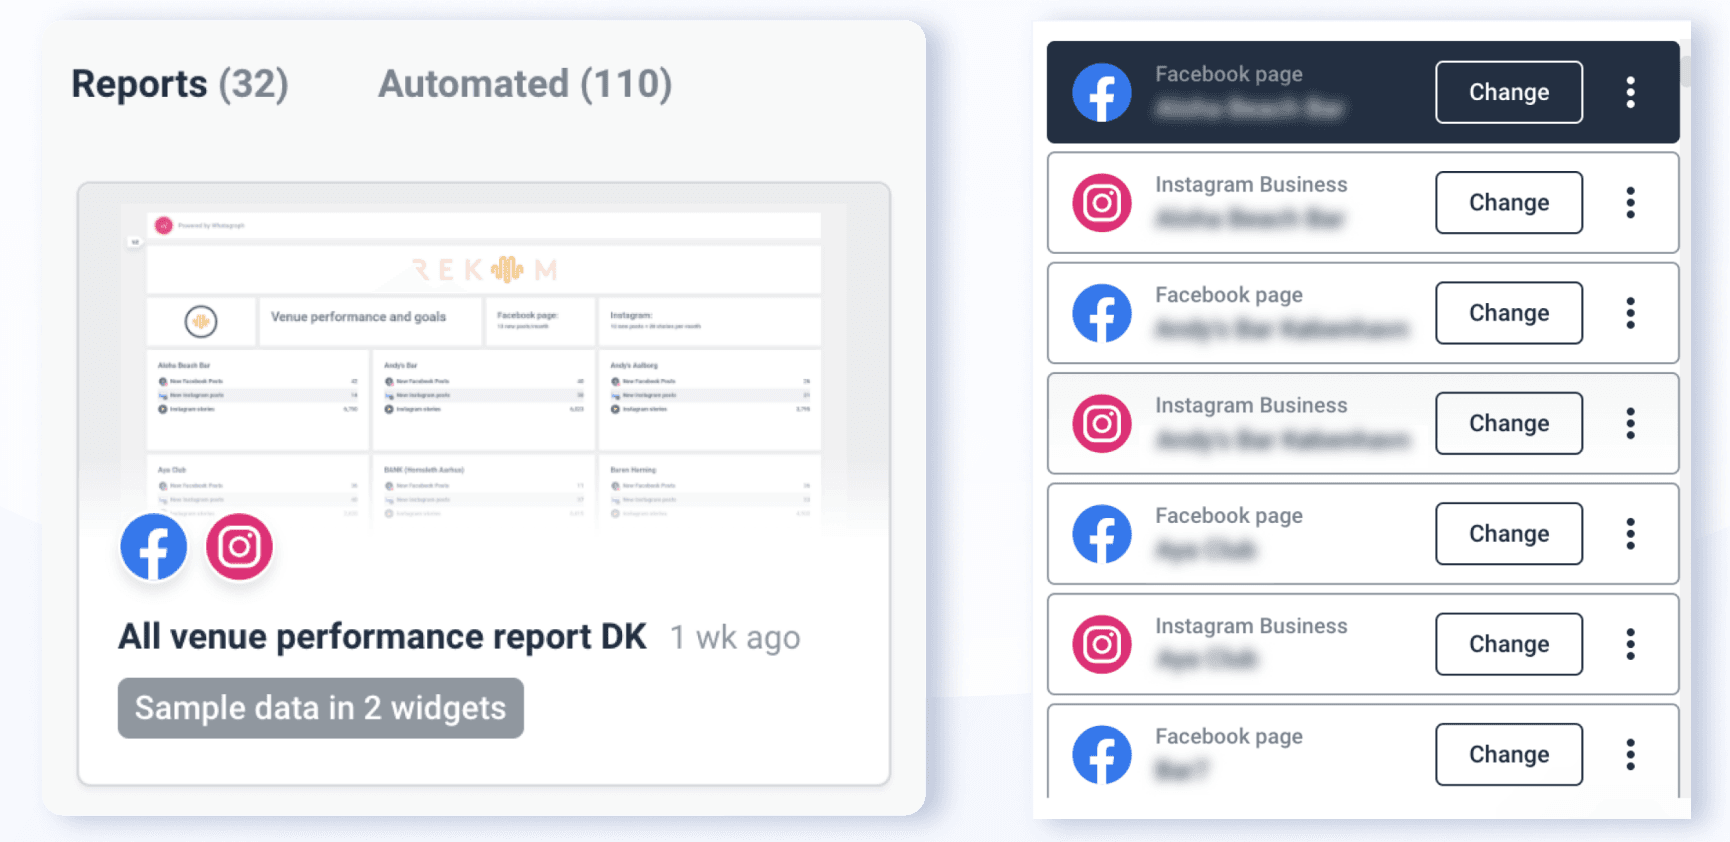
Inside each country's folder, country-level reports allow Rekom to track and optimize the performance of multiple venues at once. And reports and dashboards for a single venue contain a specific set of social or web assets.
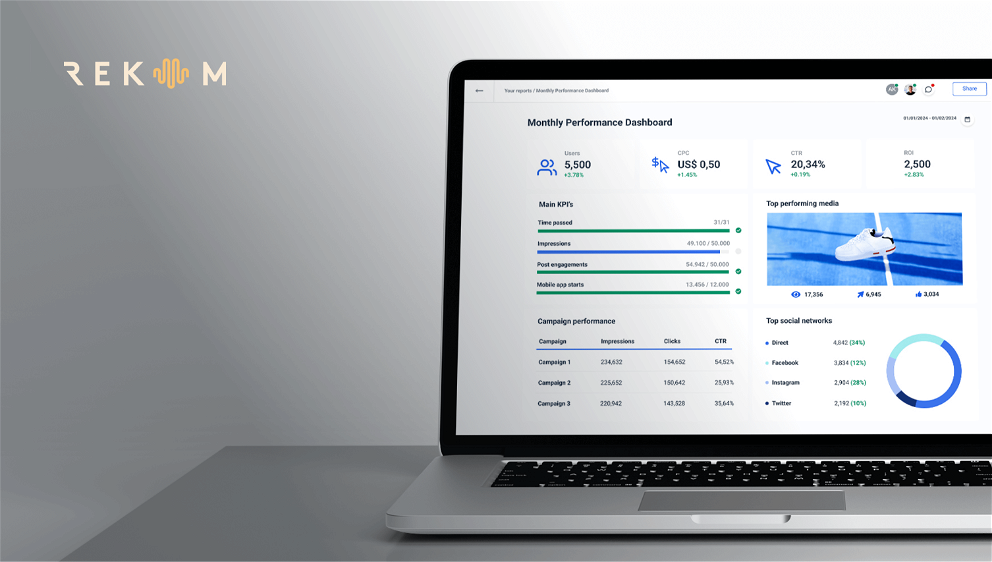
Here is what a single report example looks like for all Denmark venues and their connected sources:
This smart source and folder management helps Rekom easily navigate its 200+ brands and four countries. And in a few clicks, look at marketing metrics on a global level, or get down to a country or specific social media KPIs for a single pub or nightclub.
Building reports for a single venue or a whole country’s brands
One of the deciding factors in choosing Whatagraph for Rekom was not only that navigation in their complex brand system is easy but also that building a report for a single club is as simple as it is to create a country-level dashboard.
Because after all the sources are connected, and folders are assigned, creating those comes down to a simple drag-and-drop from multiple pre-made building blocks provided by Whatagraph or custom ones created by Rekom.
We can't show the insides of Rekom's reports. But we are happy to demonstrate the features they used to build those.
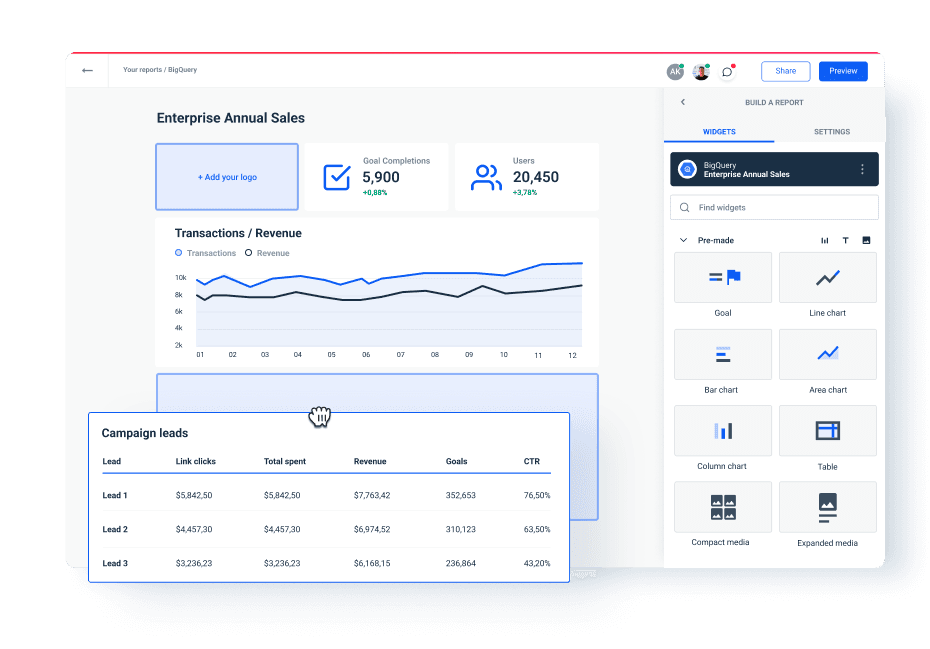
For each integration (marketing channels and sources), Whatagraph provides multiple pre-made widgets that have the metrics pre-selected to represent a data point.
Or you can build your own graphs, charts, funnels, tables, and more by selecting the metrics and their looks manually.
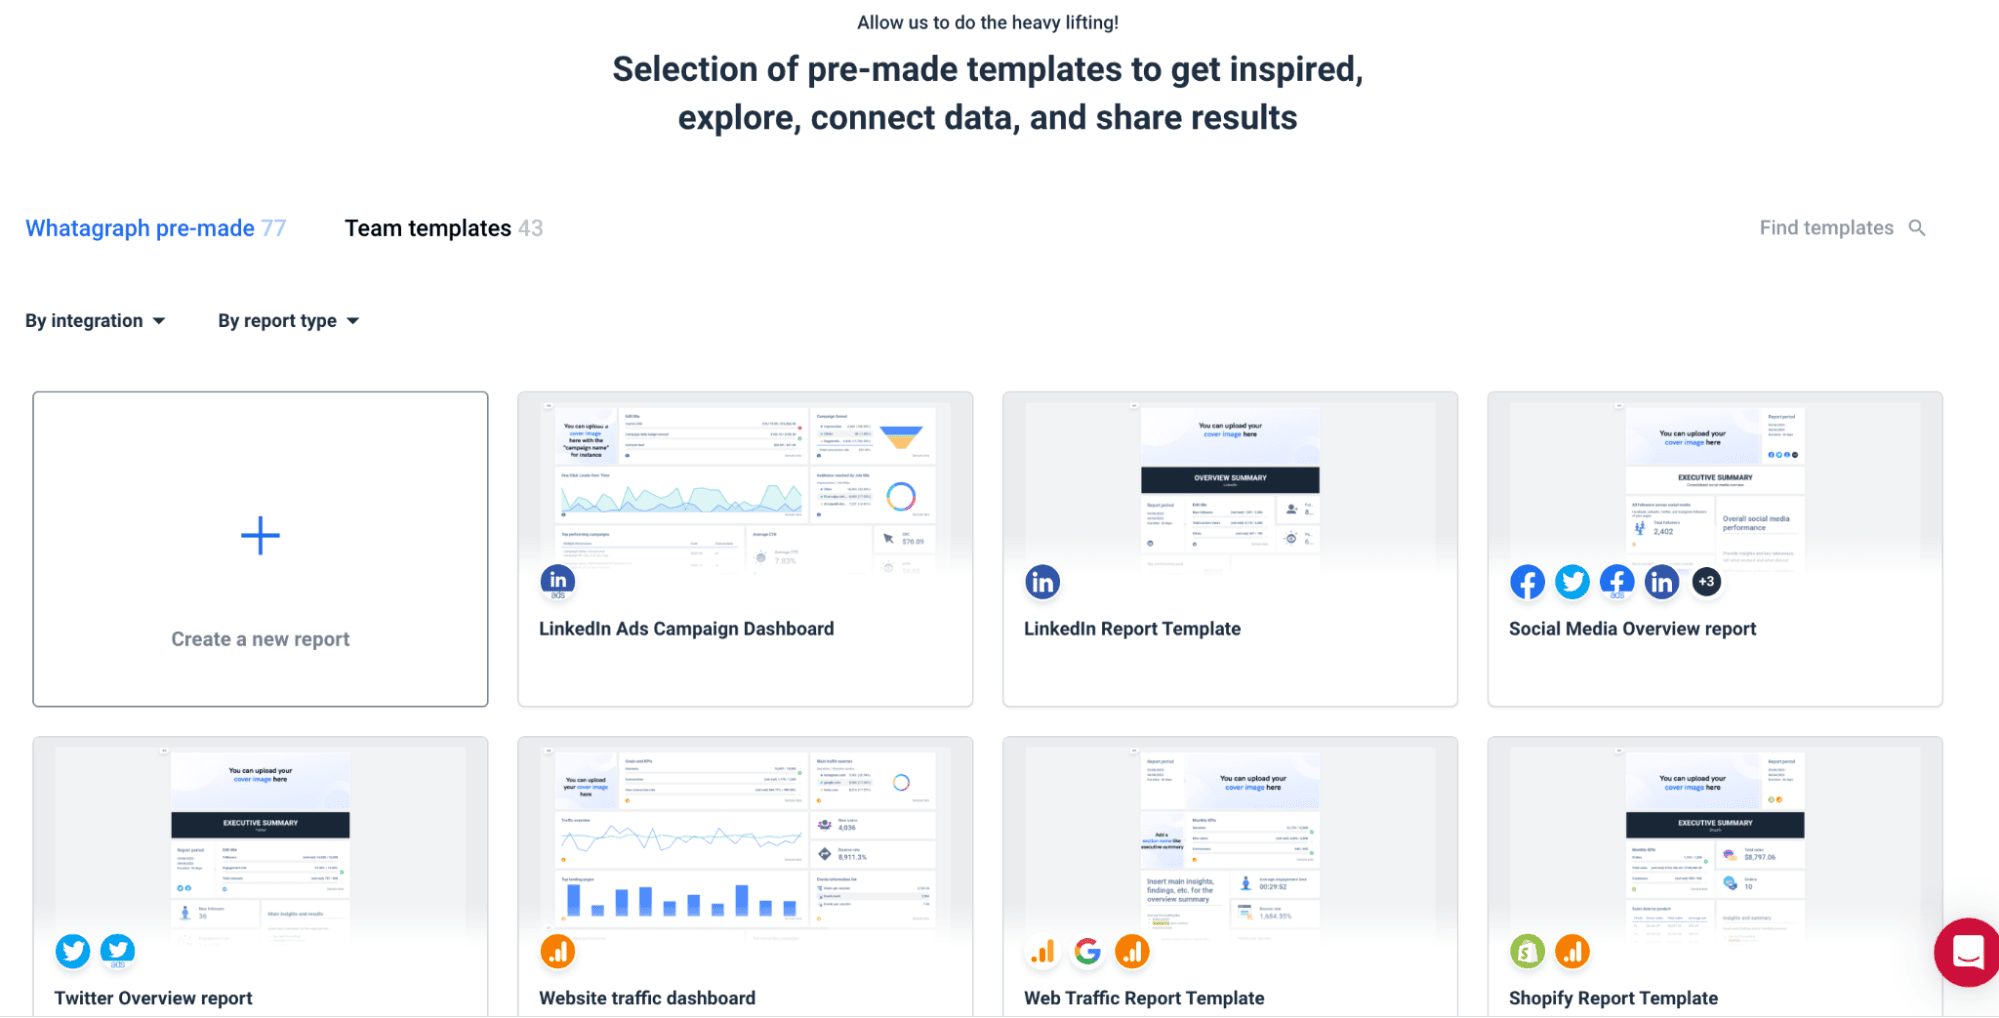
There are also multiple report templates like this one for each integration that come with a predefined structure and widgets for inspiration and customization instead of starting from a blank page.
So whether it was a country-level executive report or a single venue performance dashboard, the Rekom marketing team had the same intuitive building process.
They could pick a "goal widget," for instance, and combine all the followers' metrics from multiple Facebook pages for their clubs and pubs to track the progress of that KPI. Or create a table with all running campaigns for one brand to see costs, CTR, leads, etc.
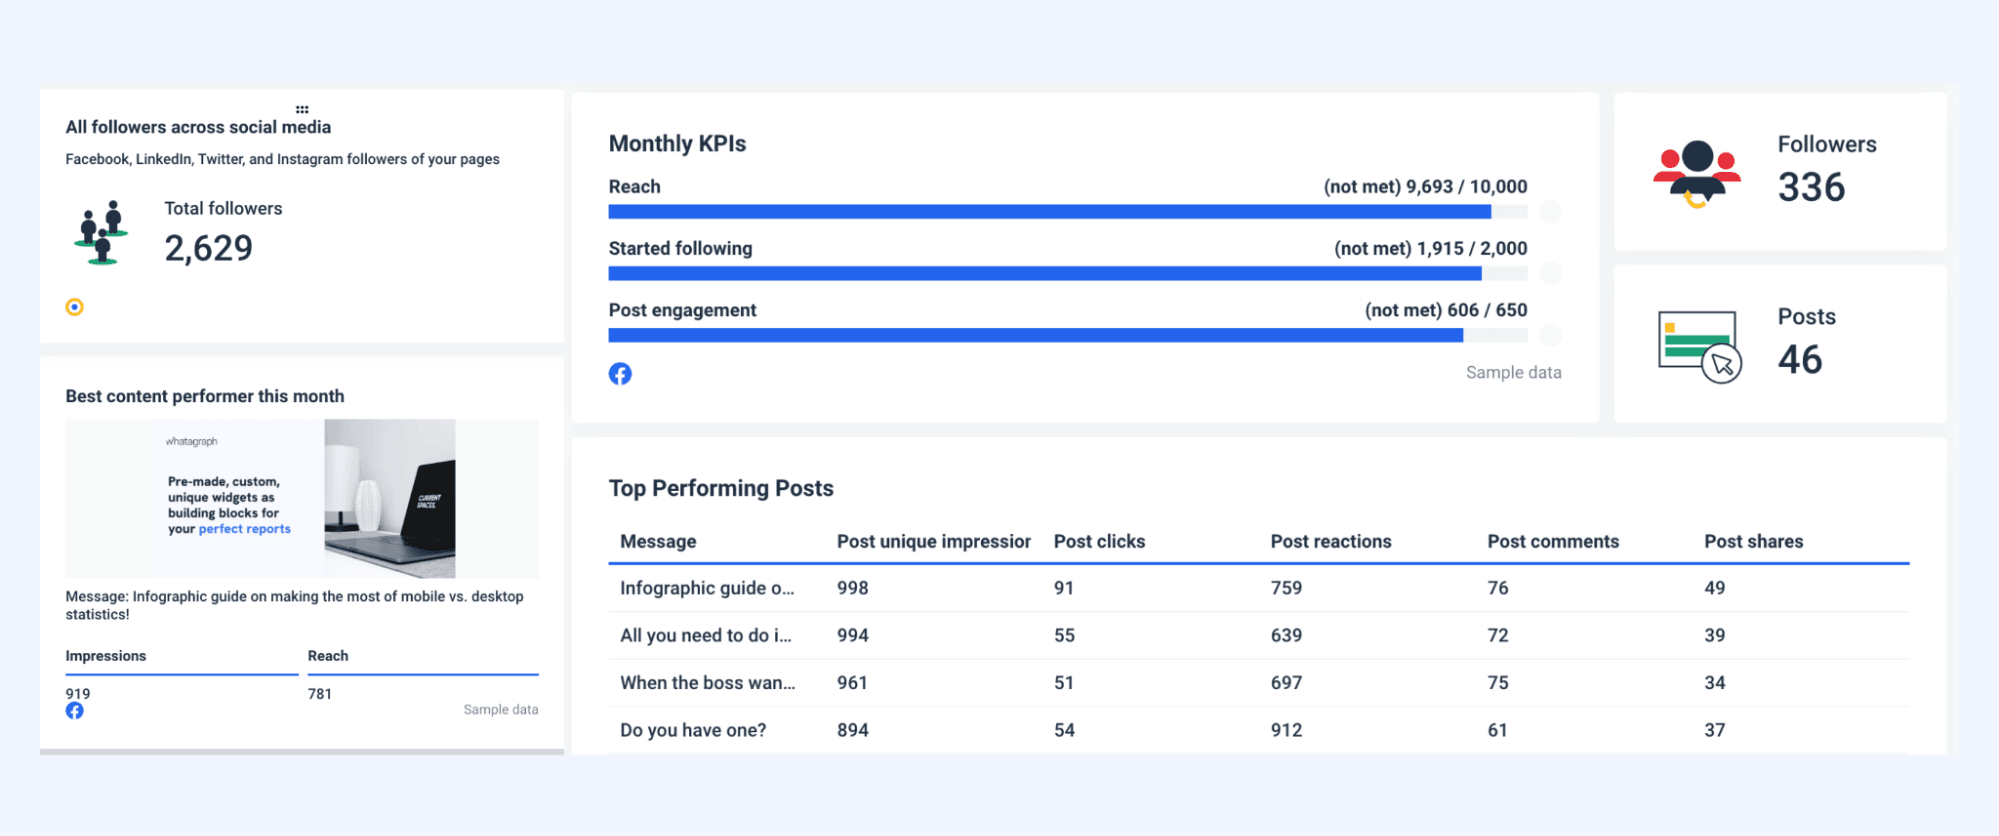
The insides of those widgets would also allow customization and flexibility for Rekom and its cross-national brand base. They can apply filters by campaigns’ names or ad sets and combine multiple metrics from different venues and countries using a custom formula builder.
Finally, to create a custom look and feel, Rekom leverages custom branding options, custom color schemes, and image/text widgets in its reports.
Sharing insights within the company
The final step is to share the executive-level or venue-level insights with relevant stakeholders, board members, and marketing team members.
There are two types of sharing leverage by Rekom:
- Report Automation.
- Live links with on-demand access to their data.
Report automation allows Rekom's marketing team to set an automated send-out schedule for any number of their reports. They pick recipients' emails and frequency, create an email template, and never worry about report delivery again.
And when it comes to "live links," each dashboard or report can be quickly shared via link, password-protected if necessary. Inside that link, a recipient has interactivity in terms of looking closer at specific data points or changing a date range, and the data will follow.
Rekom's current state of reporting
After implementing Whatagraph as a marketing reporting and analytics solution, Rekom has connected all the data from 200+ brands in one platform.
They can clearly see the results of their marketing tactics across all countries or an overview of the key metrics for the whole business. And drop down to a single venue with a few clicks when needed.
When the business grows, for instance, when new venues are opened, it takes a few minutes to connect their sources. And everything that has been done before, both small building blocks inside reports or whole pieces for other brands, can be saved and reused as a template.
Published on Jun 02 2023
WRITTEN BY
Nikola GemesNikola is a content marketer at Whatagraph with extensive writing experience in SaaS and tech niches. With a background in content management apps and composable architectures, it's his job to educate readers about the latest developments in the world of marketing data, data warehousing, headless architectures, and federated content platforms.
