How Swash Labs Reduced the Monthly Time Spent on Reports from 40 to 4 Hours
Data, data, data. If someone could take over all those labor-intensive, time-consuming data analytics tasks! Luckily, a marketing agency from Texas has found its ultimate solution to save time & easily track its performance. With Whatagraph, it managed to speed up cross-channel analytics and direct its resources toward acquiring new business.

Oct 06 2021 ● 5 min read

Table of Contents
- In brief:
- In-depth:
- Say no to manual analytics
- Freed-up resources
- Ease over frustration
- Raise a glass
Data analysis is a challenge. No one knows it better than marketers. In fact, they know it so well, here are the TOP 3 challenges marketers face when it comes to analyzing marketing performance:
- Inability to connect and analyze across applications and platforms;
- Data is a mess;
- Not enough resources.
Sound familiar? Perhaps you’re facing these same challenges right now? To defeat this challenge, you will need some good practices.
Take a look at Swash Labs - a full-service digital marketing agency from Texas. Working with Whatagraph, they’ve been able to tackle all three challenges by implementing a single platform.
In brief:
- A digital marketing agency from Denton, Texas, Swash Labs offers a full range of digital marketing services.
- Swash Labs would spend around 40 hours per month on just maintaining and updating existing reports with data incoming from multiple marketing channels.
- With Whatagraph, Swash Labs reduced their reporting maintenance time to just around 4 hours per month.
In-depth:
Say no to manual analytics
Few things are as mind-numbing as tedious manual work. Swash Labs were quite familiar with this frustration, as they had to pull and upload data to their own spreadsheets manually. The process continued in the Art department to give old reports a better look.
This process took 2-3 hours per report.
Several factors contributed to this state of analytics: data from multiple sources, incomplete tech stack, both of which led to messy data and a complex analytics process.
“We’re able to spend more time analyzing rather than cleaning data thanks to the connected sources.” - Stephanie Delk, Director of Media & Planning
Swash Labs now take less than 1 hour building each new report.
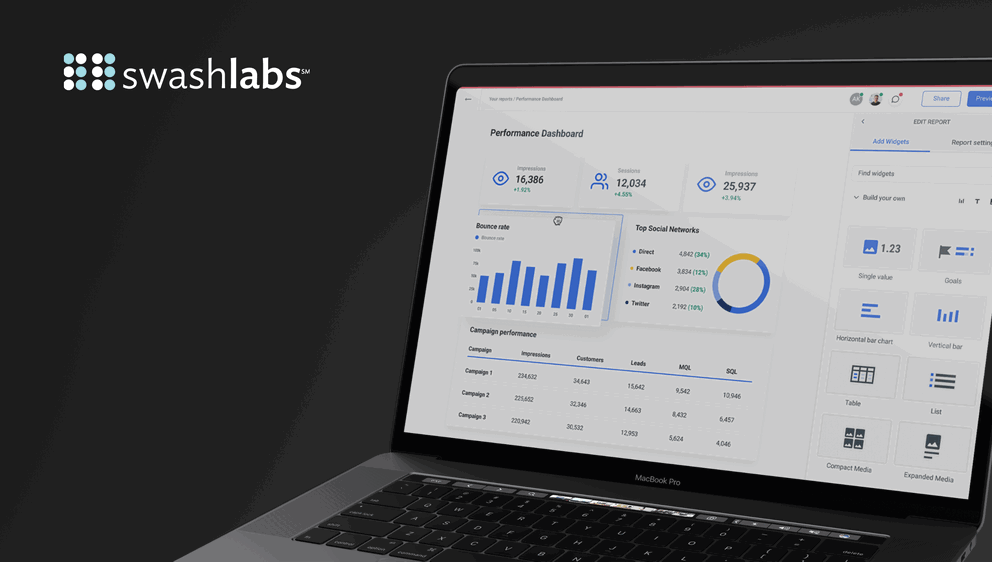
This monumental change was made possible by Whatagraph’s direct source connection, easily customizable report builder and the functionality of saving and reusing report templates. Swash Labs took over the best Whatagraph has to offer and improved their analytics processes.
Freed-up resources
So Whatagraph helped with overcoming the first two challenges: complex cross-channel analytics and messy data. But what about resources?
Swash Labs dedicated a lot to analytics. As a performance-based, data-driven shop, marketing analytics and insights gives them an edge in planning and implementing campaigns. With a streamlined analytics process, Swash Labs could direct their resources on different aspects of marketing.
With Whatagraph, Swash Labs lightened their onboarding process. Instead of endless spreadsheets coupled with Google Data Studio, Swash Labs use only one platform with all their channels connected directly.
With more time available to analyze data, Swash Labs took the opportunity to look into their own marketing campaigns.
“We’ve made decisions about our own advertising, blog topics and social content calendar based on things we see in our reporting for Swash Labs.” - Stephanie Delk, Director of Media & Planning
With internal struggles eased or solved entirely, Whatagraph’s positive impact was felt on the client-side too.
Ease over frustration
Swash Labs run Co-Lab sessions - monthly collaborative meetings with their clients. Preparing for these meetings, performance reports had to be top-notch. With Whatagraph’s visual-centric platform, Swash Labs can incorporate ad and social post imagery into their reports. This, coupled with key metrics, helped showcase what works and what doesn’t better than any previous report.
“Whatagraph helps us highlight our clients' work as well as the progress our team makes on their accounts.” - Stephanie Delk, Director of Media & Planning
No doubt their clients are happy to receive impressive and comprehensive reports made with ease rather than frustration.
Raise a glass
Swash Labs are successfully tackling the TOP 3 challenges of marketing analytics. Whatagraph gave way to more effective ways to utilize available resources and gain deeper insights into marketing data. Here’s to more challenges to come!
Published on Oct 06 2021

WRITTEN BY
Indrė Jankutė-CarmaciuIndrė is a copywriter at Whatagraph with extensive experience in search engine optimization and public relations. She holds a degree in International Relations, while her professional background includes different marketing and advertising niches. She manages to merge marketing strategy and public speaking while educating readers on how to automate their businesses.
