Data Modeling Techniques to Boost Your Business
Data modeling is the process that makes the handling of long data easier. The method of creating a descriptive diagram and represent the association between various data types within store data in a database is called data modeling.

Jan 13 2020●7 min read


What Is a Data Model
Data model refers to a framework that represents the relationships within a database. A data model is similar to a building plan. It builds a conceptual model and presents the relationship between data elements.
The data model is a first but crucial step in the process of data modeling. The model is then used to store the data in the database. Even though the data model is only a frame, however, that model is filled with data from your source system. Using the wrong framework will be hard to change later in the data modeling process.
Three Steps of Data Models
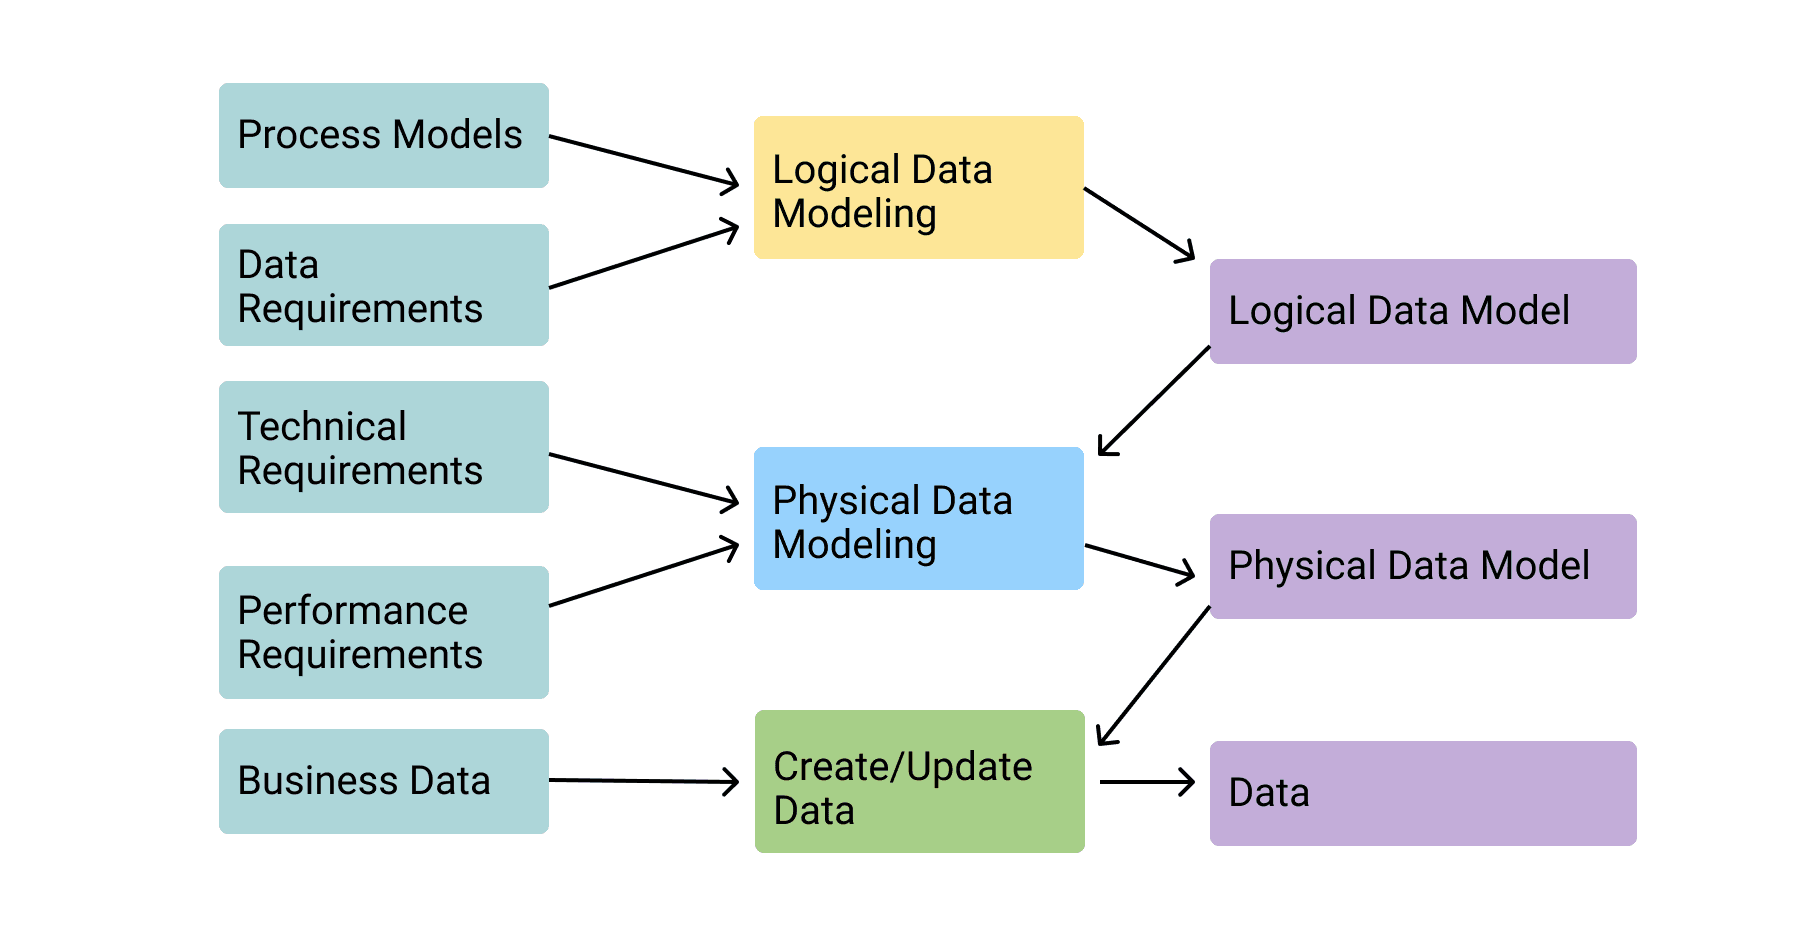
Data modeling represent the structures as well as the relationships between data elements. Following are three different steps of the data model.
 | 1. Conceptual Model |
In this step, data requirements are defined in the structure of the model, which present the business concepts to the business stakeholders.
 | 2. Logical Model |
The logical model documents the structure of the data and prepares it to implement in the database. It can include all types of data that need to be captured by a business analyst.
 | 3. Physical Model |
Then the physical model organizes the data with the help of the database management system. A database administrator defines it in tables, accounts access, performance, and CRUD system.
Five Types of the Data Model:
- Hierarchical Model:
The hierarchical model is the first DBMS model; it represents the data in a hierarchical tree structure. The data is sorted hierarchically, and the arrows are used to navigate through the stored data.
- Relational Model:
The relational model represents the data in tables, and it is based on first-order predicate logic.
- Network Database Model:
Network Database Model is similar to the Hierarchical Model. However, the Network database allows a record to have more than one parent while Hierarchical Model does not allow more than one parent.
Network Database does not require the parent to child relation, unlike the hierarchical model. It represents the data as a graph and the record type and allows one to many relationships.
- Entity-Relationship Model:
Entity-Relationship Model is useful in developing a conceptual design for the database. This model is easy to design with an ER model constructed.
- Object Model:
Object model uses the objects, classes, and inheritance to store the data. The object model is used for complex applications as well as in the file management system.
Data Modeling Techniques
Following are some techniques you can use to create a useful and result-driven data Model.
Know Your Business and What Is Required to Improve It
It would be best if you had a clear understanding of your business, what is its purpose, and how you can utilize data to grow your business. For data modeling to be useful, you must have a deep understanding of your organization. Only then you will be able to gather relevant data that match with your aim for your business. Therefore, get to know your business and what is required from it, and then you will gather the relevant data you can use to grow your business.
Data Visualizations
After you know what data you need to gather for your business to grow, it’s time to think about how to present it. A graphical visualization can make it easier to not only understand data but also gather data from multiple sources. You can represent the data more clearly when present in a visual context.

Staring Your Data Modeling Right
At the initial stage of your data modeling, you don’t know how fast or big your data will grow. Making it small and easy to understand at the beginning will ensure you see the growth rate and are prepared to handle everything.
Moreover, it will also make it easier to correct any problem you encounter in your model or data at the initial stage. As you get the knowledge -with time and experience- what works and what does not work, you can add more datasets. In any case, you should use a scalable data model to reflect the changing nature of business needs.
Make Your Data Easier to Understand
A useful data model is a combination of technology and business. While making a data model, you should keep in mind that most people who read your data know the business but not the technology.
Your model should take into account the way people think and how people measure business. Your data model should be based on three things: What your business requirements are, the data you have and the business intelligence.
Concentrate on the Data You Need
Use what you need, not what you want. Know your purpose and use only relevant data. Too much data can create clutter and cause many problems as well as make it hard to monitor the relevant data.
Keep a Regular Check on Your Data
Keep in mind the earlier you catch a problem, the easier it is to fix it. Therefore, keep a regular check on your data model so that you find any problem at its initial stage and addresses it as soon as possible.
Avoid Misleading
Sometimes data is used in a way that can mislead people to believe something that might not be true. Avoid misleading; trust is earned not given, providing correct information you can prove is essential. Try to avoid the practices that can mislead, such as some tricks usually used in data visualization. Moreover, try to show a cause and effect relationship instead of Correlation.
Make Use of the Technologies
Nowadays, there are many software and online tools available for data modeling. Make your life easier and use available tools for better and faster performance.
Keep learning and improving along with your business
As your business expands, keep learning alongside. Broaden your data modeling structure as your business growth or new data become available is the right next step.
Since the evolution of Machine Learning and Artificial intelligence, data technologies are a new rage nowadays. Therefore, no matter you are about to build a data model for your business or you want to learn data modeling; this is the right time to learn smart data technologies.
Published on Jan 13 2020
WRITTEN BY
Gintaras BaltusevičiusGintaras is an experienced marketing professional who is always eager to explore the most up-to-date issues in data marketing. Having worked as an SEO manager at several companies, he's a valuable addition to the Whatagraph writers' pool.