Everything you need to know about the Drilldown Report
Corporate decisions today are largely data-driven, and almost all of the decision-makers in a company rely on quality data analysis to do their job. As we know, we perform filtering, transformation, and analysis using vast amounts of raw data. Based on the analysis we formulate new theories and test them, in order to find new approaches that work better.

Apr 26 2021●7 min read


Analysis is just a final report that details current results. We rarely see the whole process of how those numbers were obtained or examine the foundations or premises that those numbers are based on.
Unfortunately, basing your decisions on analyzed data can lead to undesired outcomes as well. This is because the process of analysis itself can be flawed. Very often we can mistake correlation for causality and form conclusions based on that. This why it is important to trace back the results and examine them thoroughly. This can be achieved through a drill-down report or through drill-down analysis. To give you a better understanding of the term drill-down analysis and drill-down reports we will delve a bit deeper into this topic.
What is Drill Down Report
A drill-down report helps users navigate from a high-level view of data to a more detailed view. By clicking on a specific visualization element, you can explore a hierarchical relationship between data and access a more granular level of the information.
Drill Down Reports vs Drill Through Reports
A term that is often used interchangeably with the drill-down report is the drill-through report. This is because they are really similar. In fact, the only difference is that drill-down reports allow you to remain in the same application or use the same visualization when examining different layers of data. Drill-through reports can lead you into a different platform, website, and entirely different visualization, sort of like clicking on a link to find a source of information that has been used in a specific article. Basically, the only difference is that these two do not stay within the same interface, but the principle of work is mostly the same.
Benefits of Drill Down Analysis and Reports?
Given the importance of data analysis, it's pretty clear why these reports can be extremely beneficial for the user. Having tools that can do drill-down reports saves costs and time on performing new analyses.
The beauty of the drill-down function is that you can get visualization for each of the data points. This means you can view nationwide states or data, and for example examine sales number by country, see where the majority of end-users come from, and so on.
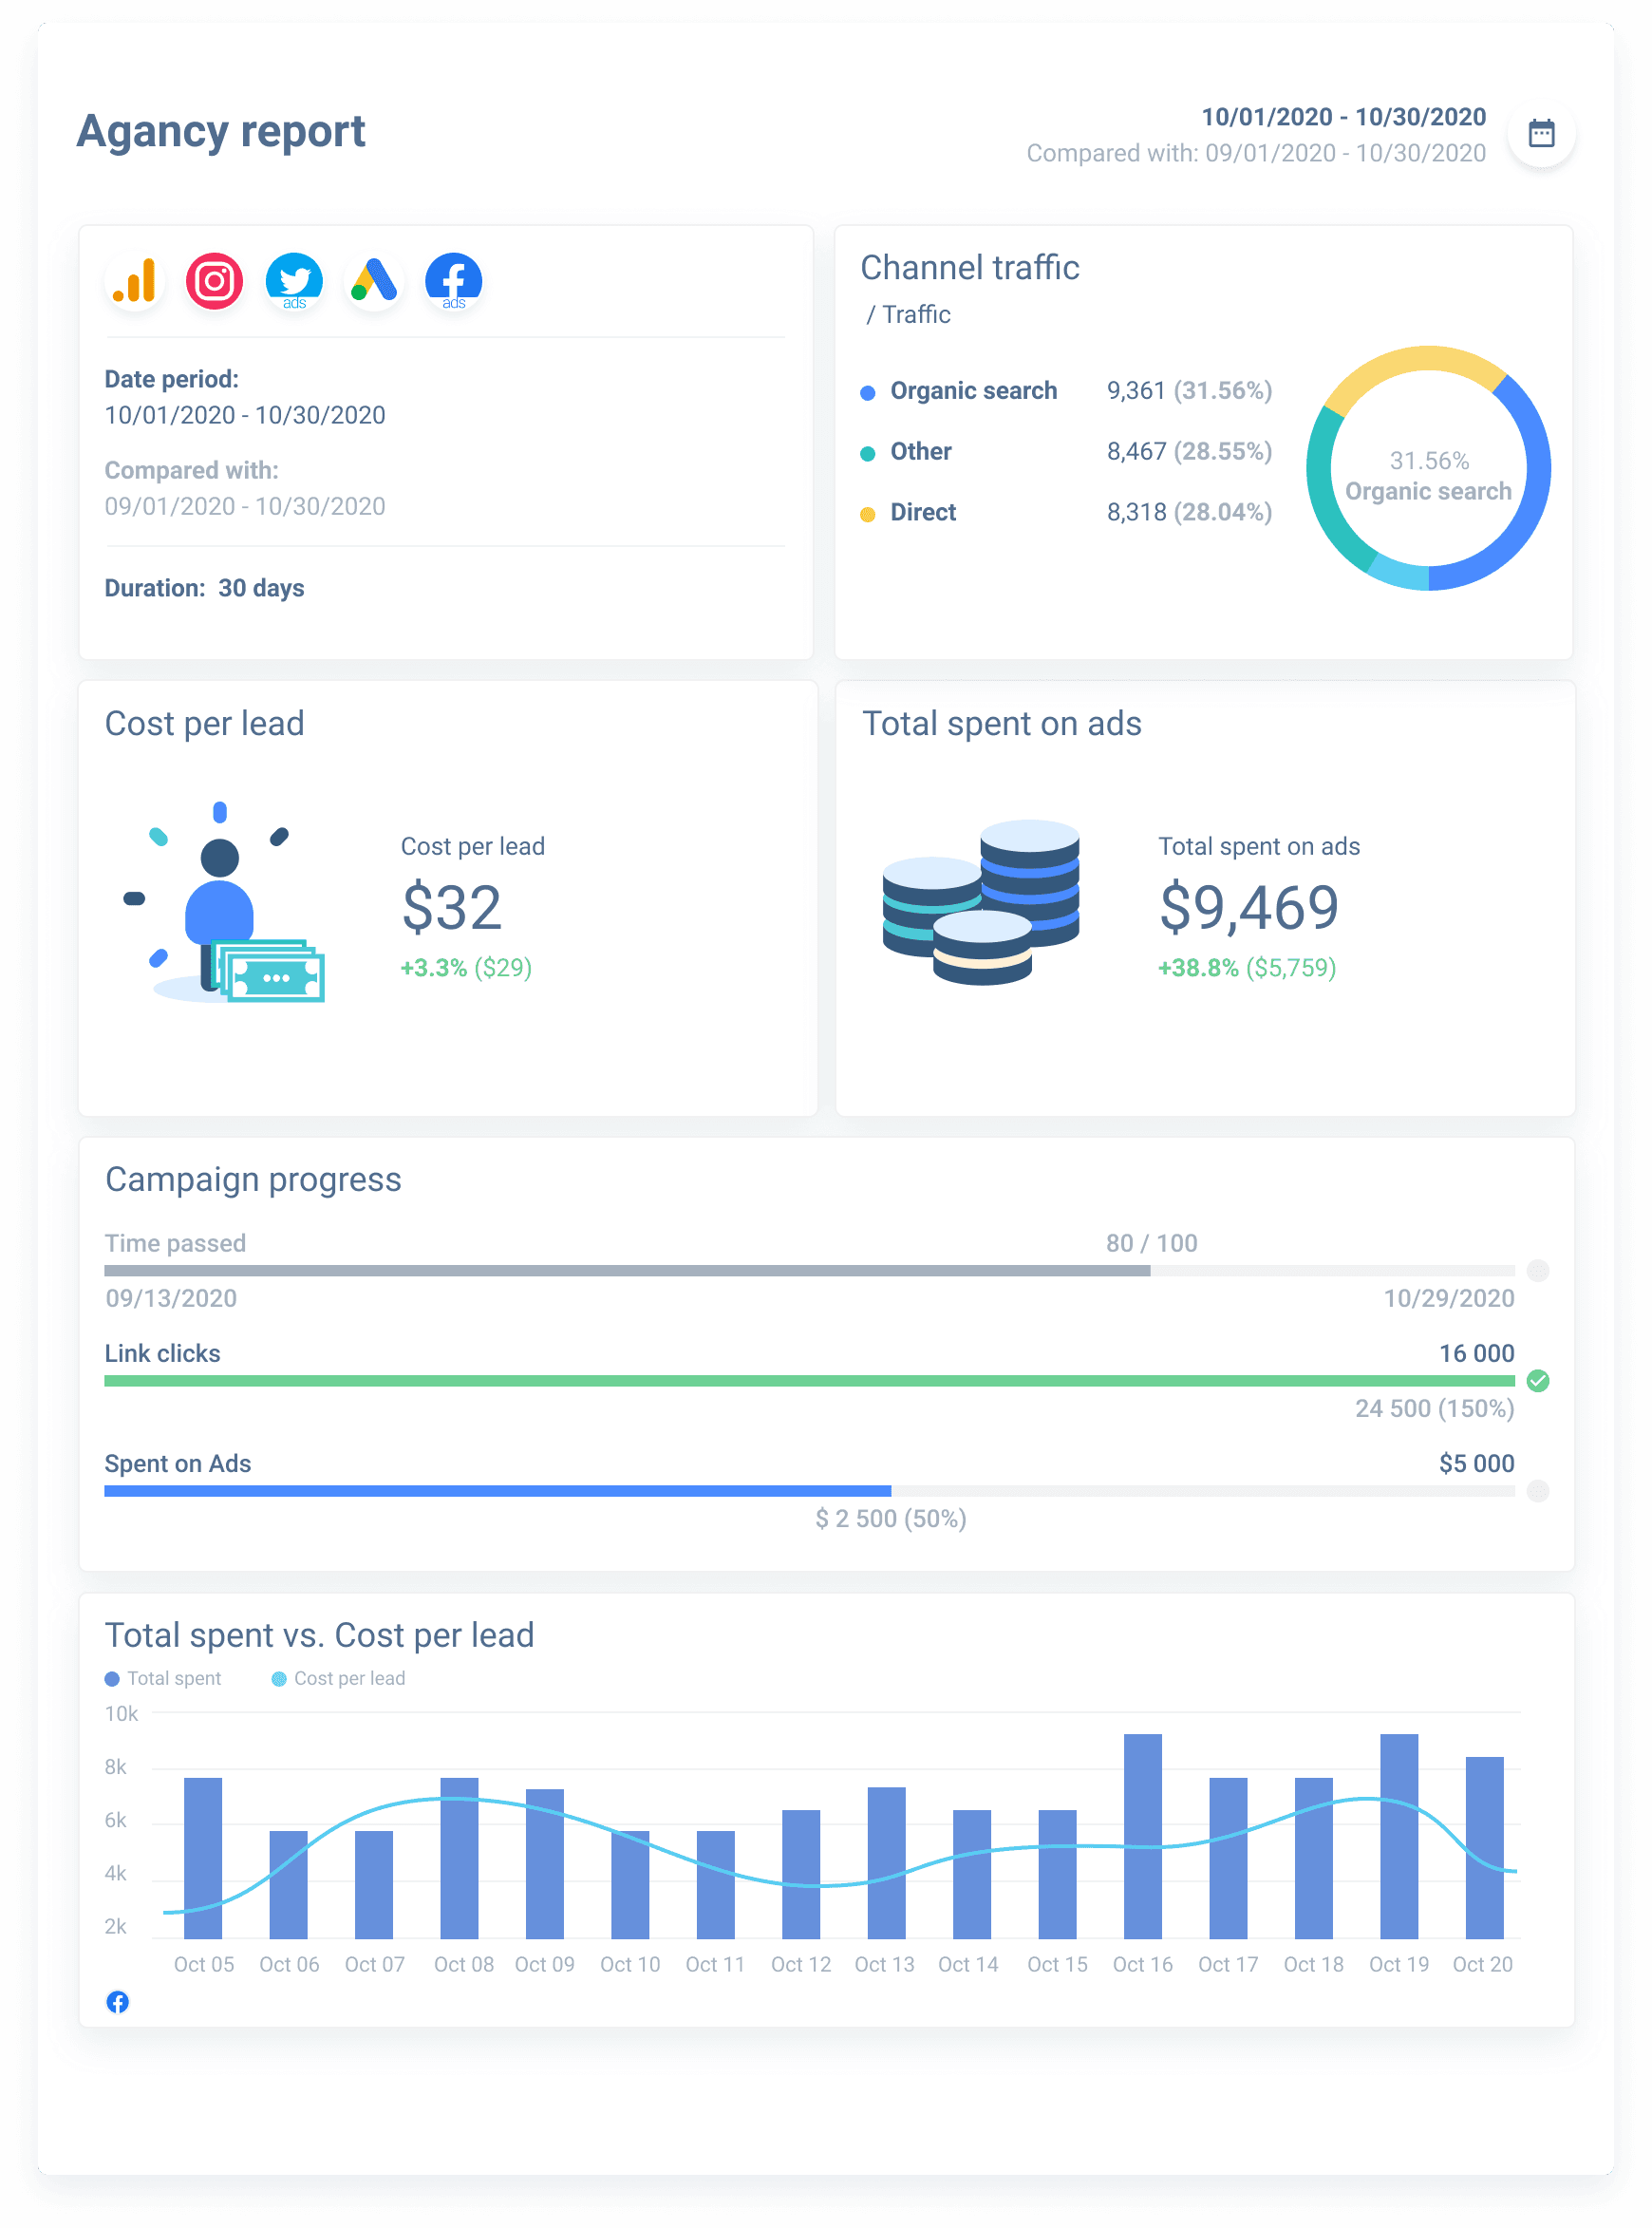
One tool that offers quality drill-down analysis capabilities is Whatagraph. This tool allows you to gather data from different sources and compile it in a neatly visualized report that you can white-label and print out. You can also examine each component of the report individually, and drill down all of the relevant metrics and data insights. This way you can guarantee the success of your marketing and sales campaign. You also save costs on storage as maintaining all of the raw data at one place where it can be examined and evaluated over and again can be expensive.
Finally, the best thing about these tools for drill-down analysis is that you do not need to have an expert data scientist to examine the numbers. They are user-friendly, anyone can navigate the interface and apply logic to the numbers. These are also referred to as self-service or ad hoc analytics, given how non-technical users can edit and export the reports.
How to Use Drill Down Reports
The main idea here is to have data that can be easily understood by the end-user, this way you ensure that the information analyzed is more accurate. So, to use these apps in it important to define comprehendible data layers. These are some parameters that can vary depending on the tool you are using, and you might have to get specific tools depending on the data you wish to analyze. But in general, the information will have a hierarchy or levels in order to comply with principles of drill-down reporting.
In other words, you will have data that is on the level of the continent, country, county, and city for example. These hierarchical relationships are important as they give you a better understanding of generalized visualization. It tells you where you can double down on your efforts, where things are going the right way, and where they are not, and where a shift in strategy is necessary. Having this segmented overview, allows you to gain data insights on a more specific level, and examine other factors that you previously did not consider.
For example, let's say you are running a website for sports betting, and even though you are using the same marketing strategies across the board, you are able to generate more users in some regions compared to the others. Assuming that gambling is regulated in a similar manner and that your ads are displayed with the same frequency in all of those regions, indicates that there are other factors in play that affect the result. These can be how much are sports events popular in a specific region, is a community more religious in particular geographies, or when sports betting was deemed legal, etc.
The main idea is to isolate the pain points of the business model and come up with a theory on what's causing the lack of engagement from your target audience. Then you will have to test those theories and if it turns out you are right, then you might get the answers on how to improve on the whole situation, or maybe if you should save costs on trying to sell your product in specific areas.
Without using drill-down reports you might rely only on data that requires more context in order to be relevant. This causes you to just chase metrics and won't provide any insight into why the same techniques are working for some business and not for you. There is no one-size-fits-all approach, and report data allows you to modify your approach accordingly.
Recognizing Quality Self-Service Analytics Tools
As mentioned before self-service analytics allows your non-technical users to perform data analysis with ease. So, based on your business model you will want to look for certain features or capabilities in a tool that aligns with that model.
You should always go over a demo for a specific tool just to see if the user interface is designed in a way that is easy to navigate, which ensures your workforce will intuitively figure out how to use it. Then you need to see how the information is displayed and also see the drill-down capability at work. This will also give you a good idea of how the system works, what inputs it collects, and what you can change if needed.
You should also go over the API integration options and figure out if the software you are already using can be interfaced with the tool, and if it has all the other relevant integration options. In some cases, you might be able to quickly import the data and then allow that tool to organize the fields differently so that the view is more digestible sort of speaking. It is always useful if the system can provide visualization in form of charts, bars, or graphs.
Conclusion
To sum up, having an accurate data analysis is simply not enough to make the relevant decision. Although data insights are useful, it is more useful to examine their foundation, otherwise, you will just be running in circles wondering what you are doing wrong. The more you rely on drill-down capability the better chances you have to maximize the value of your sales report, user engagement metrics, or similar data. Report view that truly transports gives you information on multiple levels, not just the end result.
Furthermore, by ignoring the drill-down feature, you are potentially making unnecessary expenses, missing out on better opportunities, and simply relying on inadequate BI (business intelligence). You are also potentially storing irrelevant excess data and focusing on irrelevant data values. This is why dealing with specific information on a micro-level is more likely to yield positive results, more often than not it's about the data you are ignoring that gives better insights, rather than data you are choosing to focus on. 
Published on Apr 26 2021
WRITTEN BY
Indrė Jankutė-CarmaciuIndrė is a copywriter at Whatagraph with extensive experience in search engine optimization and public relations. She holds a degree in International Relations, while her professional background includes different marketing and advertising niches. She manages to merge marketing strategy and public speaking while educating readers on how to automate their businesses.