11 Essential Email Marketing KPIs To Measure Your Campaigns’ Success
Is your email marketing campaign working? Are you on track to meet your email marketing objectives? Are you providing your client's audience with the content they want? Find a list of the most important metrics to help you answer these questions and adjust your strategy based on your client's most recent expectations.

Jul 20 2022●8 min read


Email marketing is one of the most traditional and effective marketing strategies. Almost every business invests in it, and almost every marketing agency recommends that email marketing campaigns be launched. One of the primary reasons is the 4 billion daily email users. However, having the email addresses is just the start.
According to HubSpot, 37% of brands intend to increase their email budget in 2022 because smartphone users prefer to receive brand communication via email. And email marketing revenue is expected to reach 11 billion by the end of 2023.
With this in mind, it’s useful to know the most important KPIs for email marketing so you can learn whether your campaign is a success or not.
Top Email KPIs for Efficient Strategy Execution
The right email marketing KPIs for a specific client and campaign will depend on the goals you want to achieve. Certain KPIs, however, help improve overall email campaign performance and provide valuable data for future campaigns, so all marketers should have them in mind at all times.
Some email metrics are critical for understanding your client's audience persona, while others provide insight into how they engage with the email and, most importantly, which email strategies are working.
Here are 11 email key performance indicators to help you get the information you need.
1. Open Rate
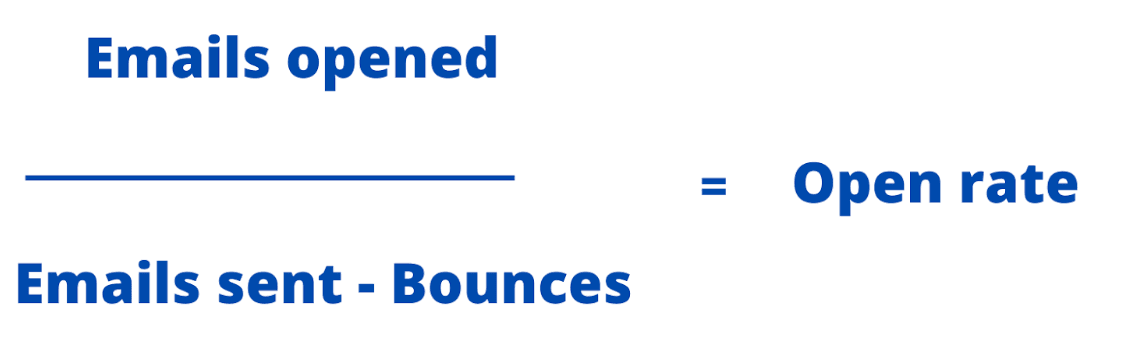
In simple terms, the open rate is the percentage measuring the email recipients who open an email. If you sent 100 emails and 50 of them are opened, your open rate is 50%. For any number of emails, this would be unusually high, though.
The average open rate in the marketing industry market is 22.8%. The higher the percentage, the more engaged and interested the audience is in your client’s business and the content you provide for them.
It is important to track the open rate because:
- It gives insights into the effectiveness of your subject lines. The more compelling, clear, and free of spammy words it is, the higher chance you have to get a nice open rate;
- It provides valuable data on your current email campaign performance. Use open rate as a comparative metric. Compare the open rates of the most recent email to those of the previous week or month. Analyze and identify the differences in the copy, headline, and subject lines and try to figure out why the open rates differ;
- It will inform you which topics appeal to your client's target audience. You wrote about your client's product/service use cases one week and then sent out a product update newsletter the next, only to discover that the newsletter's open rate was significantly higher. This indicates that the audience is very interested in your client's business and wants to stay updated on the latest developments.
Tanya Dharmapala, a Digital Marketing Account Manager at Dilate Digital, says that:
'A low open rate could mean you need to review your audience and do a bit of clean up, as well as think about the content you’re sending. It could also mean you’re not reaching those people at the right times. For all these items, some a/b testing will go a long way in finding the perfect balance'.
To find out what’s the open rate, calculate it manually:
Or try out the email marketing dashboard to present the current status of email campaigns and get a live overview of one of the most important email marketing metrics out there.
2. Bounce Rate
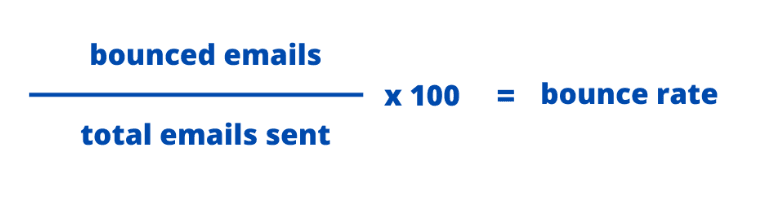
Bounce rate tells you whether or not your email was delivered to your client’s audience.
The bounce rate is classified into two types based on the reasons why the email was not delivered. These could be the reasons:
- A soft bounce occurs due to temporary issues: the recipient’s inbox is full; the server is down; the email is too big.
- A hard bounce occurs due to permanent errors: invalid email address; non-existent email; closed email; server is blocking delivery.
The reason you want to track bounce rates is to ensure that you do not get hard bounce rates. If you do, you may land on the spammers' list for your ISP (internet service provider) for your bounced emails.
The average bounce rate across all industries is 0.55%. It is recommended that it be kept below 2% for your total number of emails. If you have a higher score, it may indicate some technical errors. The best way to keep your bounce rate low is to have a valid email address.
Find out your bounce rate by calculating it manually:
Or get an email monitoring software to assist you at any time. You can also use an email verification tool to avoid sending emails to wrong or non-existing inboxes.
3. Click-Through Rate (CTR)
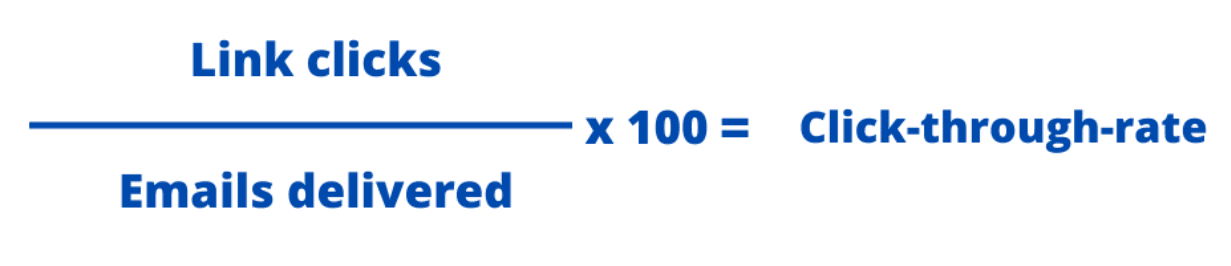
CTR is an email marketing KPI to measure the percentage of email recipients who clicked on a link found in a sent email.
According to MailChimp, the average CTR is 2.91%, and if your email CTR reaches the industry benchmark or is higher, it indicates high-quality copy and user engagement.
By tracking this KPI you are making sure that:
- You provide high-level content to your client’s audience;
- Your CTAs are compelling;
- Your email design is appealing and clear;
- You get a great return on investment from your emails as readers click through to your website and potentially make a purchase.
Aaron, a co-founder of Agency 101, shared the reasons why their team tracks CTR:
'By observing the click-through performance of each email you send out, you can more easily determine which techniques work and which should be discarded. This is a helpful marker of progress while A/B testing, helping you finetune your email copy until it's optimal for a given campaign'.
Calculate this KPI manually:
Alternatively, use our email report template to obtain real-time and historical data on your CTR.
4. Click to Open Rate (CTOR)
Click-to-open rate is an email KPI that calculates the number of people who opened your email compared to the number of click-throughs.
In other words, it’s the percentage of your client’s email subscribers who click on a link found in an email after opening it.
CTOR provides insights into your copy, design and CTAs attractiveness. The average CTOR across all industries is 10.5%. If yours is lower, do some A/B testing. Try altering and strengthening your messaging, content, and offers.
To find out what’s your CTR, calculate it either manually:

Or with an email monitoring software.
5. Unsubscribe Rate
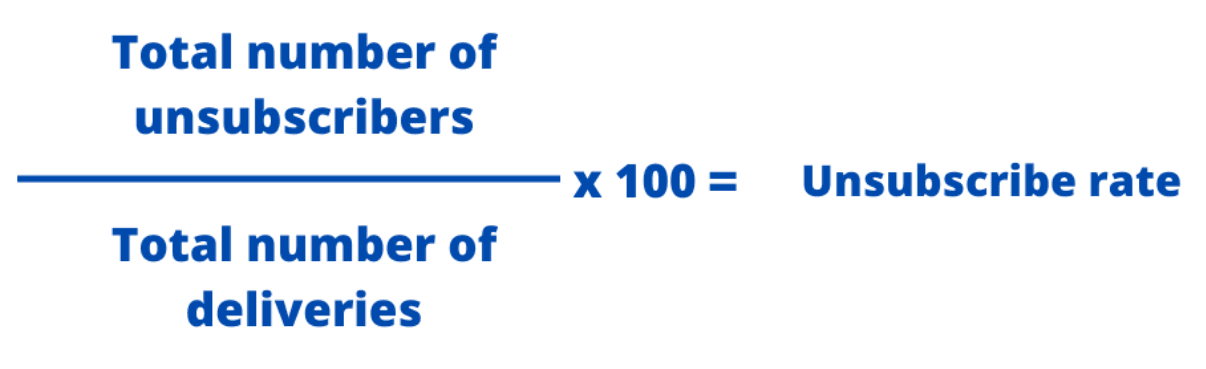
The unsubscribe rate determines the percentage of email recipients who unsubscribed from your send list immediately after opening an email.
The average unsubscribe rate ranges between 0.2% and 0.5%. A high number of unsubscribes alerts you to the critical changes you must implement in your email marketing strategy. For example:
- Changing the email frequency;
- Altering the messaging;
- Changing the channel;
- Adjusting the targeting;
- Changing your opt-in process.
Calculate your unsubscribe rate manually:
Or with email monitoring software.
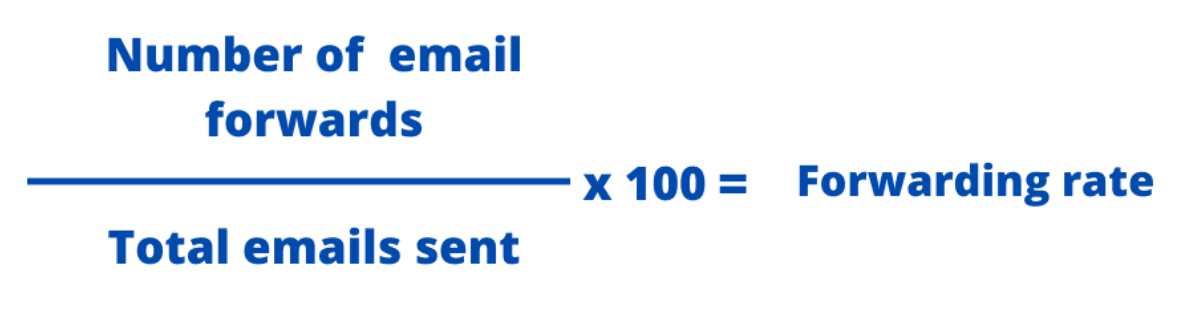
6. Forward Rate
The forward rate is a KPI to tell you whether or not your client’s subscribers are sharing your emails with other people.
This KPI indicates how entertaining, helpful, or relevant your email content is to your client's audience. It also shows potential subscriber list growth and whether your email marketing efforts are paying off.
The forward rate also provides you insights into the quality of your content. If it’s high and you get direct referrals, you’ll have an opportunity to generate new leads and clicks.
Advice: Calculate your forwarding rates and identify the most popular content or topics. Use this data to plan your future email campaigns and deliver what your client's audience prefers.
To measure your forwarding rates, use this formula:
Unless you want it calculated automatically and see the patterns of the forwarding rates, use our email report template.
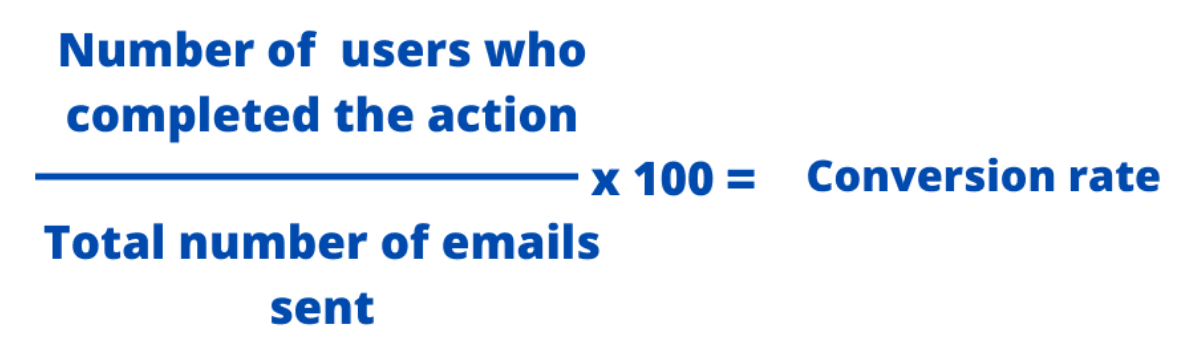
7. Conversion Rate
In simplest terms, conversion rate indicates whether or not a user completed the desired action.
- A customer purchased an item from your eCommerce store;
- A user arrives at your pricing page and fills out a form to schedule a demo;
- A product newsletter was opened by an email subscriber;
- A visitor begins a free trial of your product; a free trial user becomes a paying customer.
It is typically measured in percentages, with the higher the percentage indicating a successful campaign.
This KPI is all about outcomes. If your conversion rates fall short, and the average email conversion rate is 2.3%, then you may need to consider things that are directly tied to this KPI:
- Relevance. Your link should answer the question your client’s target wants to know;
- Value proposition;
- Email personalization;
- Your call to action.
To find out your conversion rate, here is a formula to calculate:
You also have the option to pull this data and even display conversion rate trends automatically.
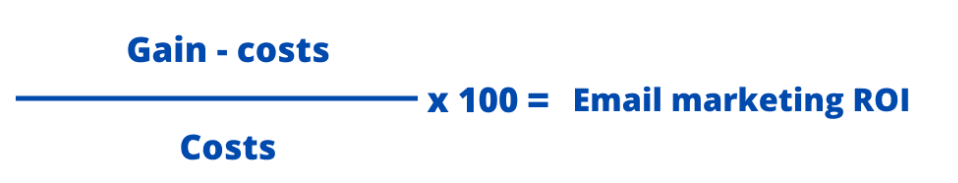
8. Overall ROI
The overall return on investment is a KPI that presents the overall return on investment that you generate from your email campaigns.
This sales-driven email KPI gives insight into how cost-effective your campaigns are.
You can leverage overall ROI and compare it to other marketing campaigns and channels by having a reporting tool or developing cross-channel reporting.
You then could easily compare and learn which channels generate the highest ROI for your clients and which campaigns are most effective.
A typical and ideal ROI from email marketing is when you spend $1 and get $36 in return. However, not many email marketers are able to achieve these kinds of results.
To improve your ROI, here is what you should consider:
- Segment your list by personas; website behaviour; cart and from abandoners; trial users; current customers. Don’t overwhelm all the subscribers with irrelevant content. Tailor it accordingly and meet the needs of each group.
- Make sure your email is optimized for mobile;
- Re-evaluate the frequency on which you are sending emails. Avoid being too spammy;
- Launch lead generation campaigns.
Calculate your overall ROI with this formula:
You also have the option to pull this data and even display overall ROI trends automatically.
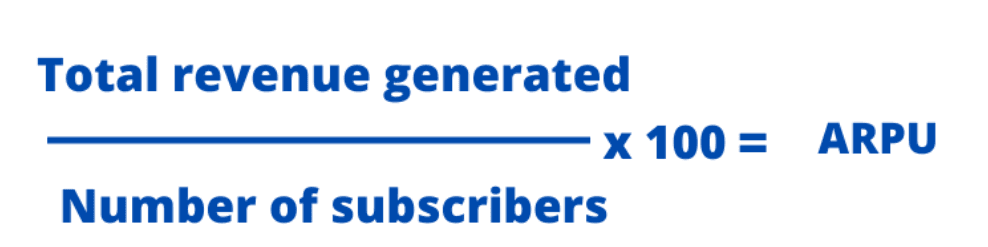
9. Revenue per Subscriber
Revenue per Subscriber is a key performance indicator that tells you how each email performed and how much revenue it generated.
In other words, it tells you exactly how much you were able to earn for every email address.
Good ARPU is around $1.96. If the goal is to increase it, here is what you could do:
- Optimize your pricing structure. Get a reporting tool, find out the average price per order, and maximize the company’s margin. Identify the most effective price point based on your client’s audience purchase habits.
- Upsell and cross-sell;
- Reduce customer churn;
- Personalize customer service.
The formula to calculate your current ARPU is:
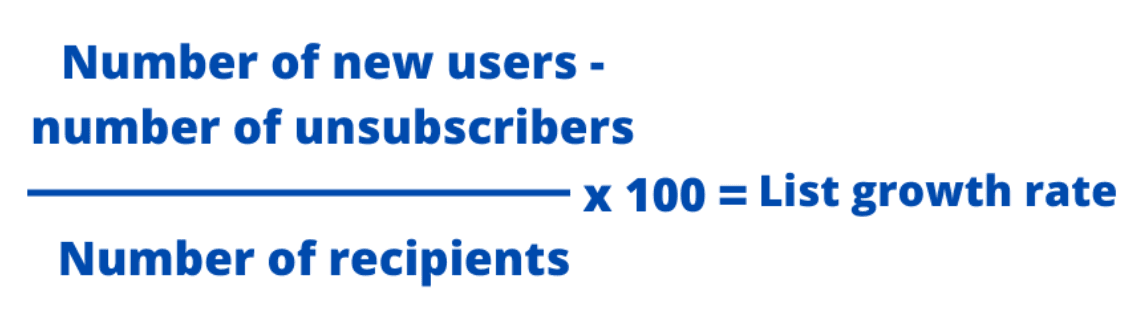
10. List Growth Rate
The list growth rate is the rate at which your email list grows.
Every digital marketing agency should track this KPI as the overall goal is to gain more subscribers. How will you know if your list is growing or shrinking if you aren’t tracking it?
Connect MailChimp to Whatagraph and pull data to the premade dashboard template to see where your list growth rate is at. The average rate that you should aim for is 2.5%.
To grow the list, consider trying out these things:
- Promoting your email list on social media and website. Share easily to sign-up forms with a compelling CTA;
- Offer something of value in exchange for their email address. Usually, it's a discount or free guidebook.
- Try out different types of content. Keep them interested and engaged.
If you want to calculate your list growth manually, here is a formula to do that:
11. Spam Complaint Rate
The spam complaint rate is probably the scariest KPI for every marketing agency.
It measures the users/subscribers who report your email as spam. If the spam complaint rate is high, and the ideal is around 0.2%, that means:
- Your content is no longer relevant;
- You may be sending too frequent emails;
- Your email subject lines look spammy;
- You are being too sales-y.
If your spam complaint rate is higher, note that your account can get blocked by your email service provider because too many emails end up in the spam folder. Besides getting great results from emails, you also want to monitor your sender's reputation.
To measure your spam complaint rate, use this formula:
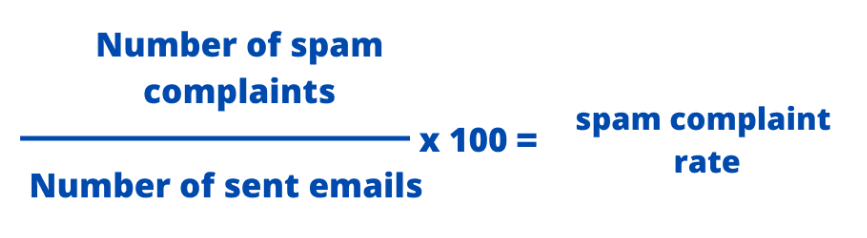
You also have the option to automatically pull this data and even display spam complaint rate patterns.
Wrapping Up
These are all the email marketing KPIs you should be tracking. As coming up and launching email campaigns is already a hassle that takes up a lot of time, we want to encourage you to get a reporting tool.
Whatagraph integrates with the most popular email marketing platforms such as MailChimp, ActiveCampaign, Google Analytics, HubSpot, Salesforce, Klaviyo, and Campaign Monitor. Let us pull all the data accurately and automatically so you can analyze your client’s audience behaviour patterns. Easily analyze open rate or CTR and optimize your efforts.
Start your 7-day free trial and benefit from features like report automation, white-labelling, and eye-pleasing clear reports.
Published on Jul 20 2022
WRITTEN BY
Dominyka VaičiūnaitėDominyka is a copywriter at Whatagraph with a background in product marketing and customer success. Her degree in Mass Communications/Media Studies helps her to use simple words to explain complex ideas. In addition to adding value to our landing pages, you can find her name behind numerous product releases, in-app notifications, and guides in our help center.