ETL Data Modeling: What It Is and How It Works
In the age of big data, businesses can get the upper hand if they learn more about their customers. However, to identify new market opportunities, you need accurate data analysis. And comprehensive data analysis is impossible without understanding the relationship between different bits of data across the system. ETL modeling helps you aggregate data across multiple tools and platforms.

Feb 22 2023●6 min read


What is ETL data modeling?
ETL data modeling is a process that generates theoretical representations of various data objects, figures, and rules on how to store them in a data warehouse. It is a critical part of the ETL process and, at the same time, has no purpose without ETL.
Data modeling analyzes data objects and their mutual relations, while ETL applies those rules and inspects them for anomalies, and loads them into a data warehouse or data mart.
If you want to model data correctly, you need to store it in a data warehouse.
Whatagraph offers seamless and automated data transfers from your marketing apps to Google BigQuery.
Whether you’re upgrading your website, changing the content platform, or need to run extensive analysis, your data will be much safer in a data warehouse.
Book a demo call with our product specialist to find out how Whatagraph can help you keep your data intact and error-free by moving it to BigQuery.
Combining the two processes defines the rules for data transformations and prepares data for big data analytics.
Let’s say that you are using a data warehouse to query data and gather real-time insights for workflows. To achieve this, your data should be accessible and reliable.
How does ETL data modeling work?
ETL data modeling starts by creating data models by which source data associations and constraints are described, categorized and coded for storing in a data warehouse.
Data modeling solves the reliability issue of the ETL process through visual representation and information. It takes care of entity integrity and referential integrity with the help of keys.
- Entity integrity — The reliability of data within an entity.
- Referential integrity — Data reliability between entities.
For example, to maintain data integrity, each vendor and each product have a unique ID within their respectable table. This helps avoid data duplication.
Data modeling achieves this with the help of primary keys.
To make sure the data is reliable between vendors and products, data modeling uses foreign keys, which are the primary keys of a table that exists in another table. In this sense, a unique key for a vendor can identify the different products they make.
It’s important here to note the difference between data transformations as part of the ETL and data modeling.
- Data modeling = rules for relationship between tables
- ETL transformations = rules and inspections to ensure data is ready for analysis before being loaded into the data warehouse.
Before we dive deeper into the benefits of ETL modeling, let’s just get everyone on the same page and explain the ETL process.
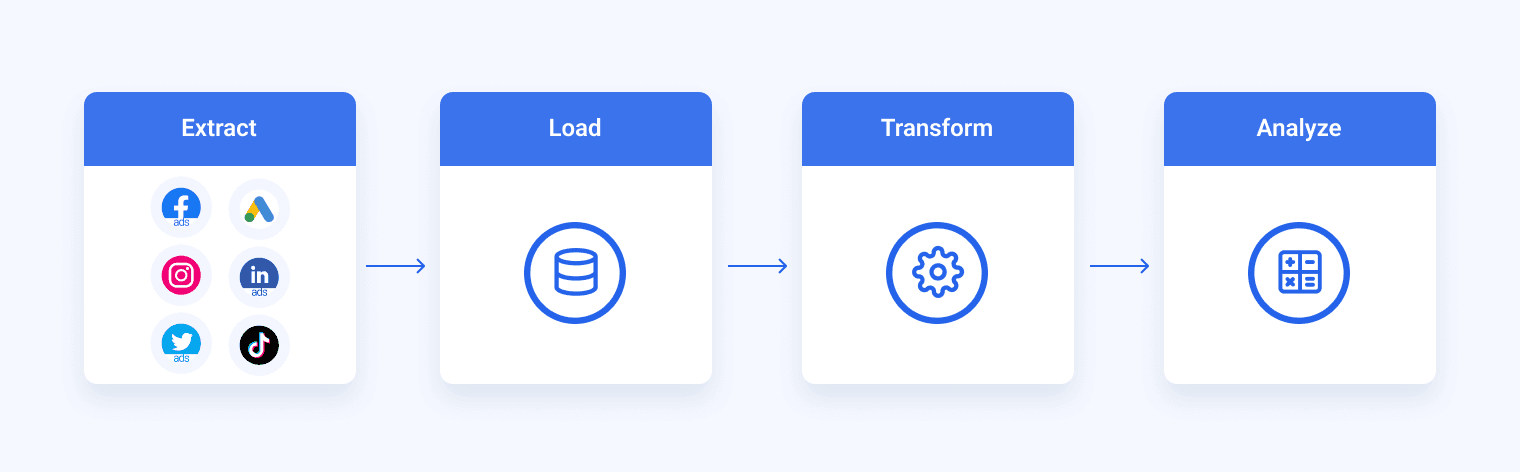
The ETL process explained
The ETL (extract, transform, load) is a process that prepares data coming from disparate sources and platforms for storing in a data warehouse like Google BigQuery, Snowflake, or Amazon Redshift.
There is also the ELT process, in which loading comes before transformation, which is suitable for storing in data lakes. This process is often used by data teams who prefer to perform data profiling before running queries.
Extract
Before the data is moved to a new destination, it must be extracted from various data analysis tools. In this first step, both structured and unstructured data are consolidated into a single data repository. The source systems can be:
- Existing databases and legacy software
- Cloud, on-premise and hybrid environments
- CRMs
- Sales and marketing apps
- Relational databases
The first stage was traditionally performed manually by data architects, as data migrations took a lot of time to complete and were prone to errors. Nowadays, ETL tools automate the entire process, enabling more reliable data management.
Transform
The second stage of the ETL process subjects data to rules and regulations that ensure data quality and accessibility. The data transformation workflow consists of several sub-processes like auditing, data integration, and other data processing steps needed to prepare different data types in a format suitable for data warehousing.
Load
The final step in the ETL process is to load the freshly transformed data into a new destination, most likely cloud-based data storage.
If you use a data pipeline, your loading process can get much smoother.
A data pipeline allows you to transform incoming data and, at the same time, extract new data on the other end. While the transformed data is loaded into the data warehouse, the newly extracted data transforms.
Whatagraph is an automated data pipeline that can help you automate loading data from multiple sources to BigQuery.
Cut out much of the manual work, and instead of hours, complete your data transfer in just minutes:
- Connect the destination
- Choose the integration
- Set the schema
- Schedule the transfer
No SQL or Python knowledge required.
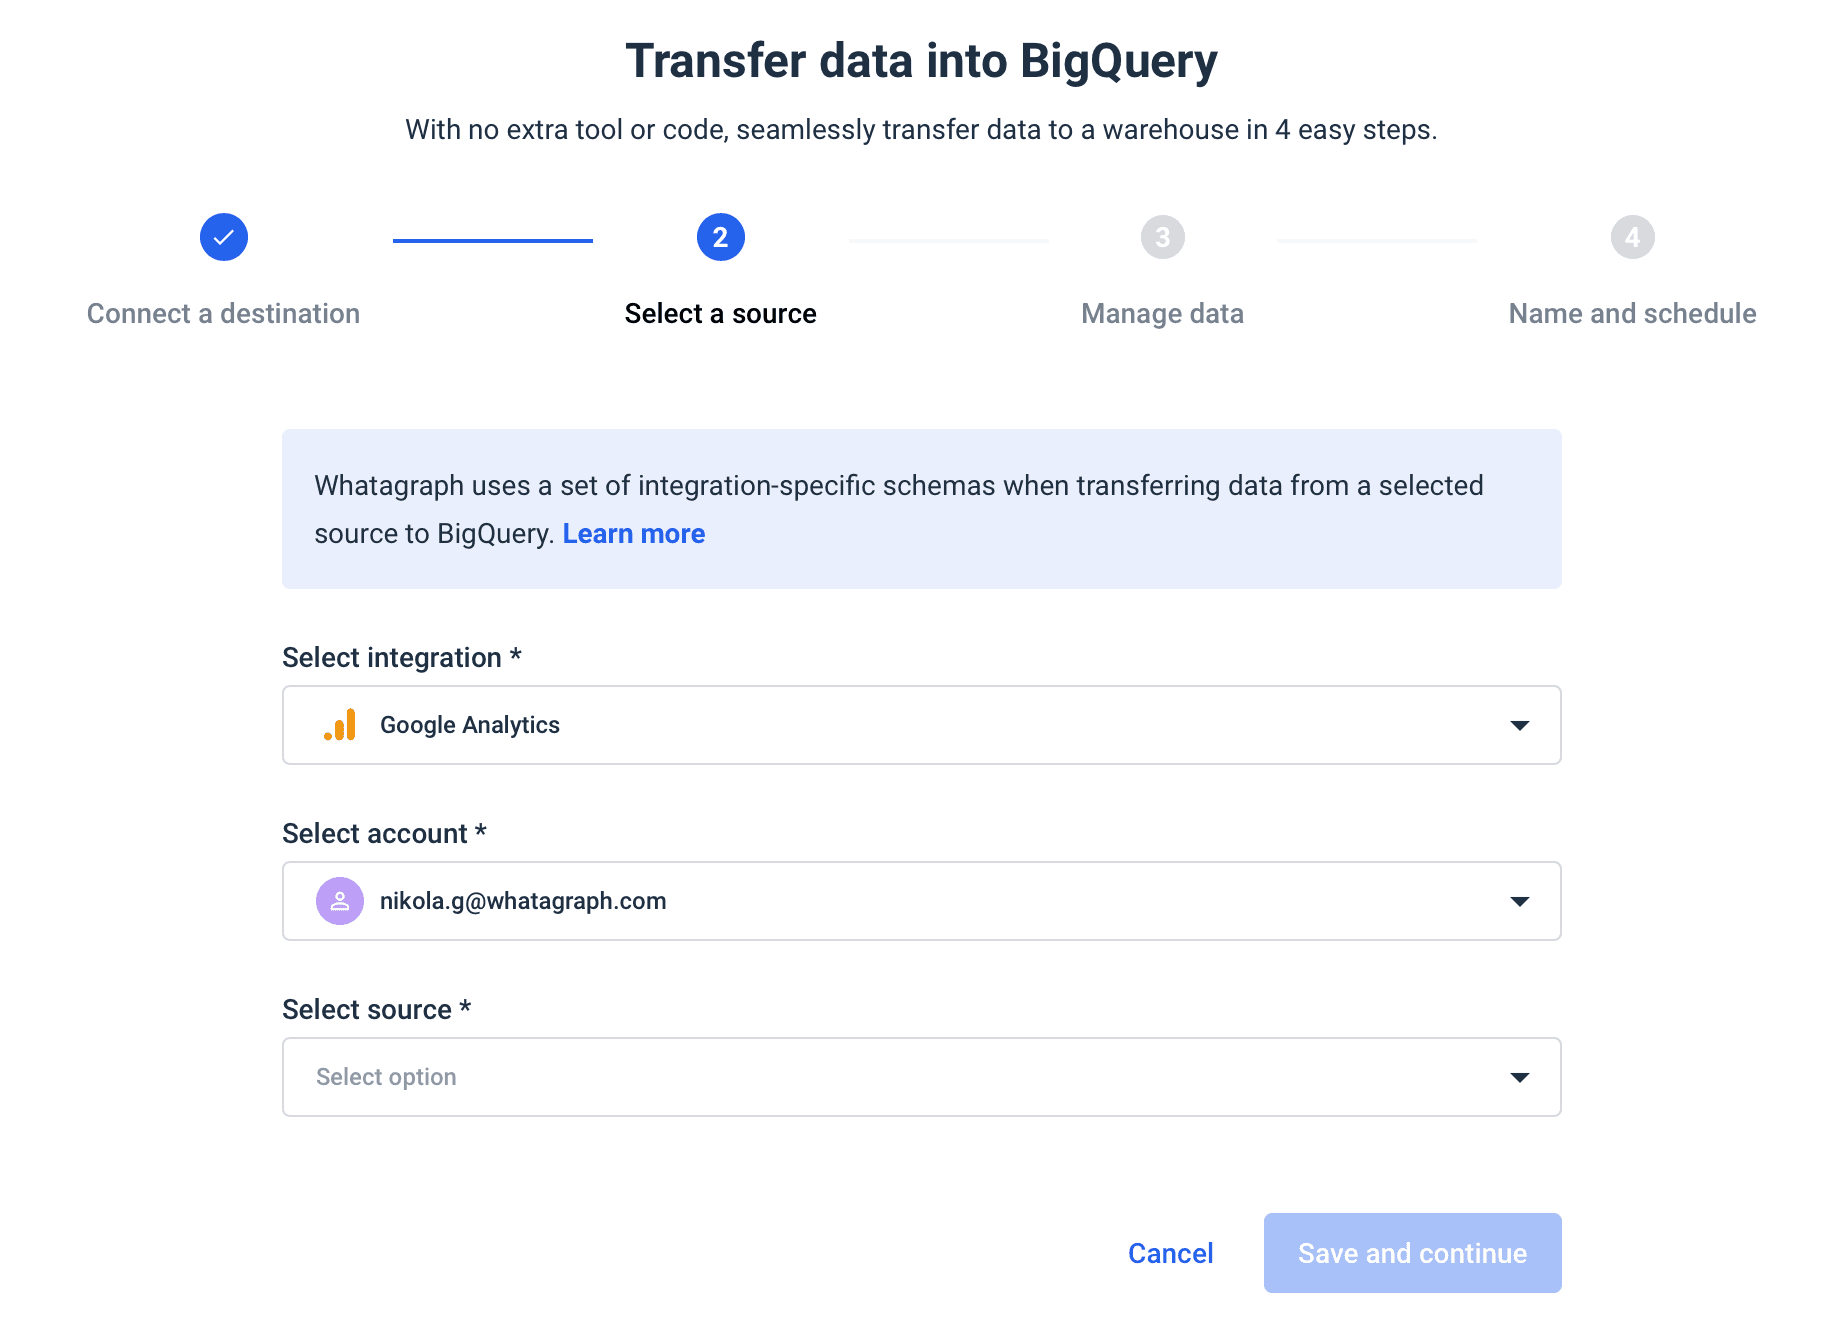
You can also set the schedule — when and how often you want your data moved to BigQuery.
And when you need to create a report, Whatagraph has you covered, too. Use our visualization to create custom drag-and-drop dashboards using your BigQuery data.
Choose different types of graphs and tables, add and combine sources, metrics, and dimensions, and much more.
3 tips for ETL data modeling
ETL data modeling should deal with three aspects of data analysis:
- Querying data with simple joins
- The uniqueness of data at all times
- Granular querying of data
Let’s go over three ways you can use ETL modeling to address these concerns.
1. Pre-aggregate data
Materialization is the process of pre-aggregating data to accelerate the query response times. Pre-aggregation is the opposite of a star schema that includes several tables. Pre-aggregation reduces the number of tables needed for metadata and expands their width by adding more columns.
This way, end users find it easier to run queries, which solves the problem of simple joins.
However, there’s always a compromise between materialization and leaving some data unaggregated. As a rule, any join that requires a lengthy response time is a prime candidate for materialization (pre-aggregating).
2. Use dimensional data modeling
The most significant benefit of using a data warehouse is to achieve business intelligence. Your business analysts query the sales figures yearly to get essential information about how your business is doing.
But when you query sales figures against different demographics or events, you can get deeper insights into new business opportunities.
But to achieve this, you need to aggregate data. The problem is that transactional systems like CRMs are not the best at aggregation tasks.
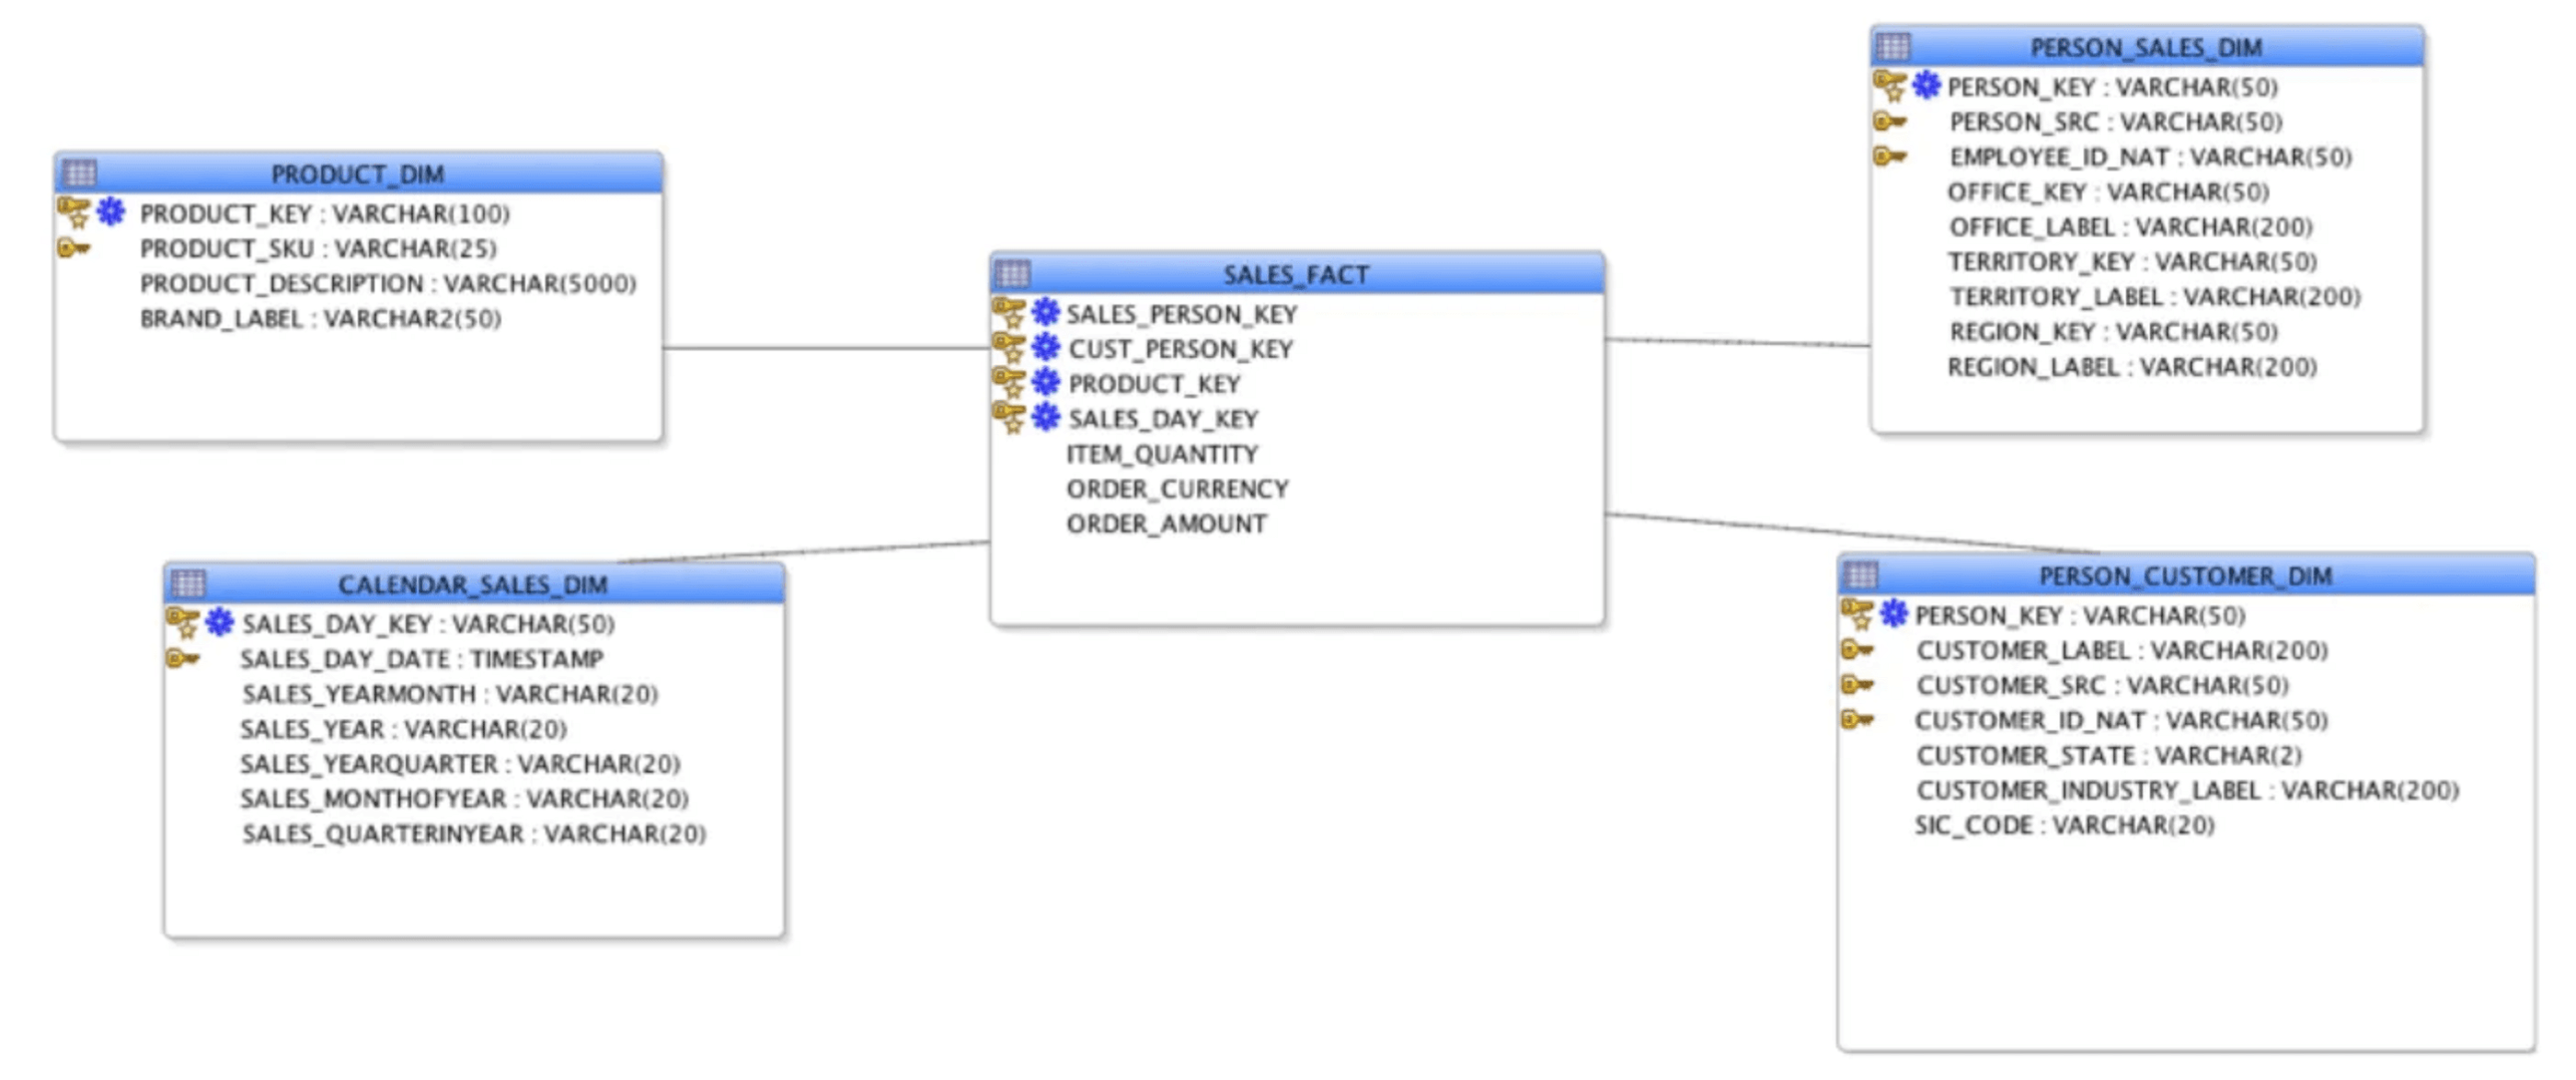
Dimensional modeling, on the other hand, uses two key concepts: fact tables and dimension tables.
- Fact tables: Store data that users need to analyze. This data is quantitative and includes sales, profits, costs, etc.
- Dimension tables: Hold information on the different ways users can analyze data in tables. They provide a descriptive context to facts in a system.
Using star schemas, ETL data modeling can bridge facts and dimensions. Star schemas rely on a combination of dimensions to make different dimension tables. Any of these combinations corresponds to exactly one record in the fact table. This achieves two things:
- Eliminate duplicates
- Speeds up the aggregation and analysis process
Modern data warehouses, instead of star schemas, use wide tables with many columns, which produce the same effect.
3. Determine table grains
The grain of a table or a view is what a single row in that table or view stands for. For example, in a table named prospects, the grain can be a single prospect. This way, each prospect has a row in the table, and there is exactly one row per prospect.
This is a basic example of grain in a data system.
But grains can get complex, too. For example, if you have a table named subscription_status, with exactly one row per subscriber per status. Different statuses can be renewed, soon-to-expire, and expired. In this case, each subscriber has multiple rows reflecting their subscription status.
Table grains determine how easy or difficult it is to combine tables and solve data analysis problems.
This is why it’s important first to determine the grain of a table and give it a distinct name to avoid confusion.
Data modeling challenges
Traditionally, data modeling was expected to build relations databases that involved structured data. Yet, the advent of big data and new business requirements resulted in several challenges:
- Large amounts of raw data that users need to analyze. This includes all kinds of machine data from IoT devices.
- Modern data models need to deal with data repositories distributed across public cloud, private cloud, and on-premise architecture.
- Data flows are moving faster from one data source to another and getting more complex.
Data modeling algorithms are an effective way to tackle the challenge. By using machine learning, statistical algorithms, and artificial intelligence (AI), users can automate the data modeling process. However, it is important to be aware of the risks of overfitting and underfitting in machine learning models.
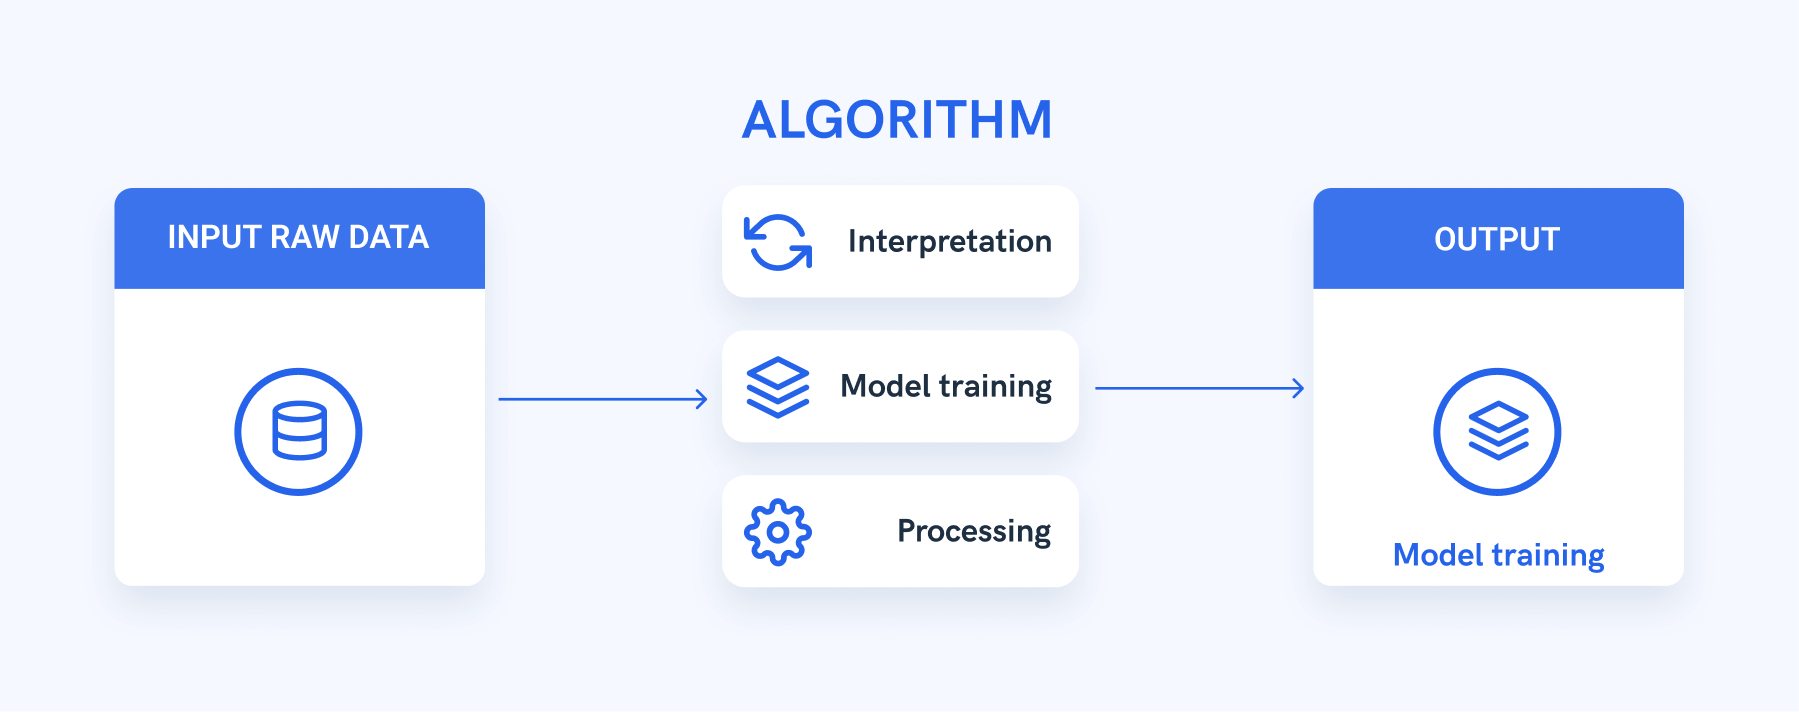
Automation eliminates the time-consuming task where data engineers need to define relations and data structures. Instead of manual work, users can focus on the business end of their projects.
Conclusion
Data modeling is an essential part of ETL, which is an essential part of data warehousing. As business apps collect more diverse datasets, more automation will be required to reduce human error and speed up the execution both on the provider and customer side.
Move your data to BigQuery with Whatagraphs and discover new business opportunities from visualized data.
Published on Feb 22 2023
WRITTEN BY
Nikola GemesNikola is a content marketer at Whatagraph with extensive writing experience in SaaS and tech niches. With a background in content management apps and composable architectures, it's his job to educate readers about the latest developments in the world of marketing data, data warehousing, headless architectures, and federated content platforms.