What is a Data Pipeline and How Does it Work?
As more and more organizations are looking to build microservices with small code bases with a specific purpose, data is moved between more and more applications. In this situation, the efficiency of data pipelines has become essential for planning and development. Data generated in one source can feed multiple data pipelines, and those pipelines may have other pipelines or applications that depend on their output. Today, we’re going to talk about data pipelines — what they are and how they work in practical terms.

Apr 14 2021●5 min read


What is a data pipeline?
A data pipeline is a series of processing steps used to load data into a data platform. Each step delivers an output that is an input to the next step, while sometimes independent steps can run in parallel.
Data pipelines consist of three main elements:
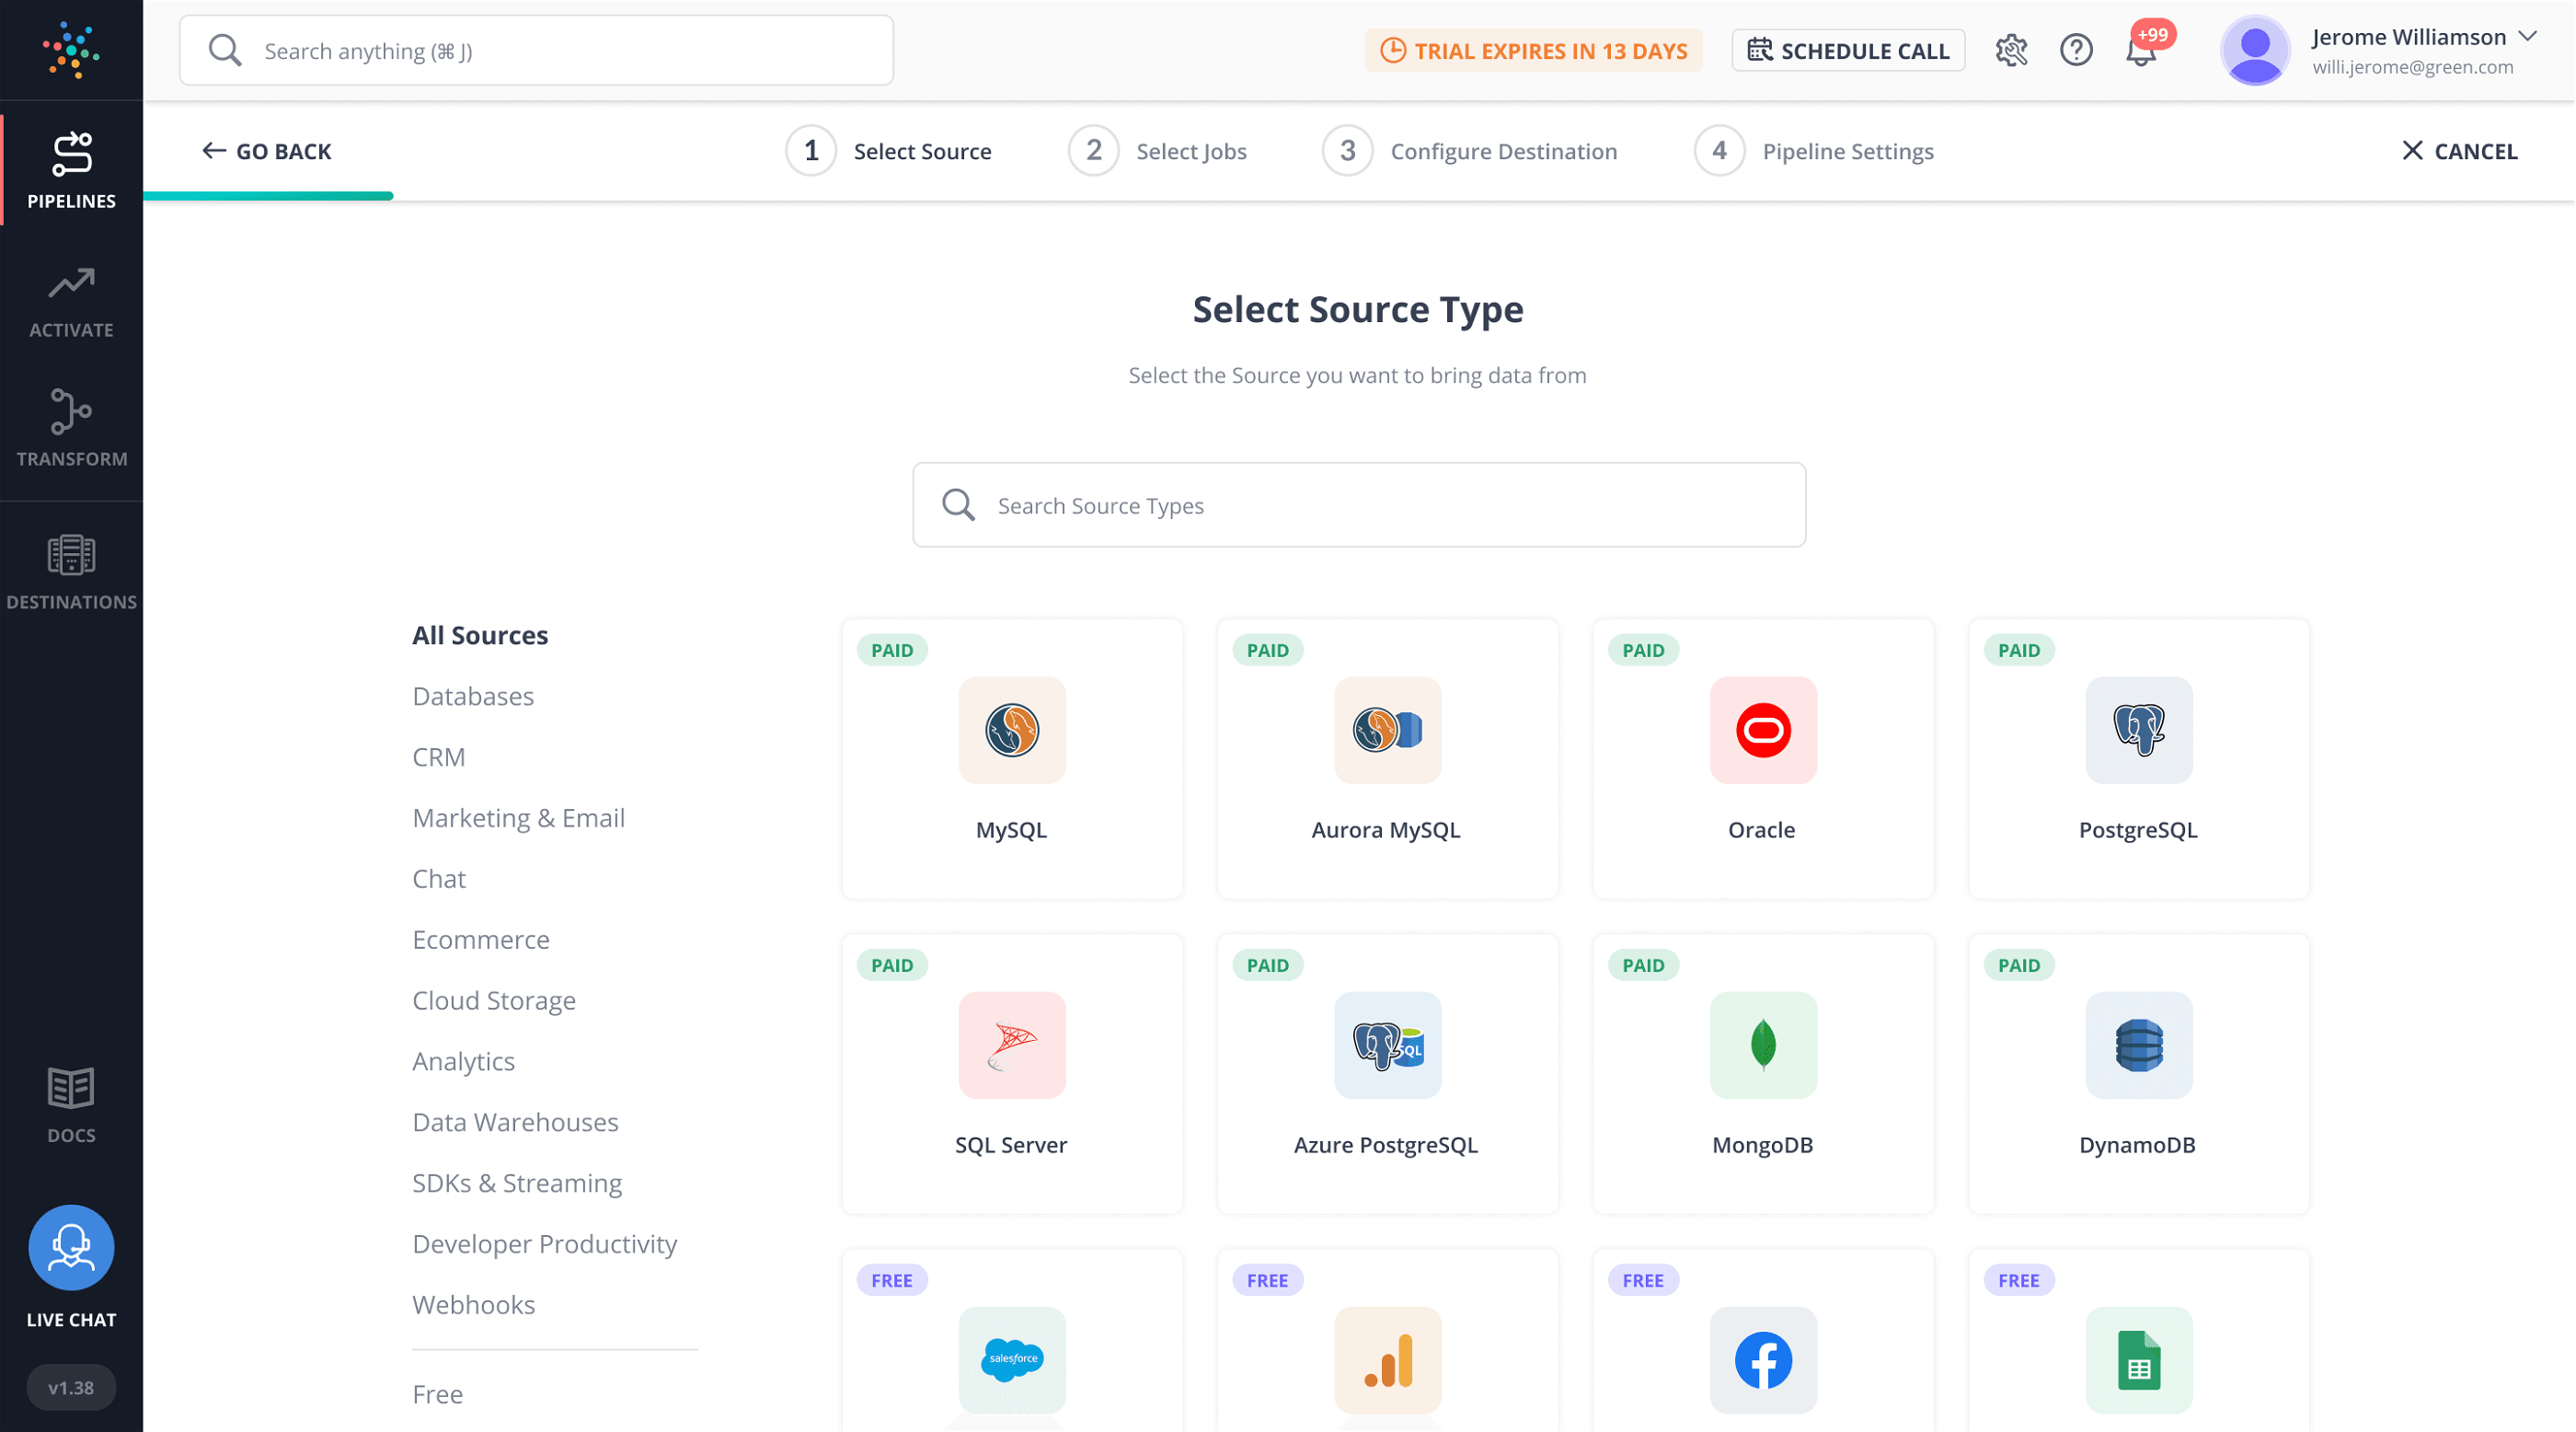
1. Source: the point of entry can be a transactional processing application, SaaS application API, IoT device sensor, or a storage system like a data warehouse.
2. Processing: All the activities and steps for ingesting data from sources, storing it, transforming, and loading it into the destination.
3. Destination: The final point to which data is transferred.
Data pipelines enable data flow from an application to a data warehouse, from a data lake to an analytics database, or into a payment processing system.
For example, a comment on social media could generate data to feed:
- A real-time report that counts social media mentions
- A sentiment analysis application that outputs a positive, negative, or neutral result
- An application that charts each mention on a world map
Although the data source is the same in all cases, each of these apps depends on unique pipelines that must be completed before the end user sees the report.
A data pipeline usually involves aggregating, organizing, and moving data. This often includes loading raw data into a staging table for storage and then changing it before finally inserting it into the reporting tables.
When designing Whatagraph, we wanted to offer a data pipeline that would help:
- Small non-tech teams
- Marketing agencies that handle hundreds of clients, each with their own data stacks
In both cases, teams need a fast, user-friendly and error free way to load data from multiple sources to Google BigQuery.
We simplified the data transfer process to the point-and-click level so anyone can do it without any coding.
The pros and cons of using a data pipeline
Let’s take a look at the benefits of using fully-managed and automated data pipelines and the drawbacks of sticking with legacy data pipeline architectures.
Pros
1. Data quality: The data flow from source to destination is easily monitored and accessible.
2. Minimal learning: Automated data pipelines like Whatagraph feature a simple and interactive UI that is simple for new customers to work on and perform transfers.
3. Incremental build: Data pipelines allow users to create data workflows incrementally. You can pull even a small slice of data from the data source to the user.
4. Replicable patterns: A data pipeline can be repurposed or reused for new data flows. A network of pipelines can create a way of thinking that sees individual pipelines as a pattern in a wider pipeline architecture.
Cons
1. Specialized skills required: Data engineers and analysts who set up data pipelines should not only have high problem-solving skills but also understand programming languages like SQL, Python, and Java.
2. Lack of automation: Every time there’s a change in your project, your team goes through a time-intensive process of getting your data or visualization updated.
3. Risk of starting from scratch: Whenever you create a specialized situation, you risk spending a large amount of time setting up the process each time you need to run a report or losing knowledge whenever individuals leave the team.
Data pipeline vs. ETL - differences and similarities
Extract, transform, load (ETL) systems are a type of data pipeline that moves data from a source, transforms the data, and then loads it into a database or data warehouse, mostly for analytical purposes.
However, ETL is usually just a sub-process of a data pipeline. Depending on the nature of the pipeline, ETL may be automated or not included at all. On the other hand, a data pipeline is a broader data science process that transports data from one location to another.
Historically, ETL pipelines have been used for batch workloads, but now a new generation of streaming ETL tools is emerging.
Recently, ETL pipelines have become more popular, especially with the emergence of cloud-native tools. In this type of pipeline, data ingestion still comes first, but any transformations come after the data has been loaded into the data warehouse.
This allows data scientists to do their own data preparation and grants them access to complete datasets for machine learning and predictive data modeling applications.
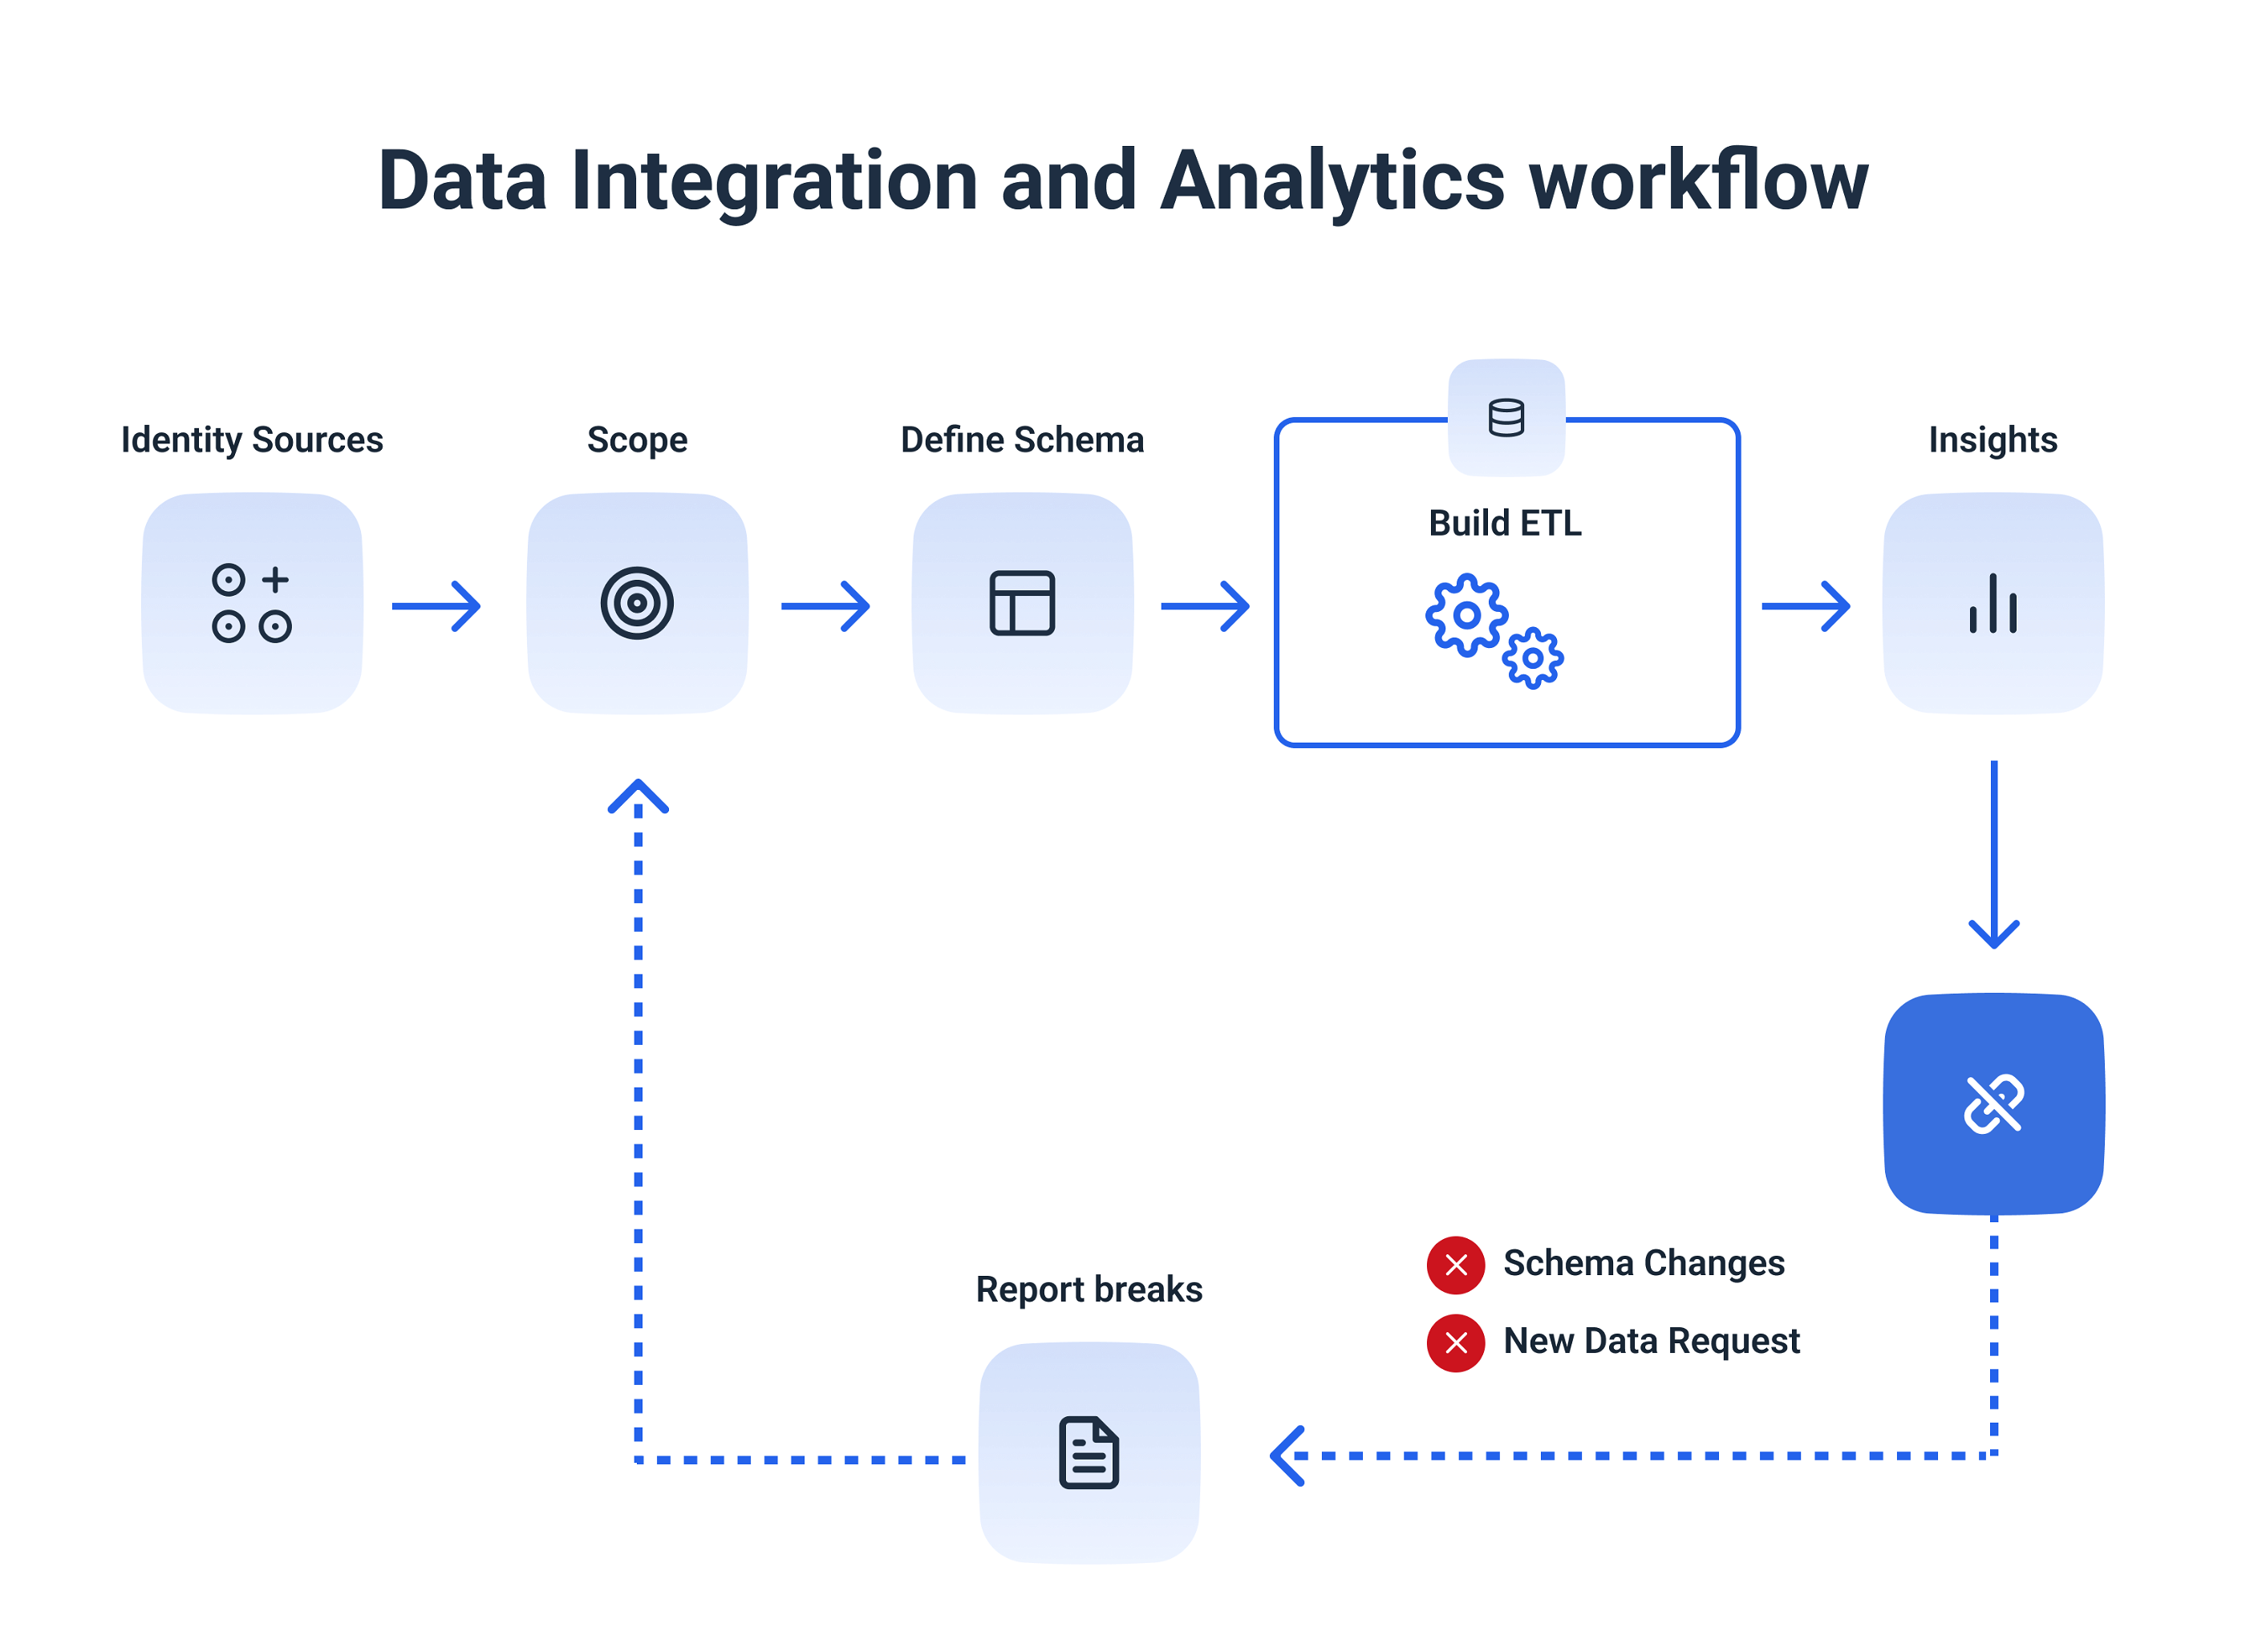
Data pipeline architecture
A data pipeline architecture gives a complete outline of data processing and technologies used to replicate data from a source to a destination system. This involves data extraction, data transformation, and data loading.
A typical data pipeline architecture includes data integration tools, data governance, and data quality tools, as well as data visualization tools.
A modern data stack consists of:
- An automated data pipeline tool like Whatagraph.
- A cloud data warehouse like BigQuery, Databricks Lakehouse, Snowflake, or Amazon Redshift.
- A post-load transformation tool such as DBT (data build tool).
- A business intelligence engine.
Data pipeline architectures can take several forms:
1. Batch-based data pipelines
You would use this type, for example, if you have an application like a point-of-sale system that generates a large number of data points that you need to push to a data warehouse.
2. Streaming data pipeline
Here, data from the point of sales system would be processed as it is generated. The stream processing engine feeds outputs from the pipeline to data stores, marketing applications, and CRMs, and back to the point of sale system itself.
3. Lambda architecture
This type combines batch and streaming pipelines into one architecture. It’s popular in big data environments because it allows data engineers to account for both real-time data streaming use cases and historical data analysis.
An important aspect of lambda architecture is that it supports storing data in raw format so that you can continually run new data pipelines to correct any code errors in earlier pipelines or to create new data destinations that enable new query types.
In all these cases, data pipeline architecture should enable efficient and reliable data ingestion while ensuring that the data remains accurate, complete, and consistent.
The best data pipeline tools
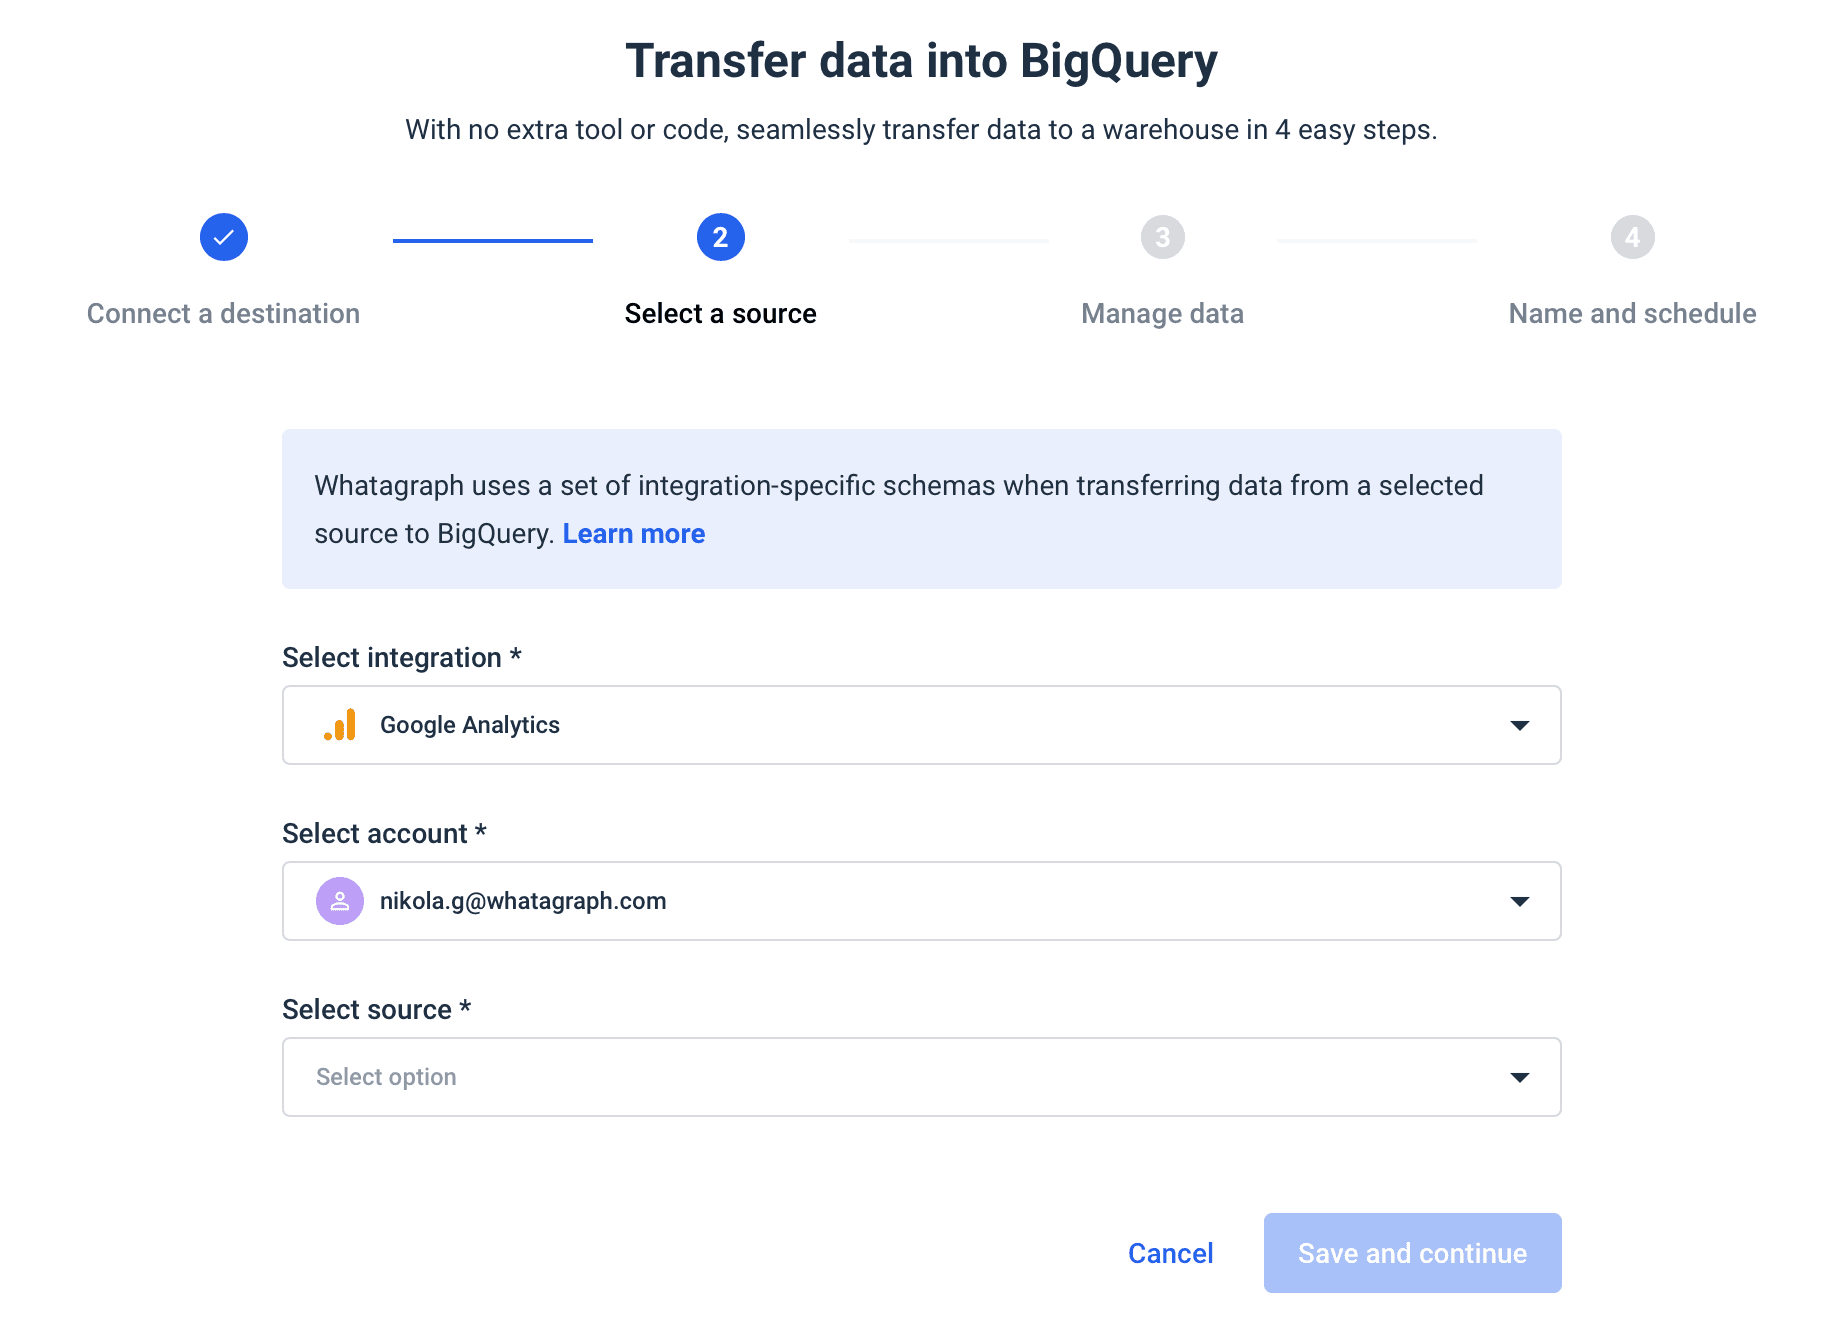
Whatagraph
Whatagraph provides seamless and effortless data transfers from marketing platforms like Google Ads and Facebook Ads to Google BigQuery. The data transfer service is already available from the basic pricing plan and takes only four steps to complete:
- Connect the destination
- Choose the integration
- Set the schema
- Schedule the transfer
Unlike open-source pipeline tools like Apache Spark, with Whatagraph, you don’t need the expertise to write the custom scripts and maintain the data pipeline. Whatagraphs is already customized for the users’ needs and is ready for use.
As the number of sources and the volume of your data grows, Whatagraph scales with your needs.
Should you need to report on your BigQuery data, Whatagraph helps you create interactive BigQuery dashboards that you can fully customize with the relevant metrics and dimensions.
Hevo Data
Hevo Data would be the next logical choice, mainly for its real-time data management. Tools like Talend and Pentaho perform batch processing — processing data in large chunks at regular intervals.
This is not enough when your business requires real-time data analytics. Hevo eliminates the latency and automatically detects the schema of incoming data, and maps it to the destination schema.
Apart from automation, Hevo also provides live monitoring so you can always check where your data is at a particular point in time.
Fivetran
Fivetran is an automated data connector that supports 150+ data sources, including databases, cloud services, and applications. Unlike on-premises data pipelines, Fivetran allows you to replicate large volumes of data from your cloud applications and databases to cloud data warehouses and data lakes.
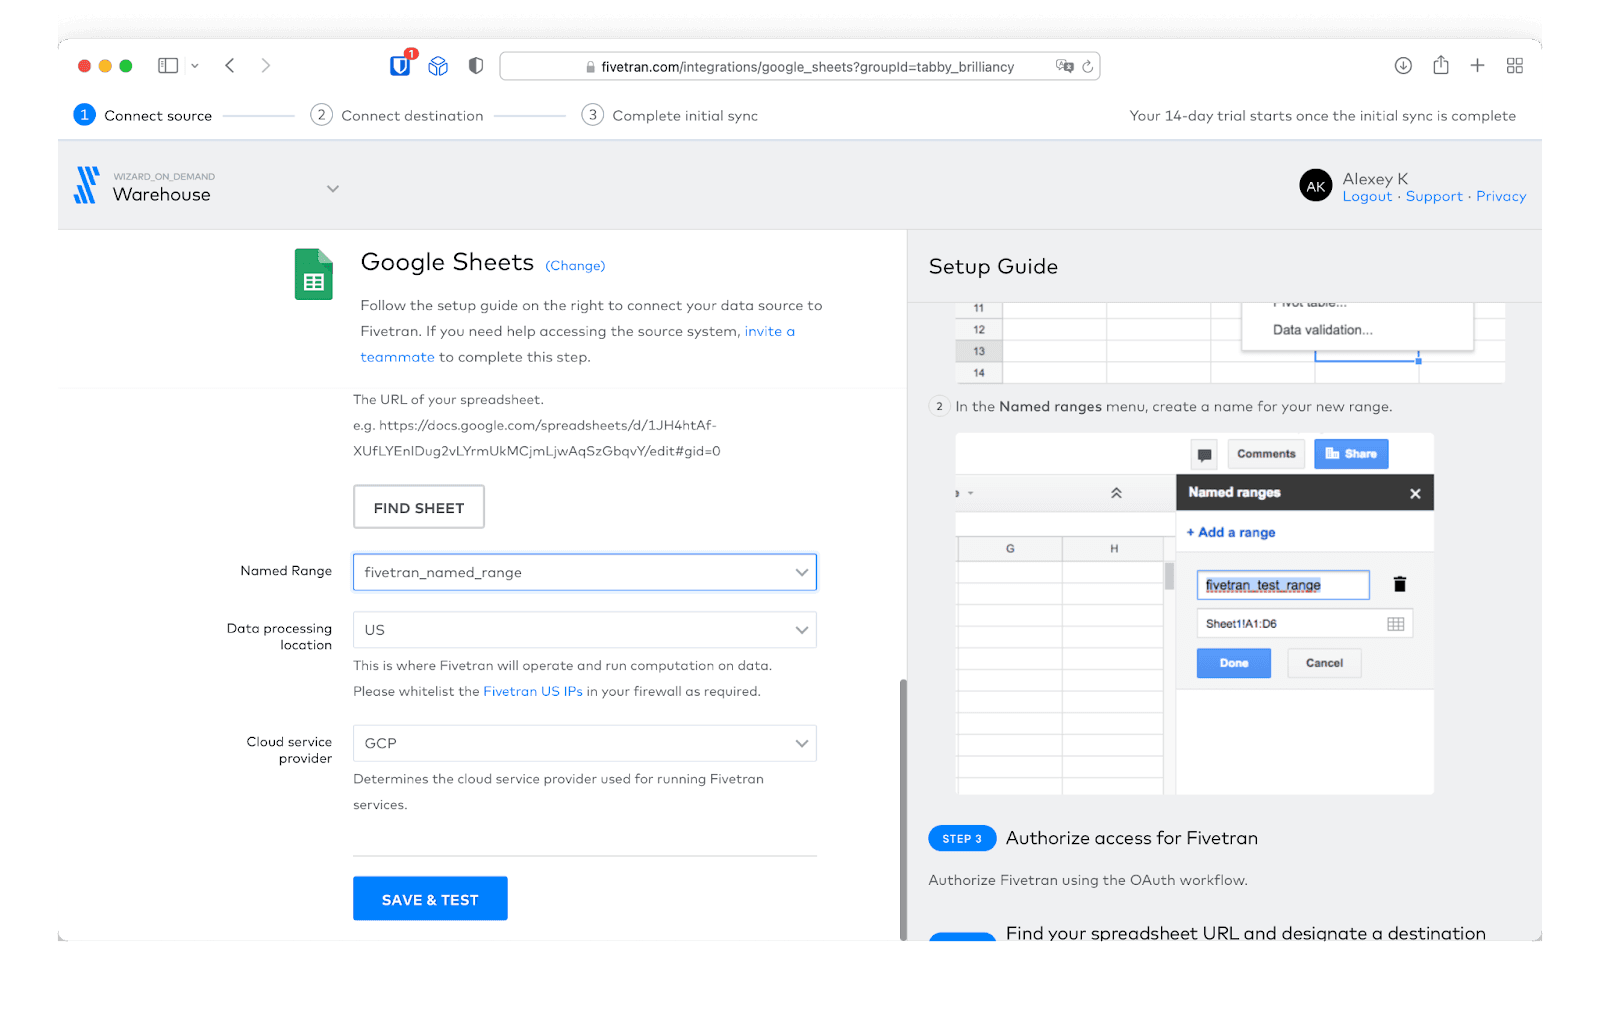
Fivetran connectors automatically adapt as vendors make changes to schemas by adding or removing columns or adding new tables. This data pipeline manages normalization and creates ready-to-query data assets that are fault tolerant and capable of auto-recovering in case of failure.
Conclusion
Data pipelines have become a key element of any data-driven business, where having accurate and timely information is the foundation of decision-making.
Automated data pipeline tools, like Whatagraph, eliminate all the risks associated with data transfer, making data migration safe and reliable.
If you’re looking for an easy-to-use solution to connect data from various marketing sources, keep your marketing data safe, or want to visualize your BigQuery data, book a demo call and find out how Whatagraph can help.
Published on Apr 14 2021
WRITTEN BY
Nikola GemesNikola is a content marketer at Whatagraph with extensive writing experience in SaaS and tech niches. With a background in content management apps and composable architectures, it's his job to educate readers about the latest developments in the world of marketing data, data warehousing, headless architectures, and federated content platforms.