How to Get Started With Facebook Analytics
To have success in today’s digital landscape, you have to know your audience as much as possible. The best Facebook page analytics tool that will help you get all the information you need about your audience comes from Facebook itself – Facebook Insights.

Jan 16 2020 ● 4 min read
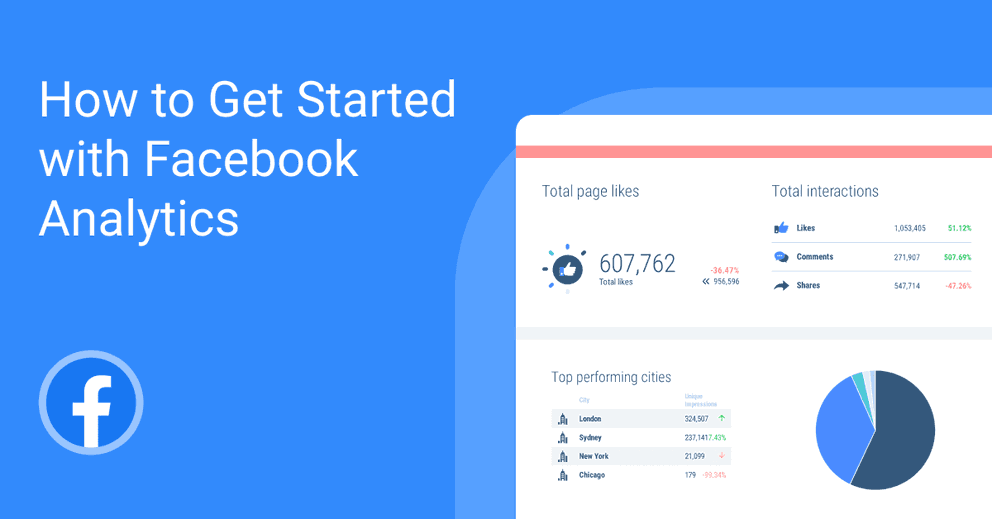
It helps you understand your Facebook Page and take advantage of the analytics available as much as you can. Facebook Insights provides valuable data including reach, engagement, likes, and demographics to see if your content is resonating with your Facebook page audience, how your strategy is performing, and how your page is growing.
If you want to promote your business on Facebook, you must know how to use Facebook Insight and analytics. Only in that way you can have a successful Facebook marketing strategy and satisfied audience that will resonate with your content.
How to Get Started with the Facebook Page Analytics Tool – Facebook Insights
The first thing to know to get started with this free Facebook tool is where to find it. Any admin of your Facebook page can see “Insights” at the top of the screen.
According to Facebook, your page needs to have at least 100 fans before you can get accurate analytical data.
Click on “Insights” and you’ll see another screen with multiple sections for a specific set of data collected from users that interacted with your page.
Sections of Facebook Insights
Here are all the sections within Facebook Insights:
- Overview – your page’s performance
- Promotions – reports from paid content
- Followers – the current follower count and where you got new followers
- Likes – the total number of likes and where people liked your page
- Reach – how many people saw the content of your page and interacted with it
- Pageviews – the most popular sections of your page
- Actions on Page – the more important clicks on your page
- Posts – the performance of your posts
- Events – the success of your event pages
- Videos – the performance of your videos
- Stories – analytics data on your stories
- People – who is looking at your Facebook page
- Messages – messenger analytics and response times
- Local – users in close proximity
How to Use Facebook Insights and Analytics
Here’s how to use each section of Facebook Insights.
 | Overview |
This section presents important data at a glance what has happened on your Facebook page over the last day, week, or month.
It generally tracks page likes, post reach, engagement, and recommendations. The key metrics are presented in the page summary section here.
Other sections within the Overview section are “Your 5 Most Recent Posts” and “Pages to Watch”.
The first one presents key information about your last 5 posts and allows you to see which of them are performing well.
The second one compares your page with other similar pages on Facebook. If you want to learn more or you notice a pattern developing, you can find out more in other sections.
 | Promotions |
The data from this section shows the money spent on ads, reach, a breakdown of demographics, where users found your content, and actions taken on the post.
 | Followers |
The number of followers is different from the number of likes. A person that likes your page automatically follows it, but they might choose to unfollow it while still liking it and the other way round. This section shows the number of followers, net followers, and where new followers come from.
 | Likes |
This section doesn’t only show how many likes your page has, but the sources, averages, and growth of the likes as well. You can see the total page likes as of today, the number of new likes without the number of unlikes (net likes), and where they happened. You can compare the data over the last week, month, etc.
 | Reach |
This section of this fantastic Facebook page analytics tool shows the reach of your page and posts, as well as the factors that affect it either positively or negatively. Sections within the reach section include Post Reach, Reactions, Comments and Shares, Total Reach, Reactions, and Hide, Report as Spam, and Unlikes.
 | Page Views |
The Page View section shows your page’s total views, total people who viewed it by age and gender, section, device, country, and city. Also, it presents the top traffic sources which have brought people to your page.
 | Actions on Page |
Here you can see people’s actions on your page. For example, whether they click on your website, on your phone number, on your action button, on get directions, as well as the total actions on your page.
 | Posts |
The Post tab shows the performance of your posts such as engagement and reach. You can see the time your fans are online, top posts from similar pages, reach, and average engagement of each of your post types, etc. All of this information can help you adjust your posting strategy.
 | Events |
This is a very useful section for those that host events. You can see the reach and views of the event page, as well as who took action there, the demographics of your audience, and who responded to the invite. In this way, you can find out what’s working with your event and whatnot.
 | Videos |
You can see what type of video content works best for your audience based on metrics such as video views, 30-second views, and top videos found in this section.
 | People |
The purpose of this section is to help you understand your audience better. It shows information about your fans (age, gender, language, and location,) the people who have seen your content, and those that have interacted positively through sharing, commenting, or liking your posts. All of this information can help you create better content that resonates with your audience for a successful marketing strategy and ad campaign.
 | Stories |
This section shows the analytical data on your stories up to two weeks after publishing, including overall distribution, demographic information on the people reached, and positive or negative engagement.
 | People |
If you are wondering how to see who has viewed your Facebook page, this is the right place. The People section shows a percentage breakdown of followers, fans, and other people reached by age and gender. What’s more, it shows their country, city, and language. This valuable data can help you create the right content for your audience.
 | Local |
The Local tab provides important data for businesses and brands focusing on local exposure. It shows gender, age, and general home location of those in close proximity to theirs.
 | Messages |
This section shows the number of people contacted through Facebook Messenger.
Facebook Analytics for Those Using Facebook Business Manager
People using Facebook Business Manager can also see data that’s related to the overall customer experience in the Measure and Report section within the Facebook Analytics page
This is especially beneficial for those managing multiple location pages as they can see analytics data from all of them at once with the creation of an Event Source Group.
In this way, they can see multiple pages as a group. There are different custom filters you can choose from the dropdown menu found on the top of the page.
Published on Jan 16 2020

WRITTEN BY
Krystyna KrajevskajaKrystyna believes optimizing the way you report data is the key to a good marketing strategy. A seasoned social media manager with experience in B2B companies, she loves to identify and share new business opportunities.

