11 Best Looker Studio Report and Dashboard Examples
Looking for Looker Studio report and dashboard examples you can actually use?
We’ve reviewed dozens of templates to find the best ones for PPC, SEO, eCommerce, CRM, and email reporting—so you don’t waste time on clunky dashboards that break.
Plus, we’ll show you where Looker Studio falls short and how Whatagraph can help you automate reporting with clean, branded dashboards your clients or stakeholders will actually understand.

Jul 07 2025●8 min read
- How We Chose the 11 Best Looker Studio Report and Dashboard Examples
- 4 Looker Studio Report Examples for Paid Advertising (PPC)
- 3 Best SEO Dashboard Examples for Looker Studio
- 2 Best eCommerce Dashboard Examples for Looker Studio
- 2 Best CRM and Email Marketing Dashboards on Looker Studio for Reporting
- How to Build a Dashboard Using Looker Studio?
How We Chose the 11 Best Looker Studio Report and Dashboard Examples
When we were looking for the “best” Looker Studio report templates, we kept seeing templates that are old-fashioned, clunky, and with broken widgets.
But we sifted through all that and picked out the most functional ones for 4 different use-cases:
- Paid advertising (PPC)
- SEO
- e-Commerce
- CRM & email marketing
Here are the criteria we looked for in the best ones:
✅ Modern, clean layouts: We hand-picked Looker Studio dashboards that look sleek, vibrant, and professional, not stuck in 2014.
✅ Functional, working widgets: We made sure the charts and tables actually update and display data correctly, without errors.
✅ Goal-focused structure: In terms of the structure of these Looker Studio templates, we highlighted the ones that have a clear alignment between business goals and the KPIs shown.
✅ Easy to customize: We picked Looker Studio custom reports you can adapt to your clients’ needs without rebuilding everything from scratch.
✅ Actionable insights: We looked for Looker studio marketing dashboards that include some form of performance summary or explanations, rather than just data-dumps.
But we’re going to let you in on a little “hack”. With Whatagraph, you don’t even need report templates or dashboard examples anymore.
You can now have our AI create reports, widgets, and color schemes from scratch—without any manual work.
Here’s how it works:
- Choose “Create with AI” under New Report.
- Type in your prompt about any kind of report you want (e.g. “Create a Google Analytics 4 report that shows the key general metrics and then drill down into the highest performing landing pages.”)
And you’re done! Whatagraph will create a fully-fleshed out report in seconds.
Want to edit specific widgets? Just type in your prompt and Whatagraph will edit it for you.
See how it works in this video:
But…if you’re choosing to stick with Looker Studio reports, below are the 11 best ones, divided into 4 different use-cases.
4 Looker Studio Report Examples for Paid Advertising (PPC)
Here are the Looker Studio dashboard templates you’ll see in this section:
- Cross-channel PPC report
- Google Ads report
- LinkedIn Ads report
- Facebook Ads report
1. Cross-channel PPC report
For this, we chose Porter’s cross-channel PPC report template.
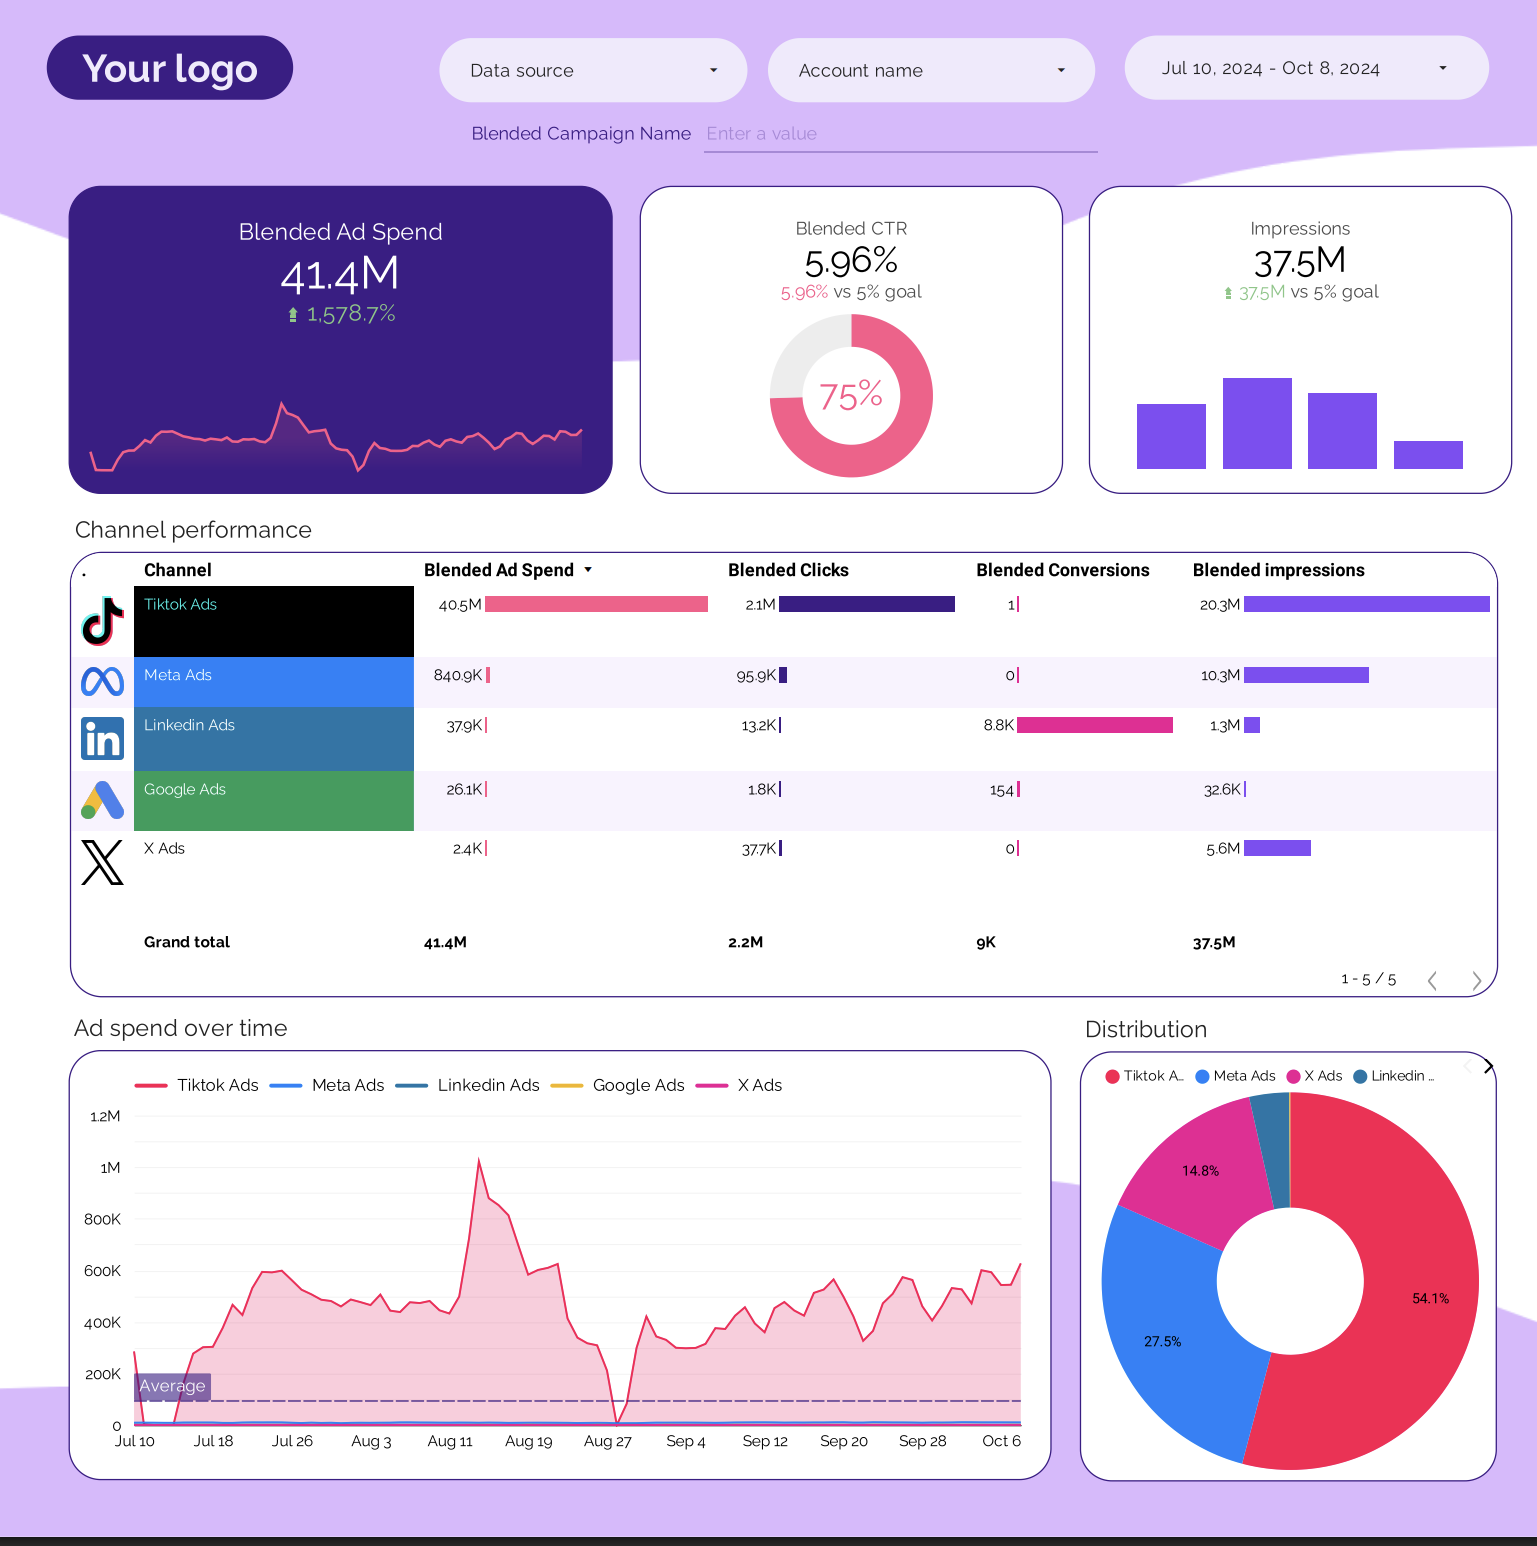 We love that this dashboard is vibrant, modern, and clean.
It shows critical metrics across different PPC platforms like TikTok Ads, Meta Ads, X Ads, and LinkedIn Ads—ad spend, impressions, clicks, CTR, CPC, conversions, CPA, and conversion rates—in one interactive view, letting you spot which channels are performing best at a glance.
You get:
- Multi-channel clarity: Easily compare spend, clicks, and conversions across channels without toggling between tabs.
- Campaign-level breakdowns: See which campaigns and creatives drive the most engagement and conversions.
- Visual pacing charts: Track spend and marketing performance over time to ensure budget alignment and detect underperforming campaigns early.
- Engagement, visibility, and conversion views: Quickly move from top-level channel metrics to granular campaign-level details.
But keep in mind, with this template you:
❌ Don’t get actionable insights. It’s merely a dump of data (albeit a nicely structured one), but there aren’t any summaries of what went well and what didn’t, recommendations or next steps to take.
❌ Need to use and pay for third-party connectors. Looker Studio only offers free, native connectors for Google-based platforms. But if you want to visualize data from non-Google platforms like TikTok Ads or LinkedIn Ads, you’d need to pay for third-party connectors like Porter, Supermetrics, or Funnel. We wrote extensively about the downsides of this in this Looker Studio review piece.
Whatagraph’s cross-channel PPC report template solves these two pain points.
✅ It comes with actionable insights that you can write yourself, or use AI to generate in seconds. AI can generate summaries, recommendations, wins, or issues in 18 different languages, so you don’t need to write from scratch. These are also fully editable, so you’re still retaining that human touch.
✅ It’s an all-in-one marketing intelligence platform, meaning you don’t need to use or pay for third-party connectors. You can visualize data from 55+ marketing platforms (both Google AND non-Google ones) through native, stable connectors in seconds.
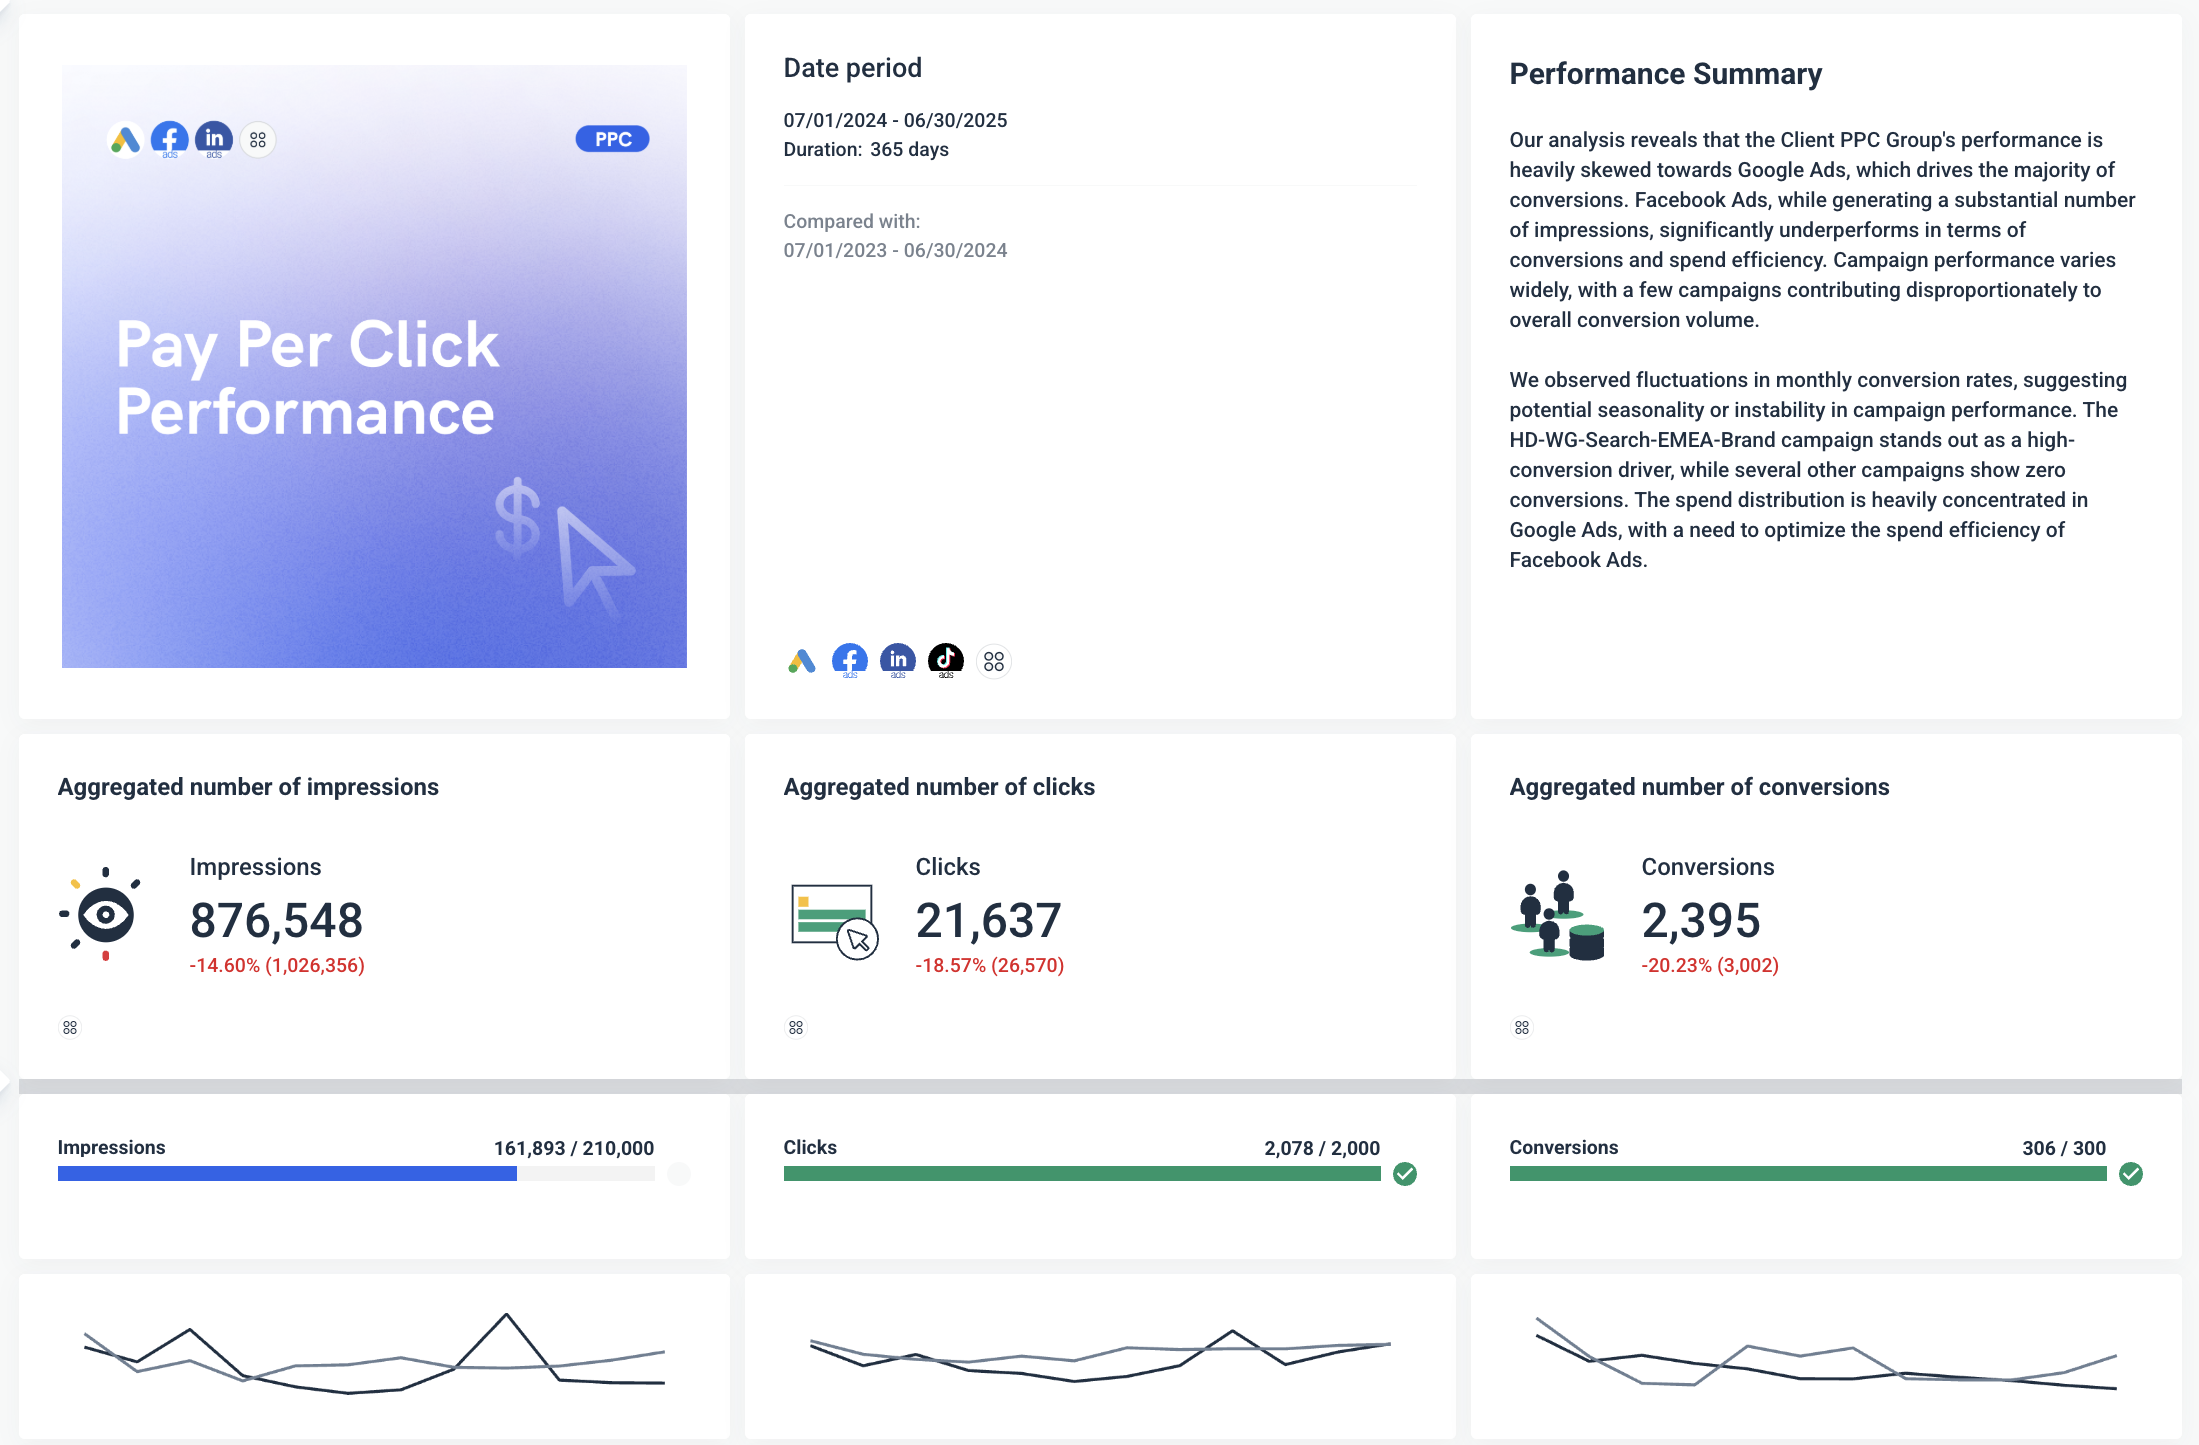
In terms of the structure, Whatagraph’s PPC report template starts off with:
- An overview of the PPC channels used in the report (Google Ads, Facebook Ads, LinkedIn Ads, TikTok Ads)
- The reporting date period
- Aggregated metrics (impressions clicks, and conversions)
- Metric trends
- Performance summary that gives an overview of what happened during the reporting period
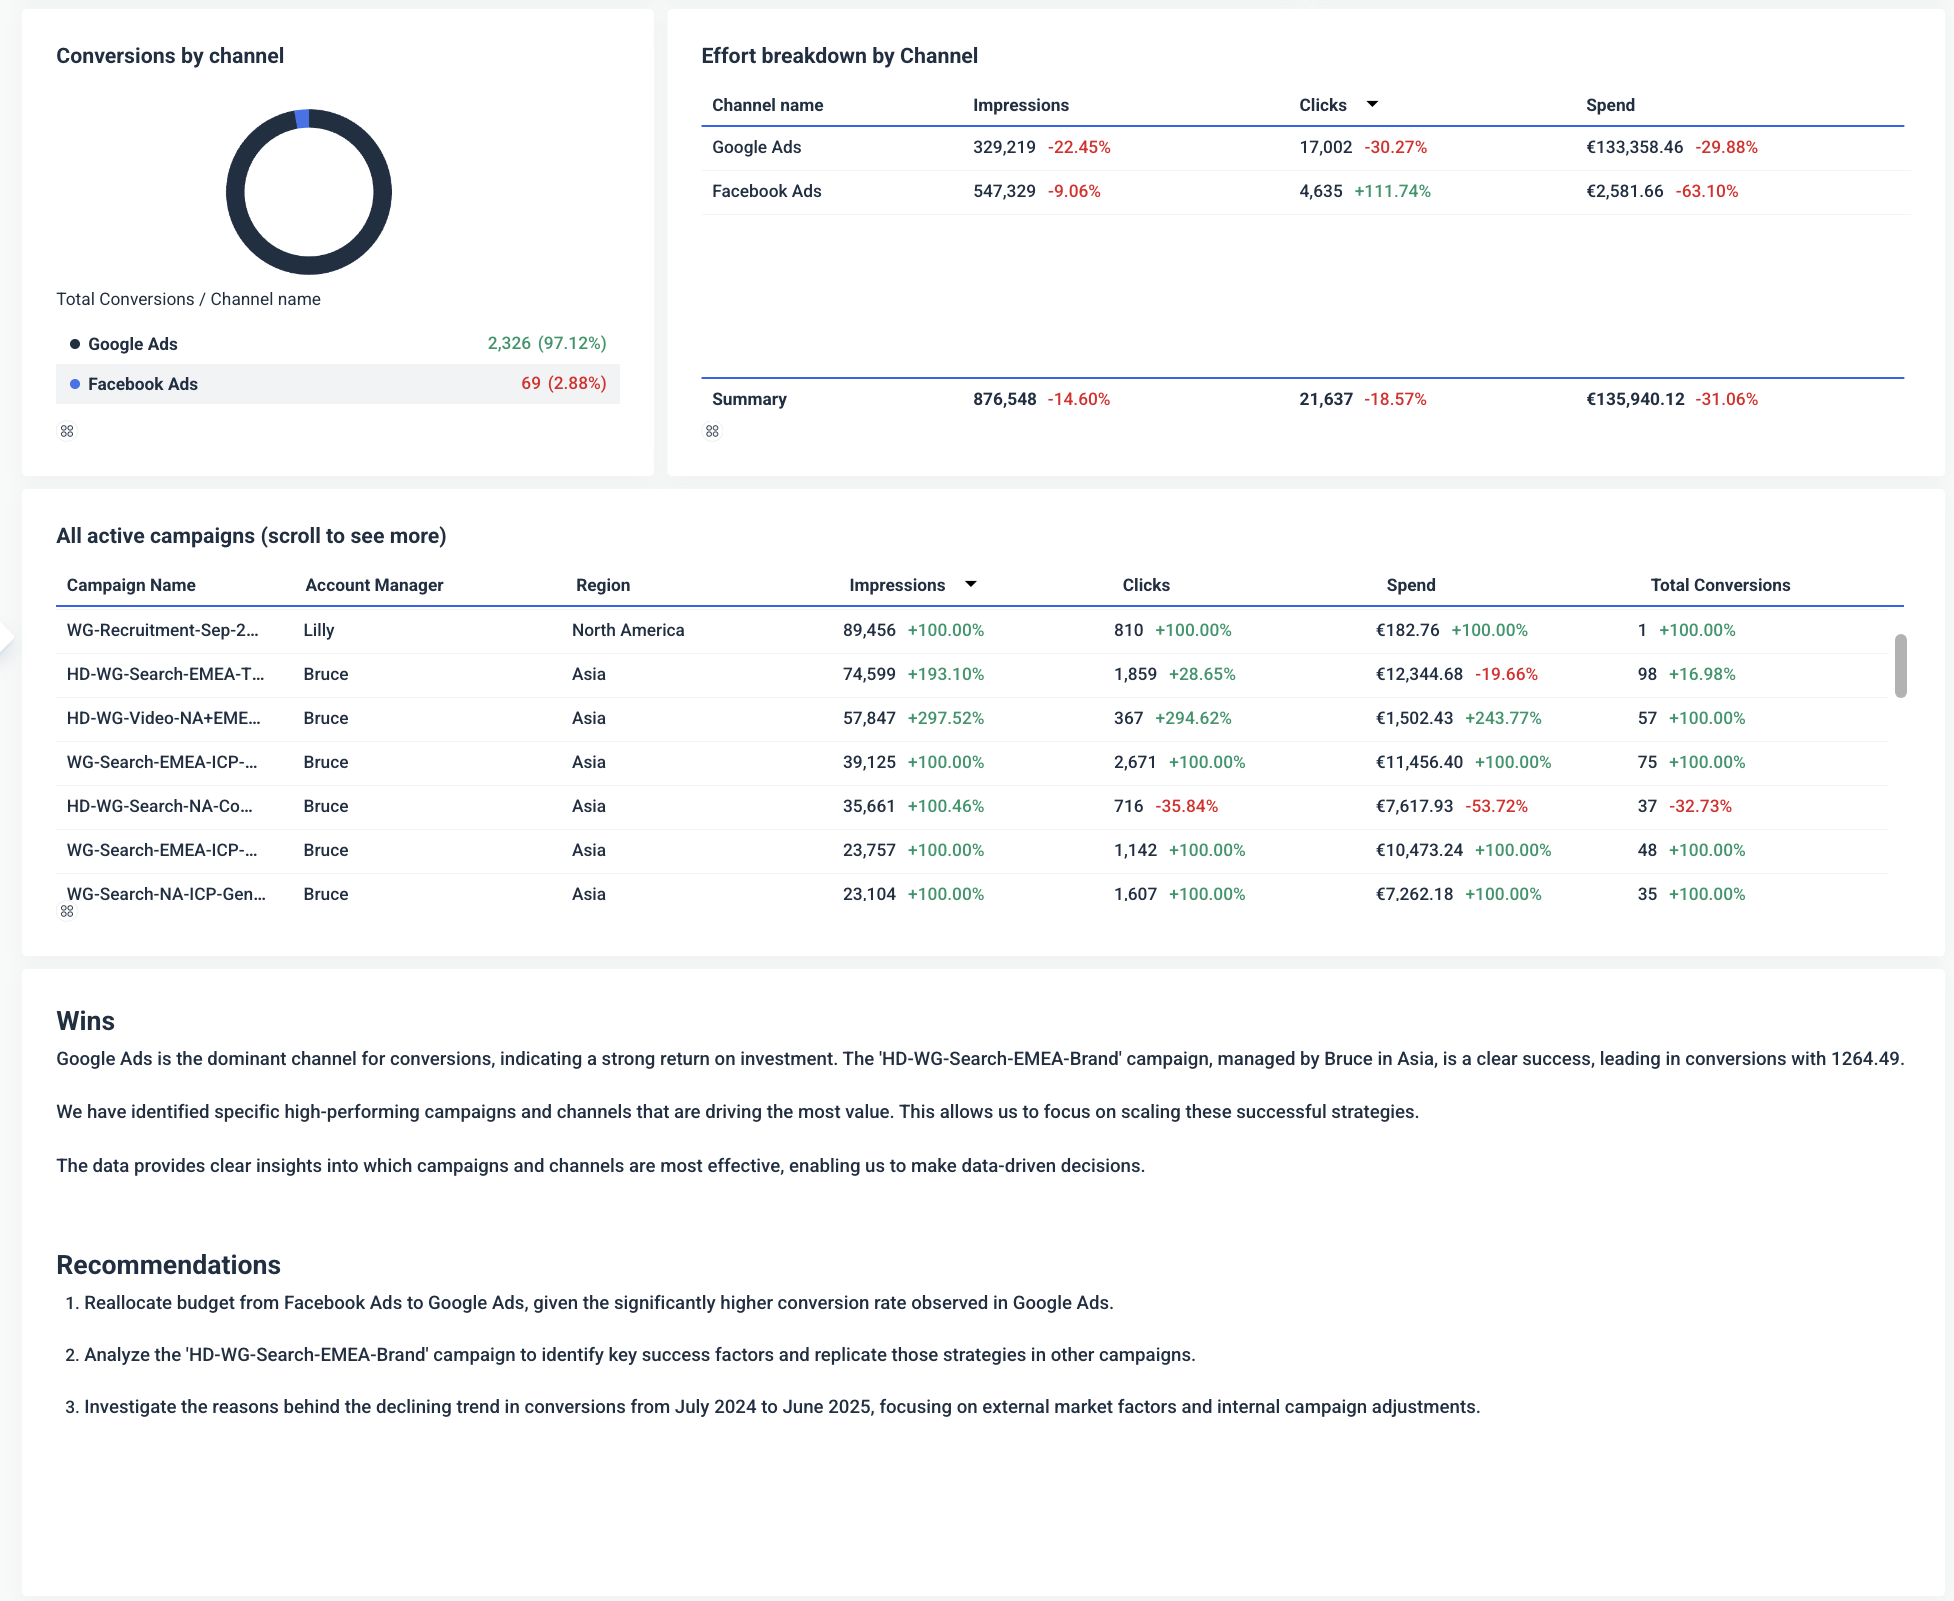
 Next, it goes deeper into:
- Conversions by channel (Google Ads vs. Facebook Ads)
- Metric breakdown by channel
- All active PPC campaigns and their performance metrics broken down by Account Manager and Region
- Wins and recommendations (or action items)
Plus, the template is broken down into different “tabs” —one for top-level overview, and then for each channel—in ONE report.
This means your clients or stakeholders get to see a holistic view of performance in one place rather than having to dig around multiple reports.
 In fact, this is what Tanja Keglić, Performance Marketing Manager at Achtzehn Grad agency, loves about us. She said:
The biggest reason we chose Whatagraph was because of its holistic approach to reporting. We can blend data from different channels and see in one view what's the performance and what needs to be changed.
Plus, Tanja was using a third-party connector, Supermetrics, to bring in non-Google data into Looker Studio, but the connections were always breaking and she had to waste time manually fixing them herself or contacting Support and waiting.
This problem was solved after switching to Whatagraph. She never had connection issues again, and she saved 5 hours per report. She said:
We don’t have any connection issues on Whatagraph at all. We just connected the platforms once, and that was it. Whatagraph is also very, very fast at loading the data.
2. Google Ads dashboard template
For this, we chose Data Bloo’s Google Ads report template for its clean, sleek aesthetics.
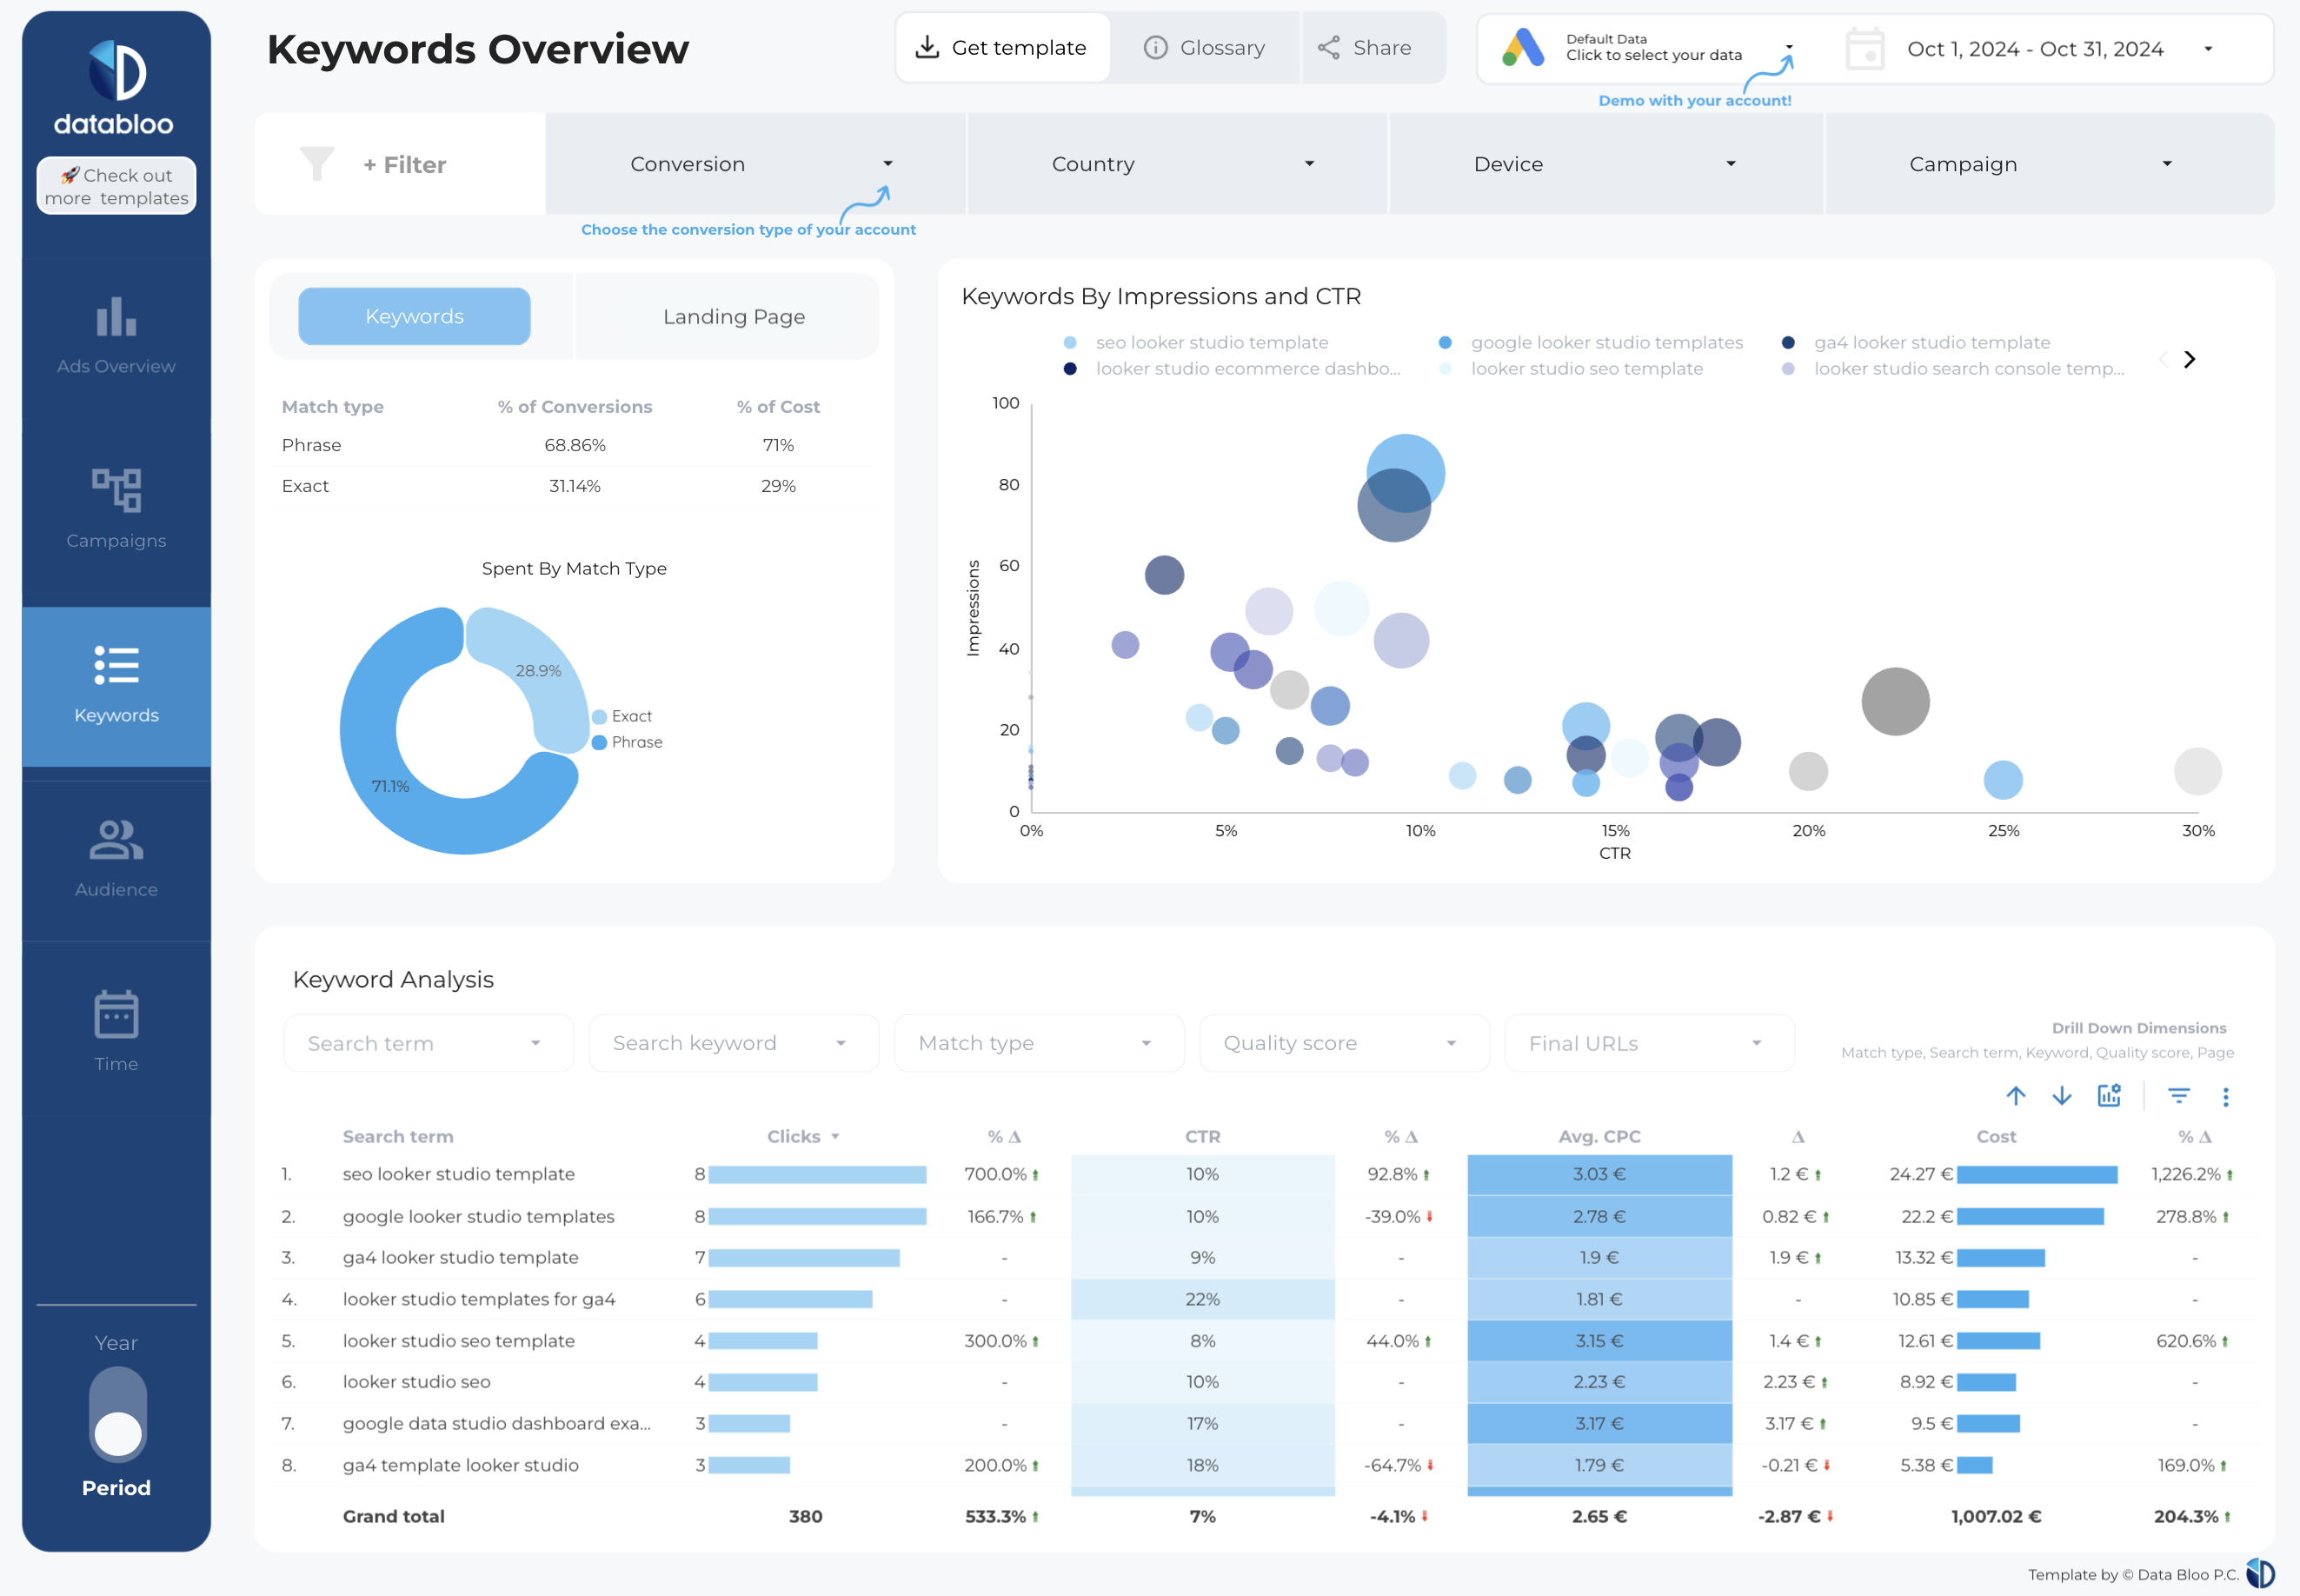 It’s broken down into 5 clear sections:
- Ads overview
- Campaigns
- Keywords
- Audiences
- Time
You get a top-level view of key metrics like impressions, clicks, conversions, and cost per conversion, alongside detailed breakdowns by campaign, keyword, audience type, and location.
Also, we like how visuals like pie charts, bubble charts, and time-series graphs help you quickly spot trends and performance shifts without getting lost in raw data.
You can also add filters for device, country, and campaign and analyze data any way you want to.
But keep in mind, this template is NOT free. You’ll need to pay 149 euros to get access to it.
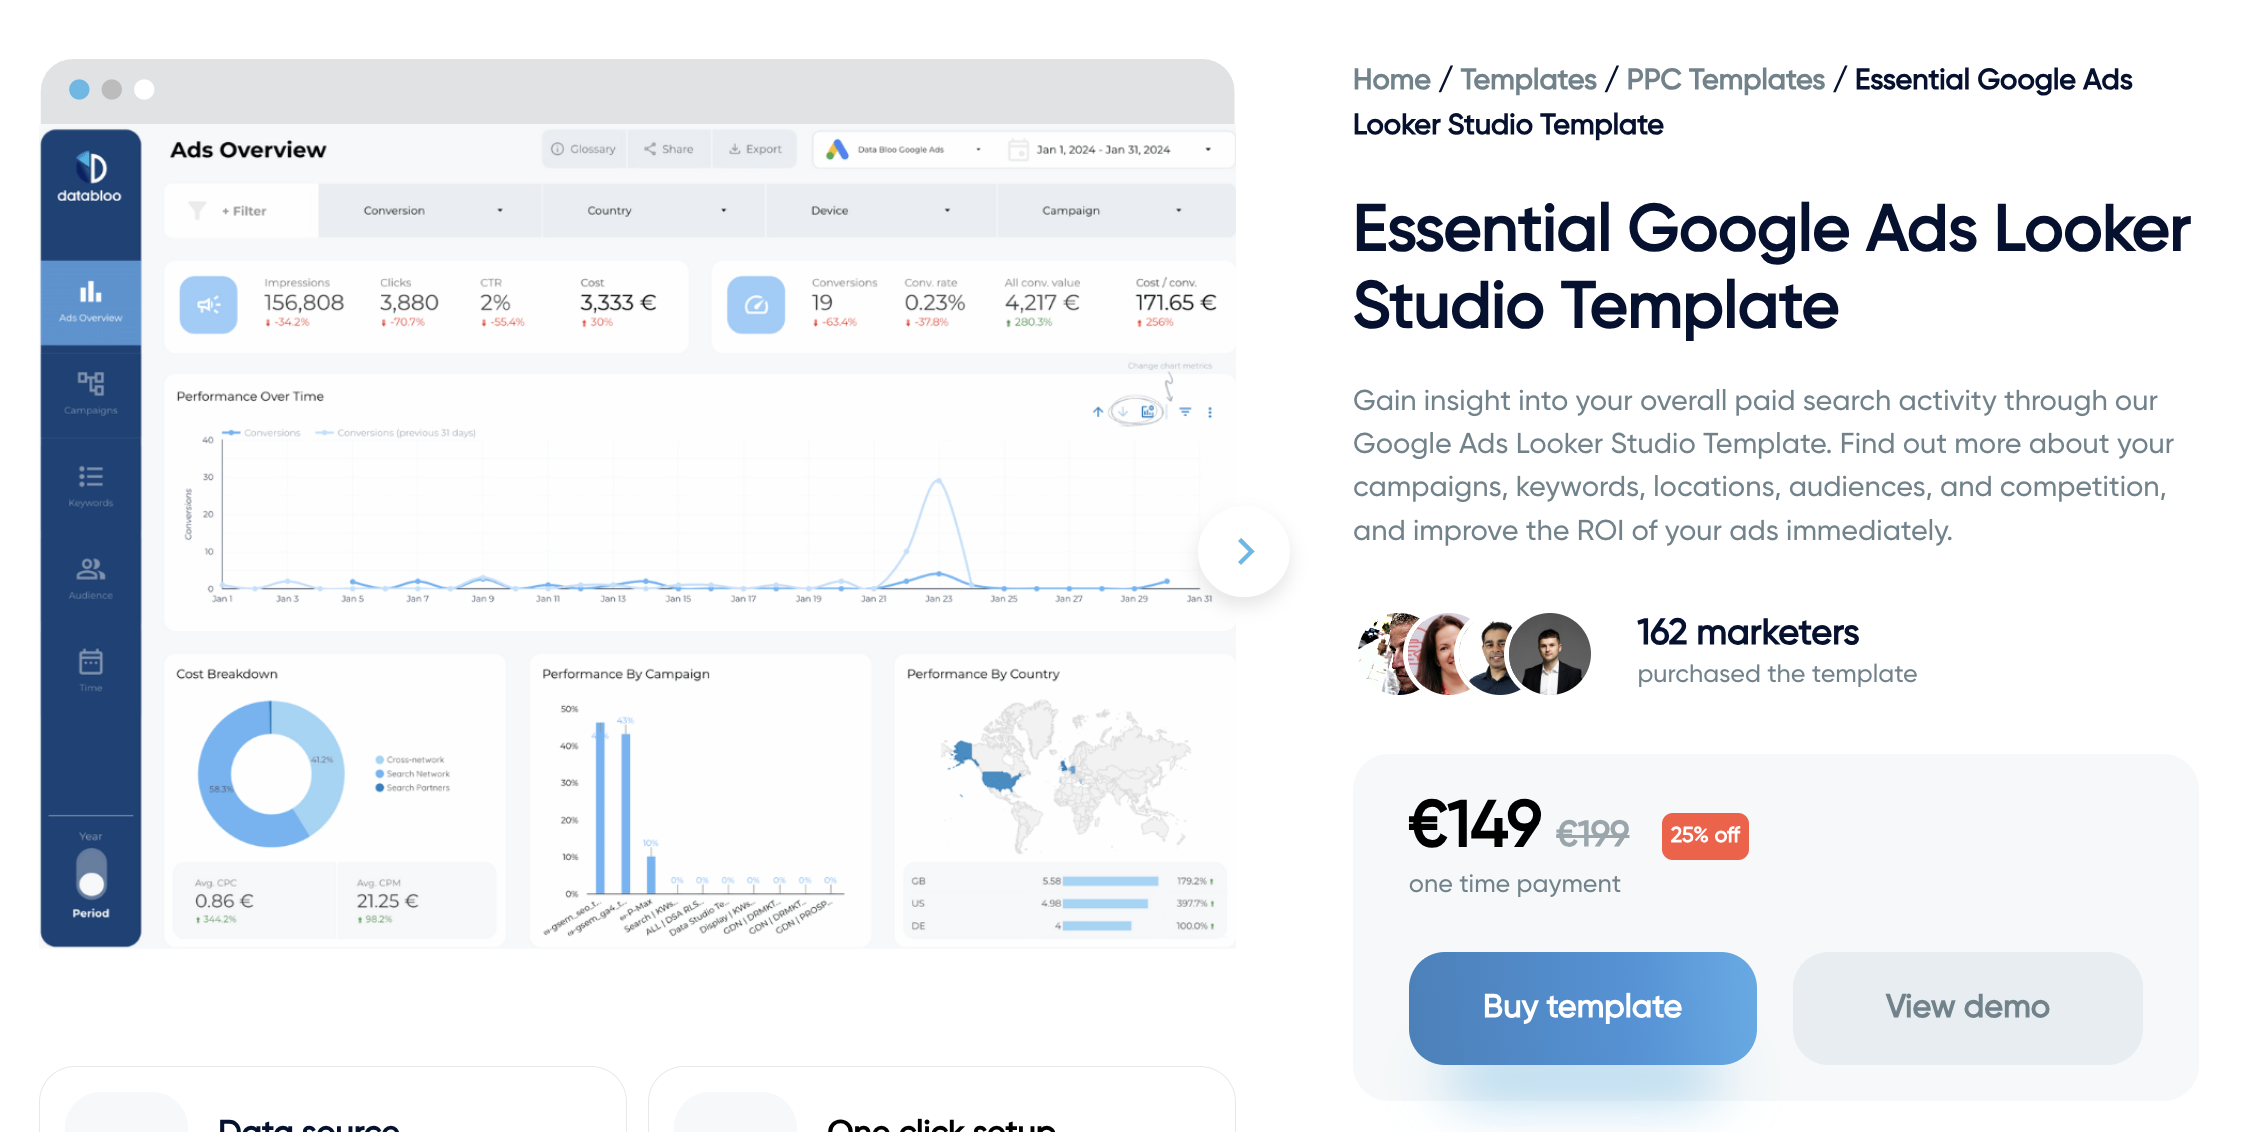 This is just another downside of Looker Studio—with it, you’ll always have to open up your pocket if you want something—even if it’s very basic.
Want to visualize non-Google data? You need to pay for third-party connectors.
Want to get a nice-looking report template? You need to pay for it.
Want dedicated customer support? You guessed it.
Compare this to Whatagraph, where ALL of this is included in your base price.
✅ 55+ native integrations with marketing platforms
✅ 100+ ready-made report templates
✅ Unlimited data blends, custom metrics, and dimensions
✅ Unlimited dashboards and reports
✅ Dedicated Customer Success Manager and live-chat support
✅ AI features like AI chatbot, summary writer, report generator
This means you don’t need to bother with a million different invoices and tools—you just get one and you’re all set.
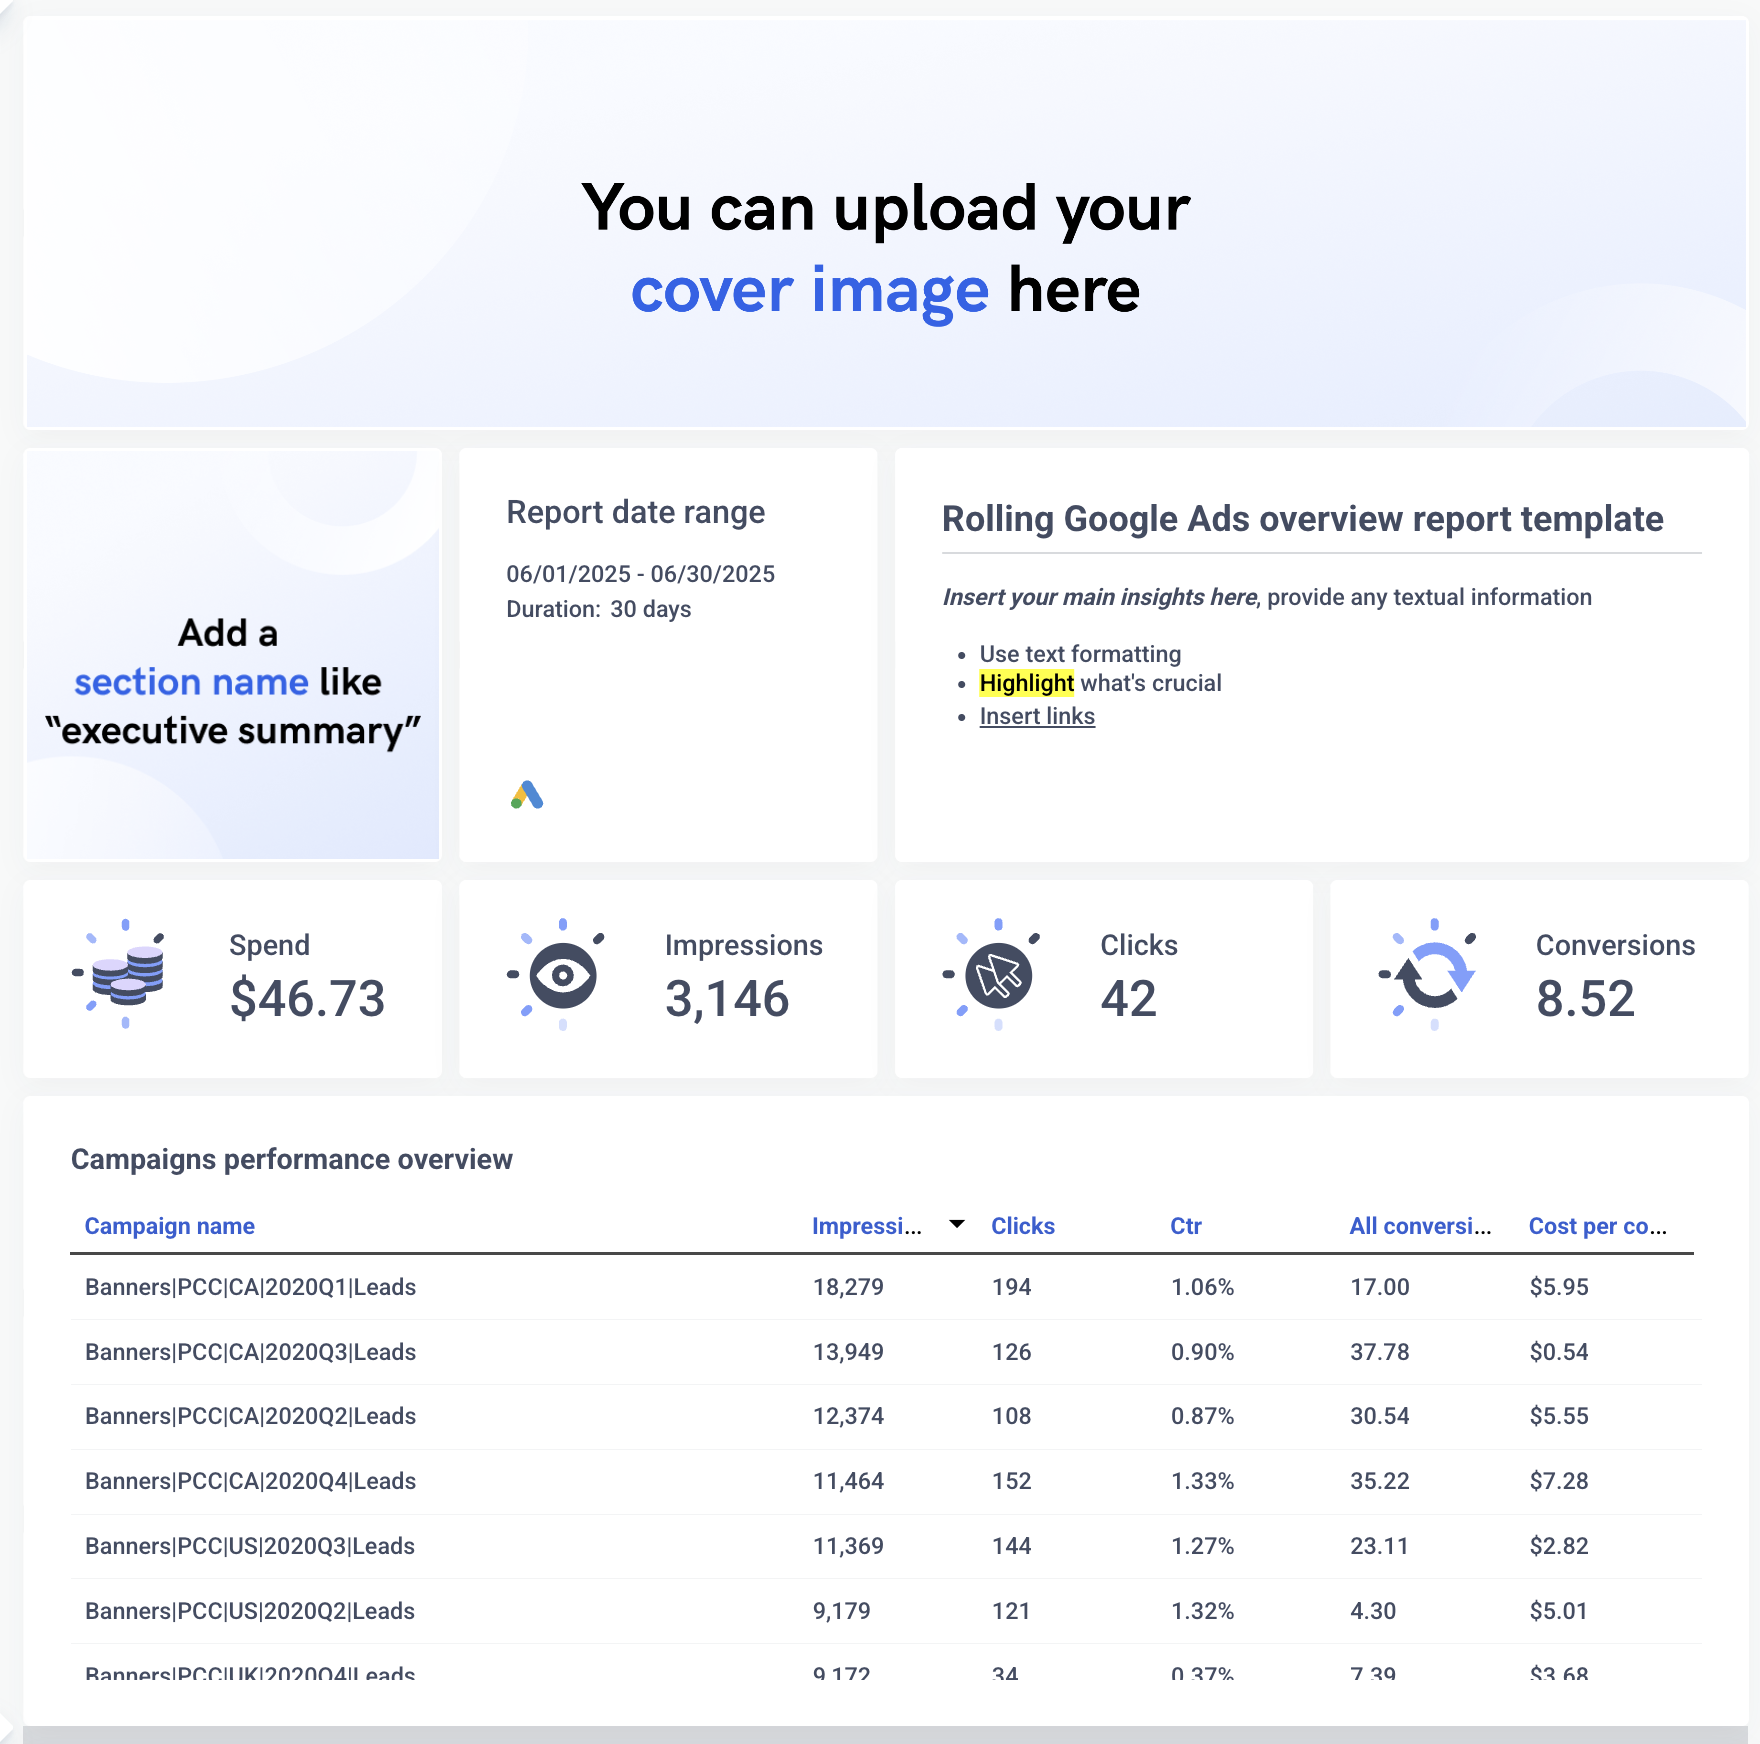
That being said, here’s what Whatagraph’s Google Ads report template looks like. It starts off with:
- The cover image you want for your report (e.g. your client’s logo)
- Executive summary section
- Summary of key metrics
- Campaign performance overview
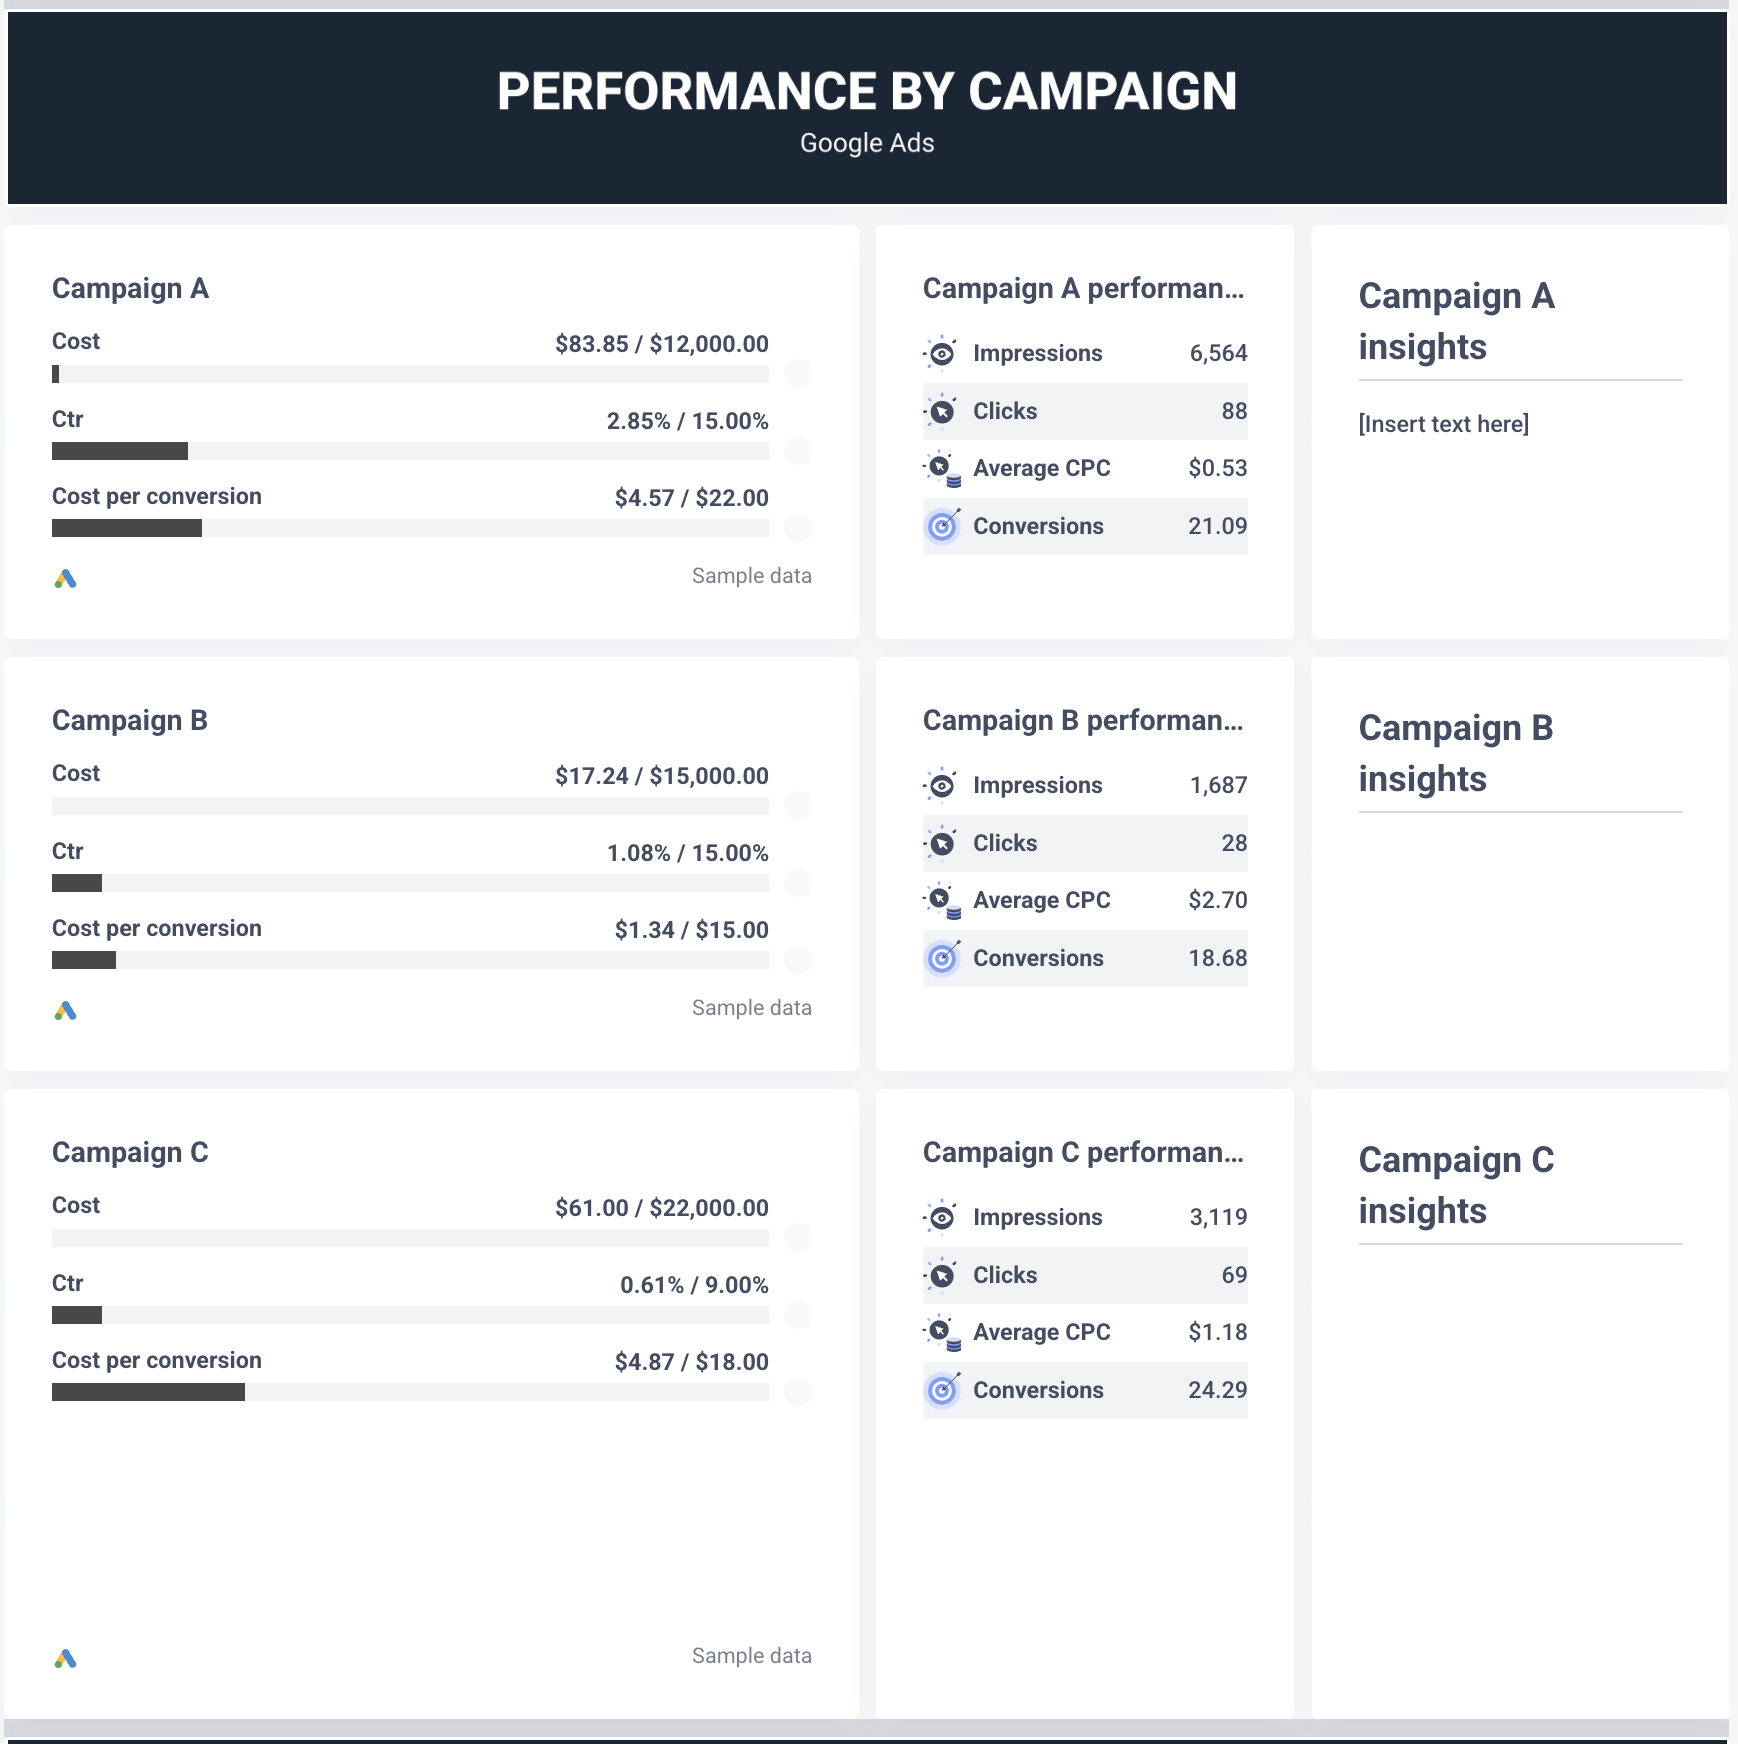
 On the next page, it breaks down campaign performance, with:
- Goal pacing
- Summary of key metrics
- Actionable insights for each campaign
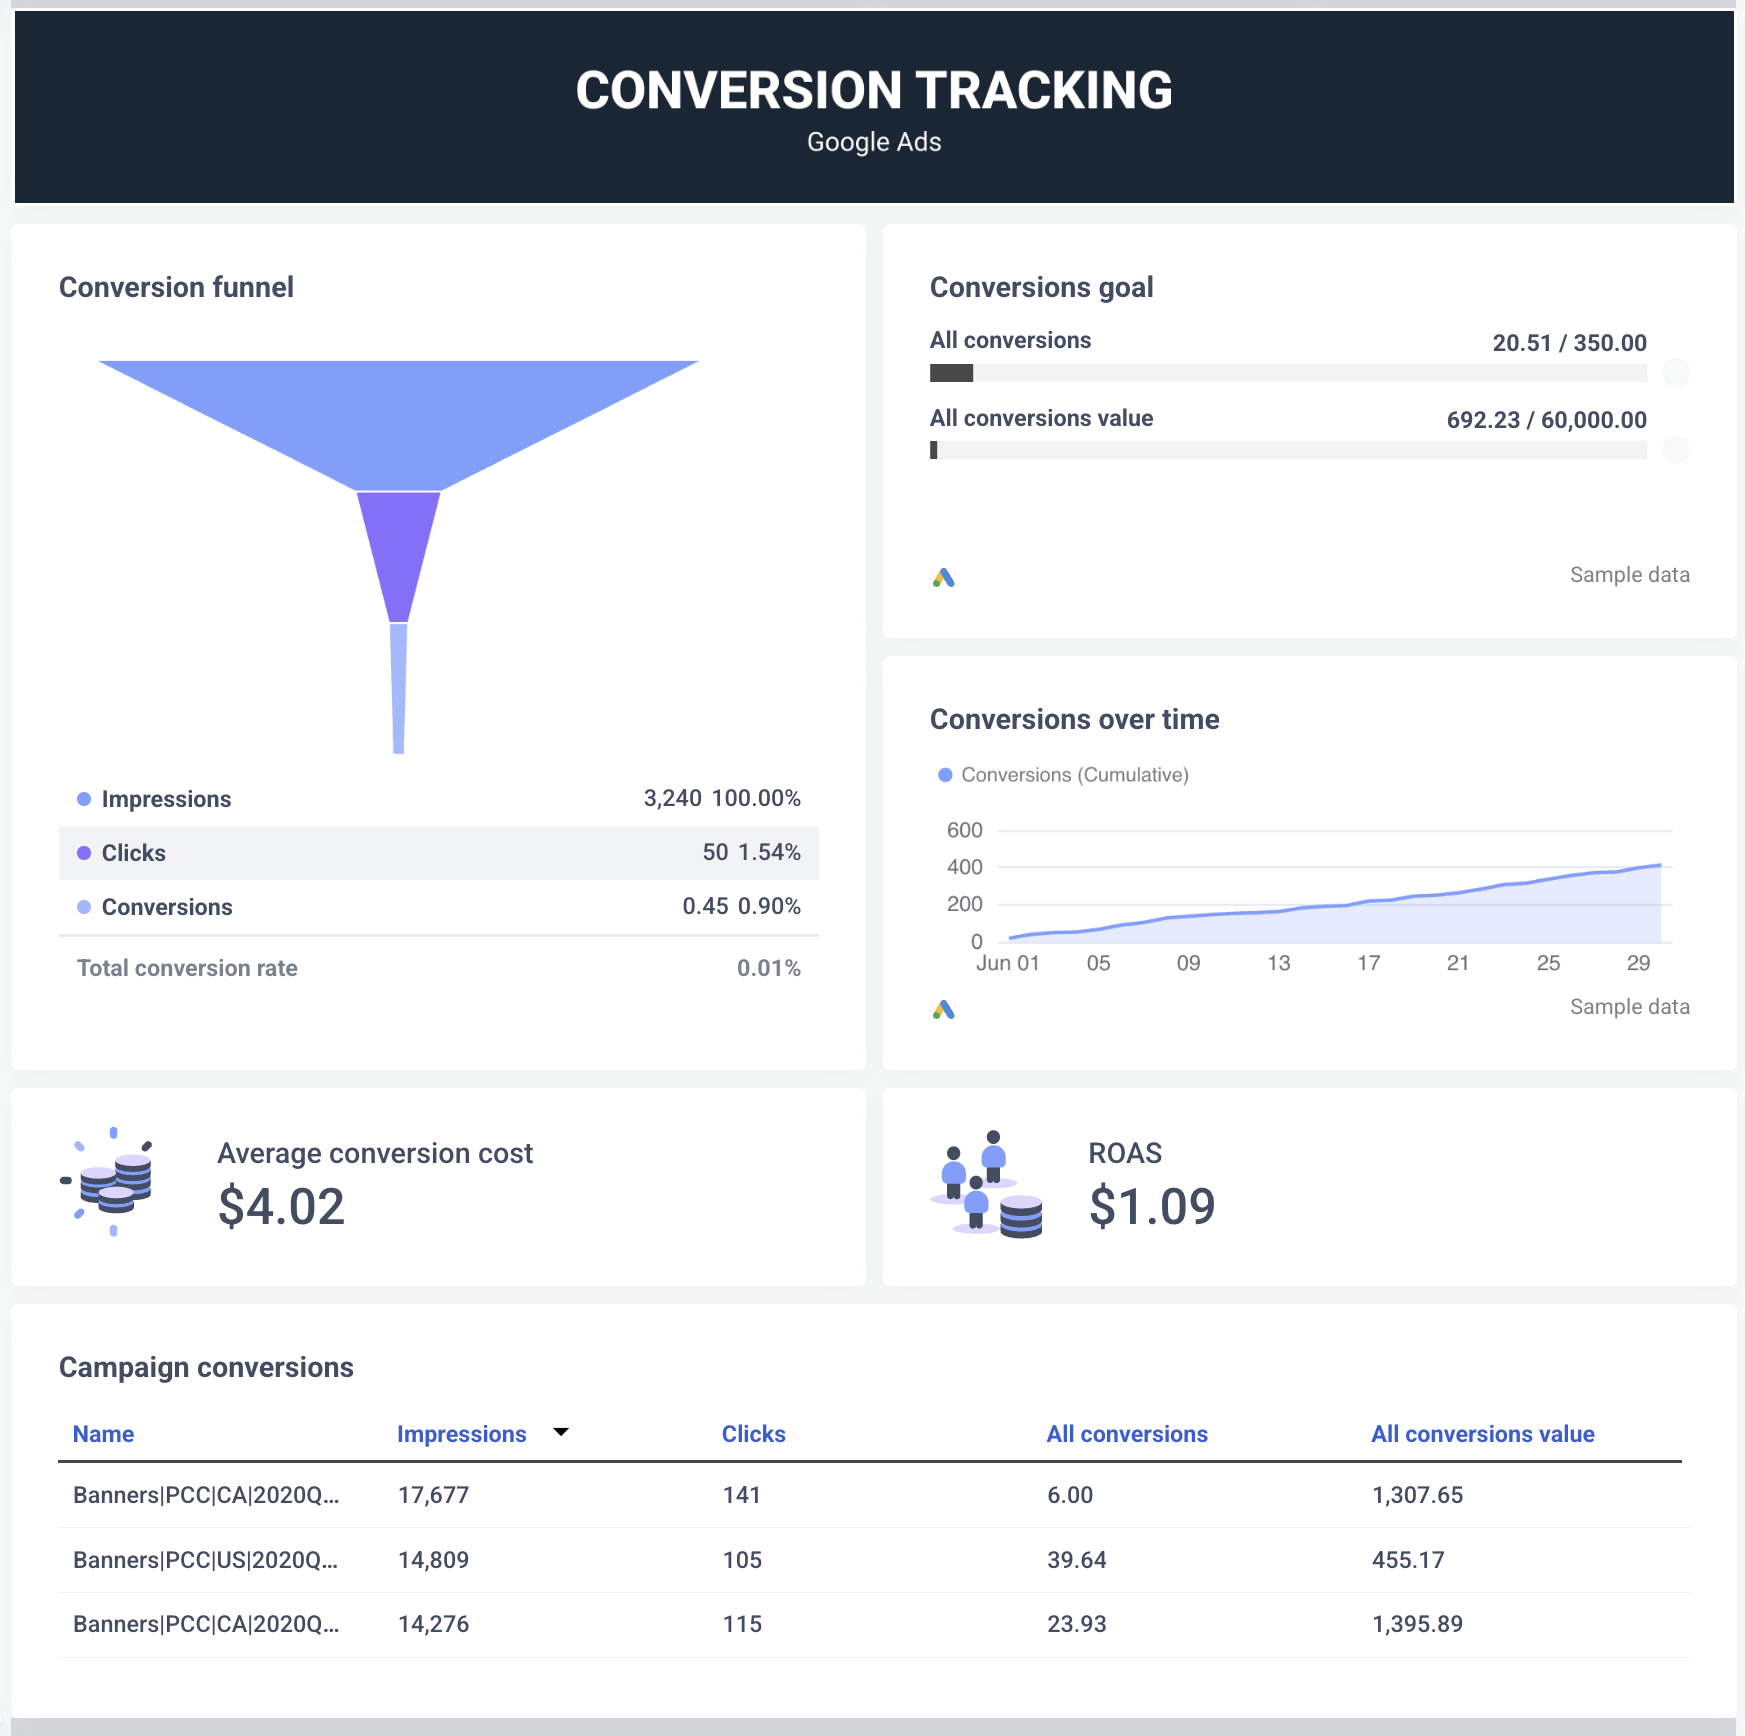
 On the third page, you’ll also get conversion tracking and see exactly how your Google Ads campaigns trickle down into conversions, what’s the average CPCV and ROAS.
3. Google Display and Video 360 report template
The previous template was a paid one, but this time we picked a free DV360 report template from Looker Studio itself.
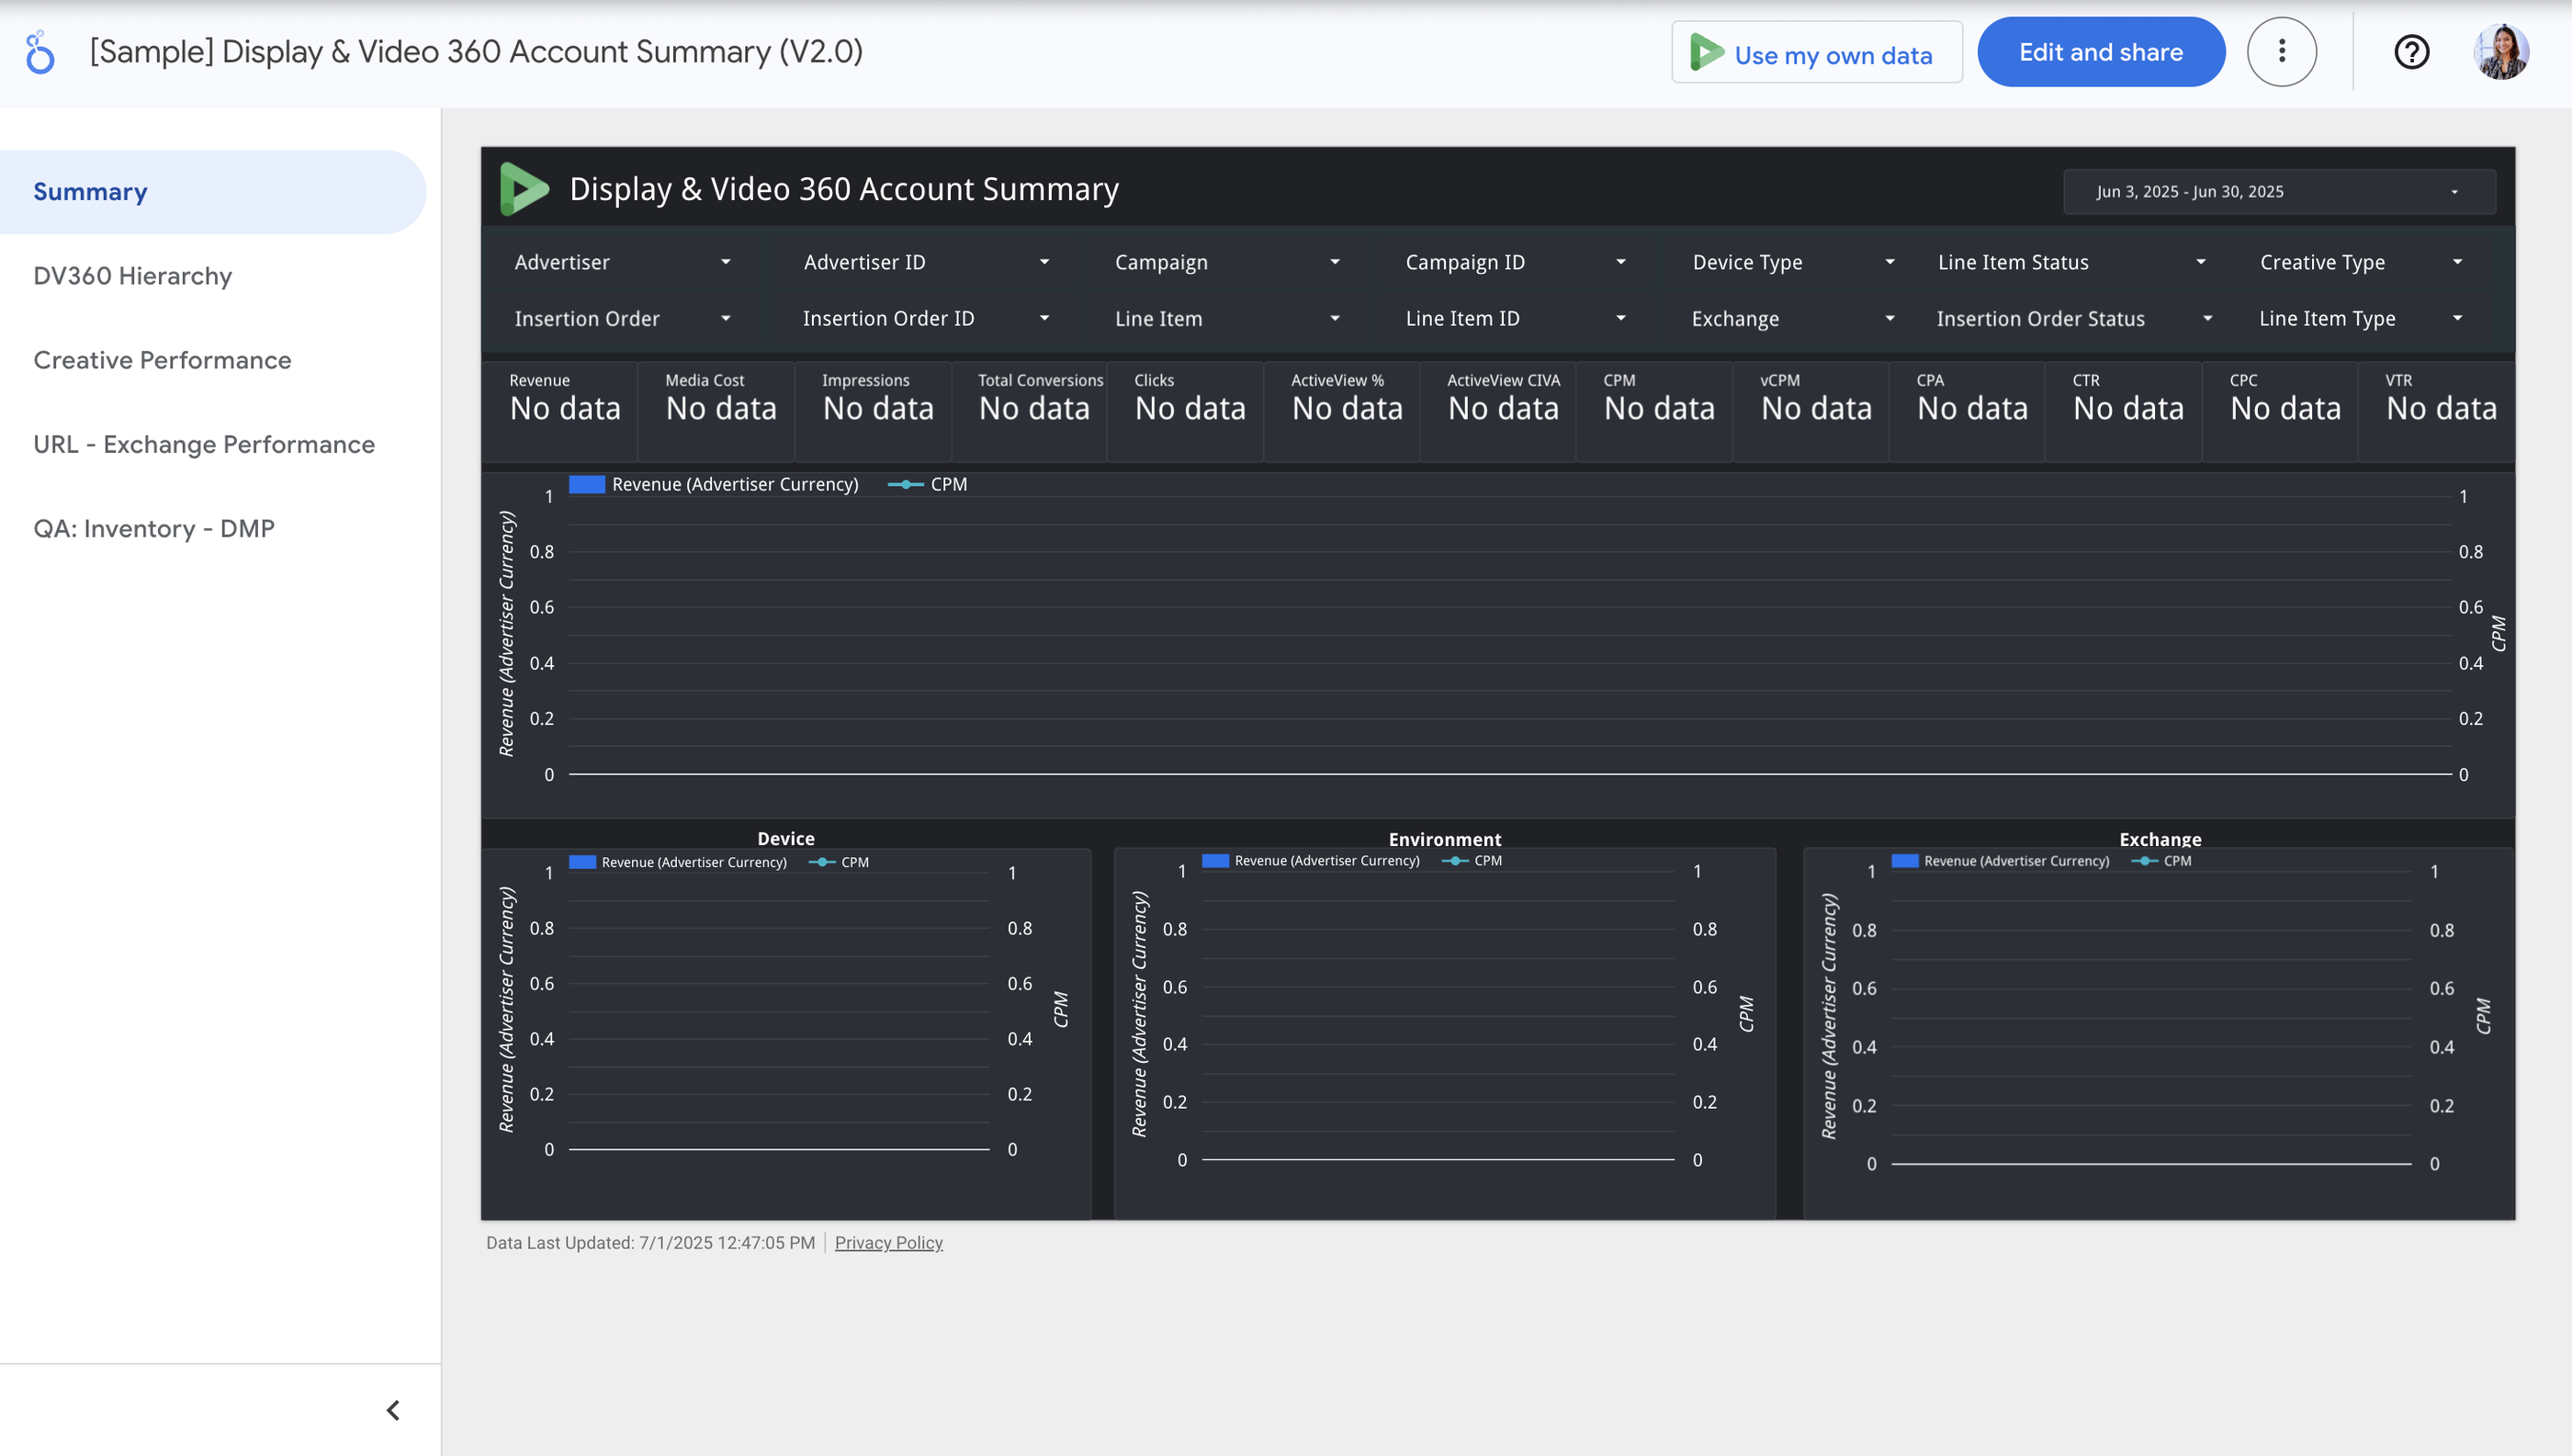 Unfortunately though, we can’t say anything good about this template other than that it’s free and gets the job done.
You get five different pages—a summary, hierarchy, creative performance, URL performance, and inventory—giving a comprehensive view of your DV360 campaigns.
But you’ll notice that the color is dull, the font is meh, and the charts look clunky and outdated.
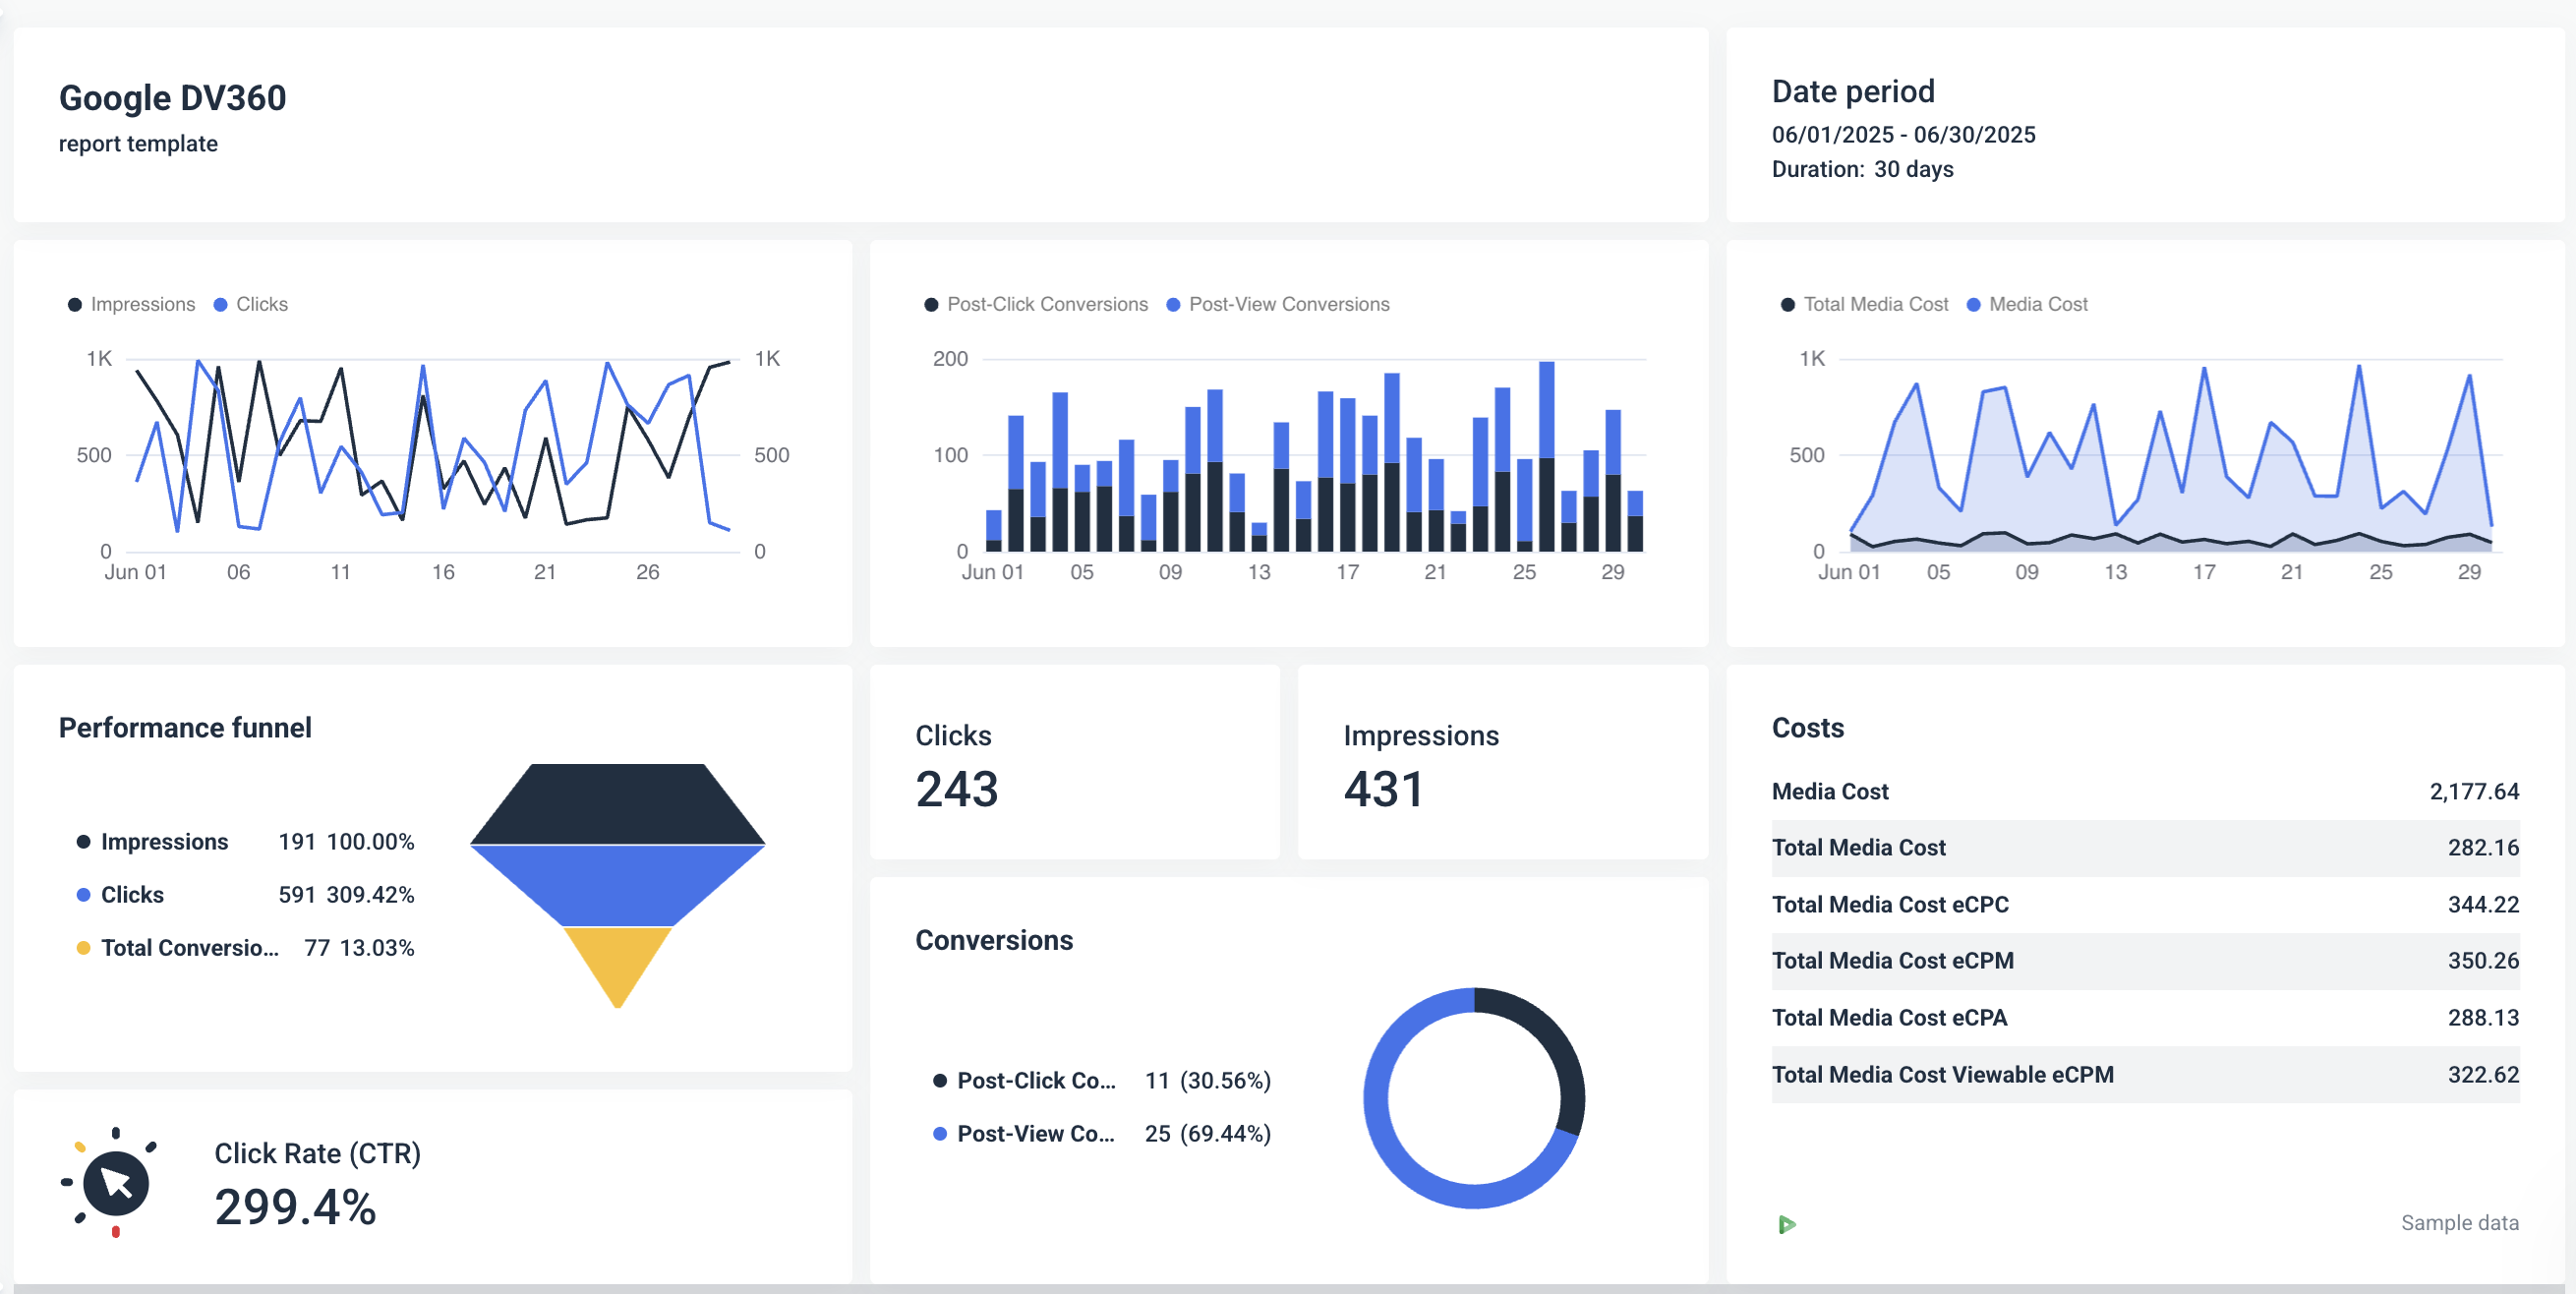
Compare that to Whatagraph’s vibrant, sleek, and structured Google Display and Video 360 dashboard.
 You get:
✅ Clear, logical sections: Overview, campaigns, audiences, creatives, and placements, so you can find what you need fast.
✅ Clean, vibrant visuals: Uses color intentionally to highlight trends without overwhelming clients.
✅ Interactive chart variety: Time-series graphs, performance funnels, geo maps, and pie charts for intuitive exploration.
✅ Consistent, modern design: Crisp fonts, clear icons, and engaging visuals make reports client-ready by default.
✅ No manual maintenance: Skip rebuilding widgets or fixing connectors—Whatagraph pulls DV360 data automatically.
3. LinkedIn Ads dashboard template
For the next PPC channel, we chose Coupler.io’s LinkedIn Ads dashboard template.
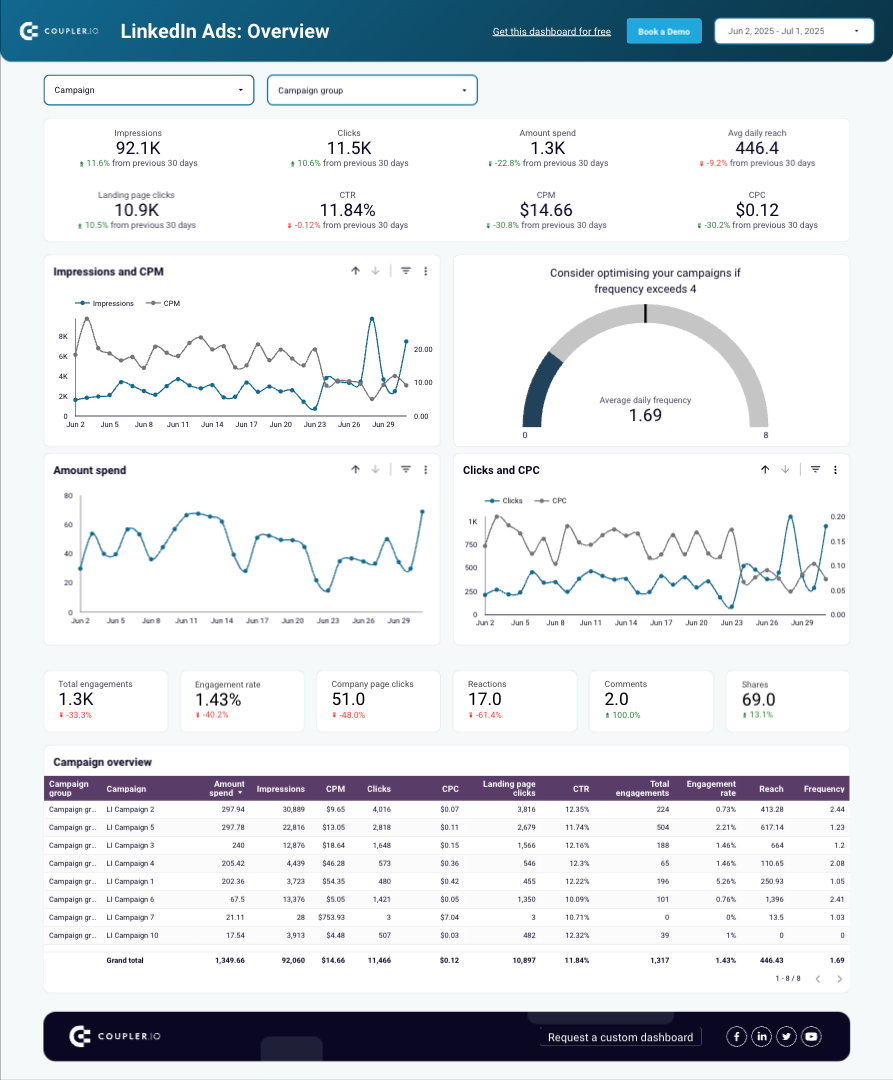
The template includes two pages:
- Overview: This breaks down your data into clear sections—overview metrics, trends for impressions, clicks, CPC, CPM, and a detailed campaign table—so you can easily see what’s working and what needs attention.
- Conversions and leads: This page gives you a focused snapshot of how your LinkedIn Ads are driving conversions and leads—and it’s our favorite part about this template.
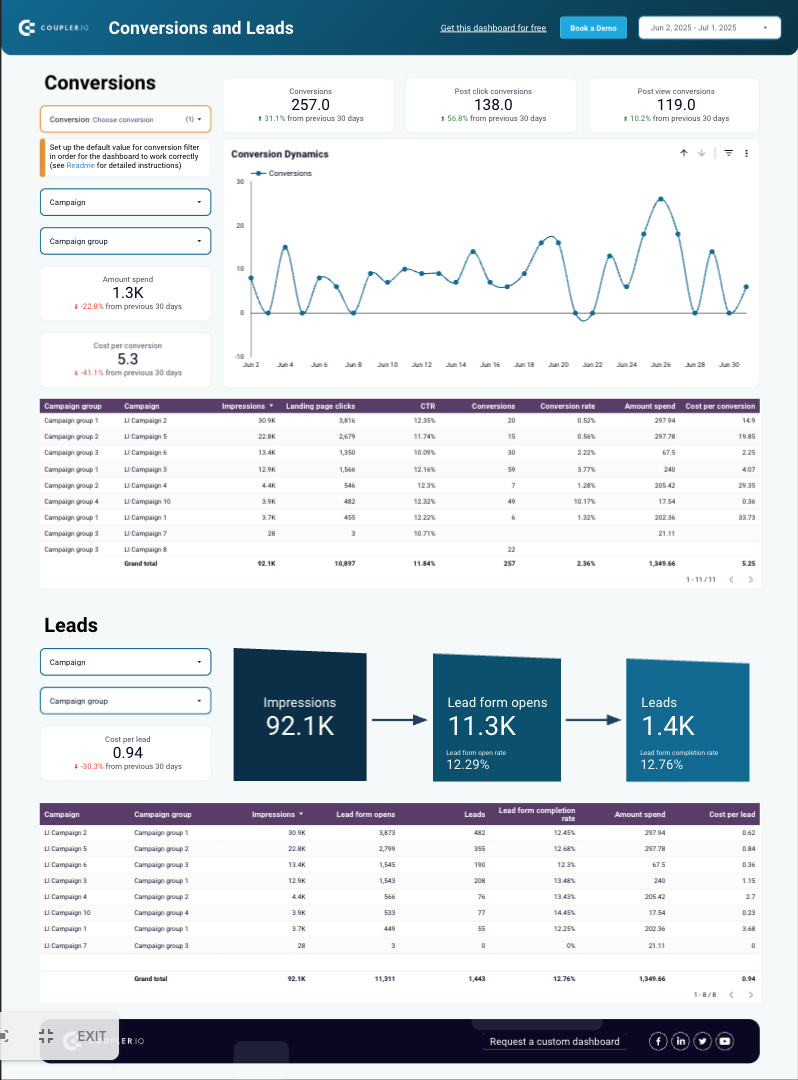
At the top, you get key metrics including total conversions, post-click conversions, post-view conversions, spend, and cost per conversion, with clear indicators showing changes from the previous 30 days.
And a clean time-series chart shows conversion trends over the month, helping you spot peaks, dips, and performance patterns at a glance.
Our favorite thing about this page is the simple funnel visualization at the end that shows the journey from impressions → lead form opens → leads. This clearly makes the connection between a vanity metric (impressions) and actual business results (leads).
But here’s what’s missing from this template:
❌ Performance breakdown by specific ads
❌ Customization elements (logos, section headers, images, icons, etc.)
❌ Goal pacing to show whether you’ve reached the goals—or how far you still need to go to reach the goals you set with your clients or other stakeholders
This is exactly what Whatagraph’s LinkedIn Ads dashboard covers.
You get:
✅ Performance breakdown by specific ads: You can see top-performing campaigns and paid posts at a glance, with impressions, clicks, and post-click conversions for each, making it easy to identify winning creatives and optimize underperformers.
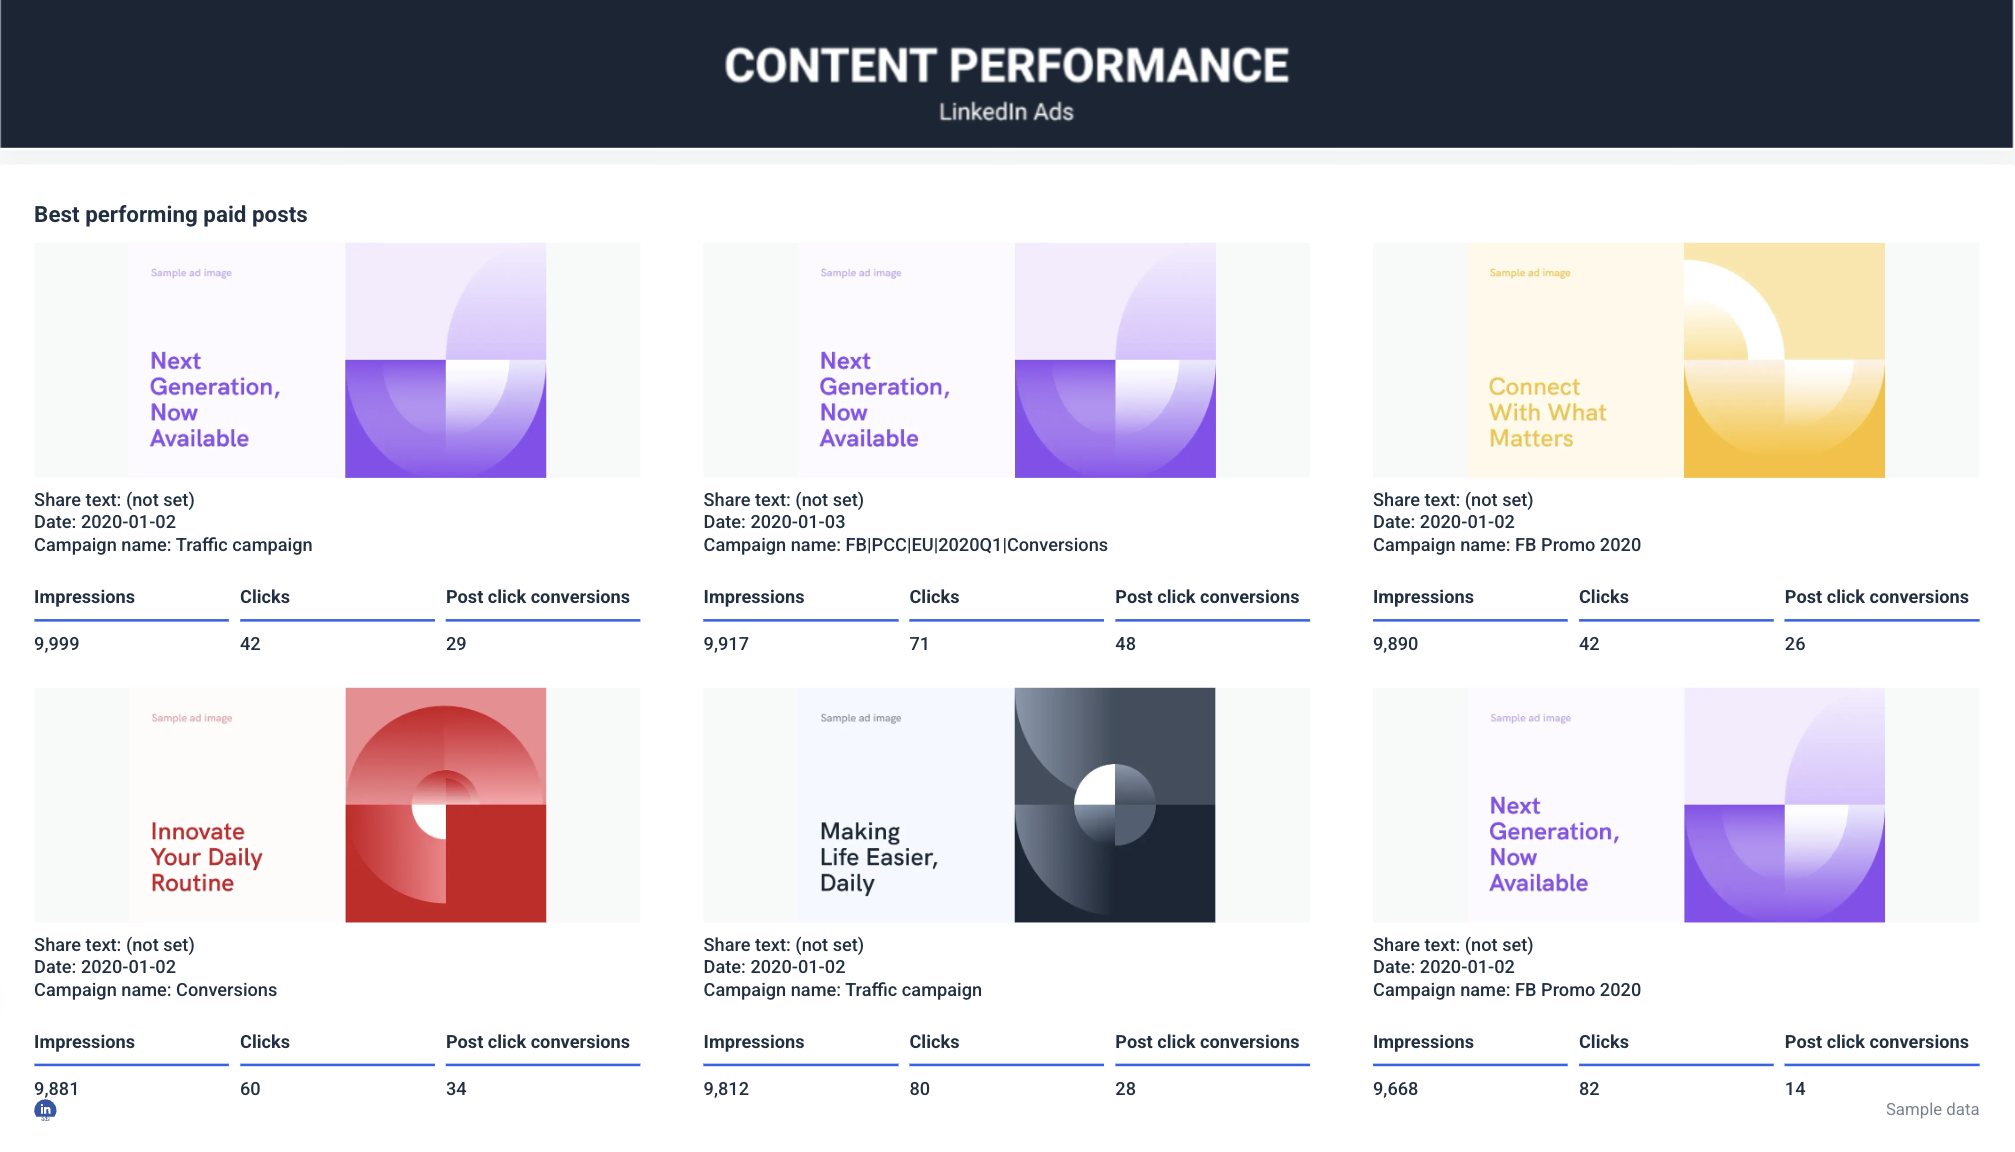 ✅ Customization elements: Add your agency’s logo, adjust section headers, and insert images and icons to align the dashboard with your brand or your client’s style—no design compromises.
✅ Goal pacing: Our built-in goal tracking shows your spend, CPC, CPL, and daily budgets against targets in real time, so you know exactly how close you are to hitting client or stakeholder goals and where adjustments are needed.
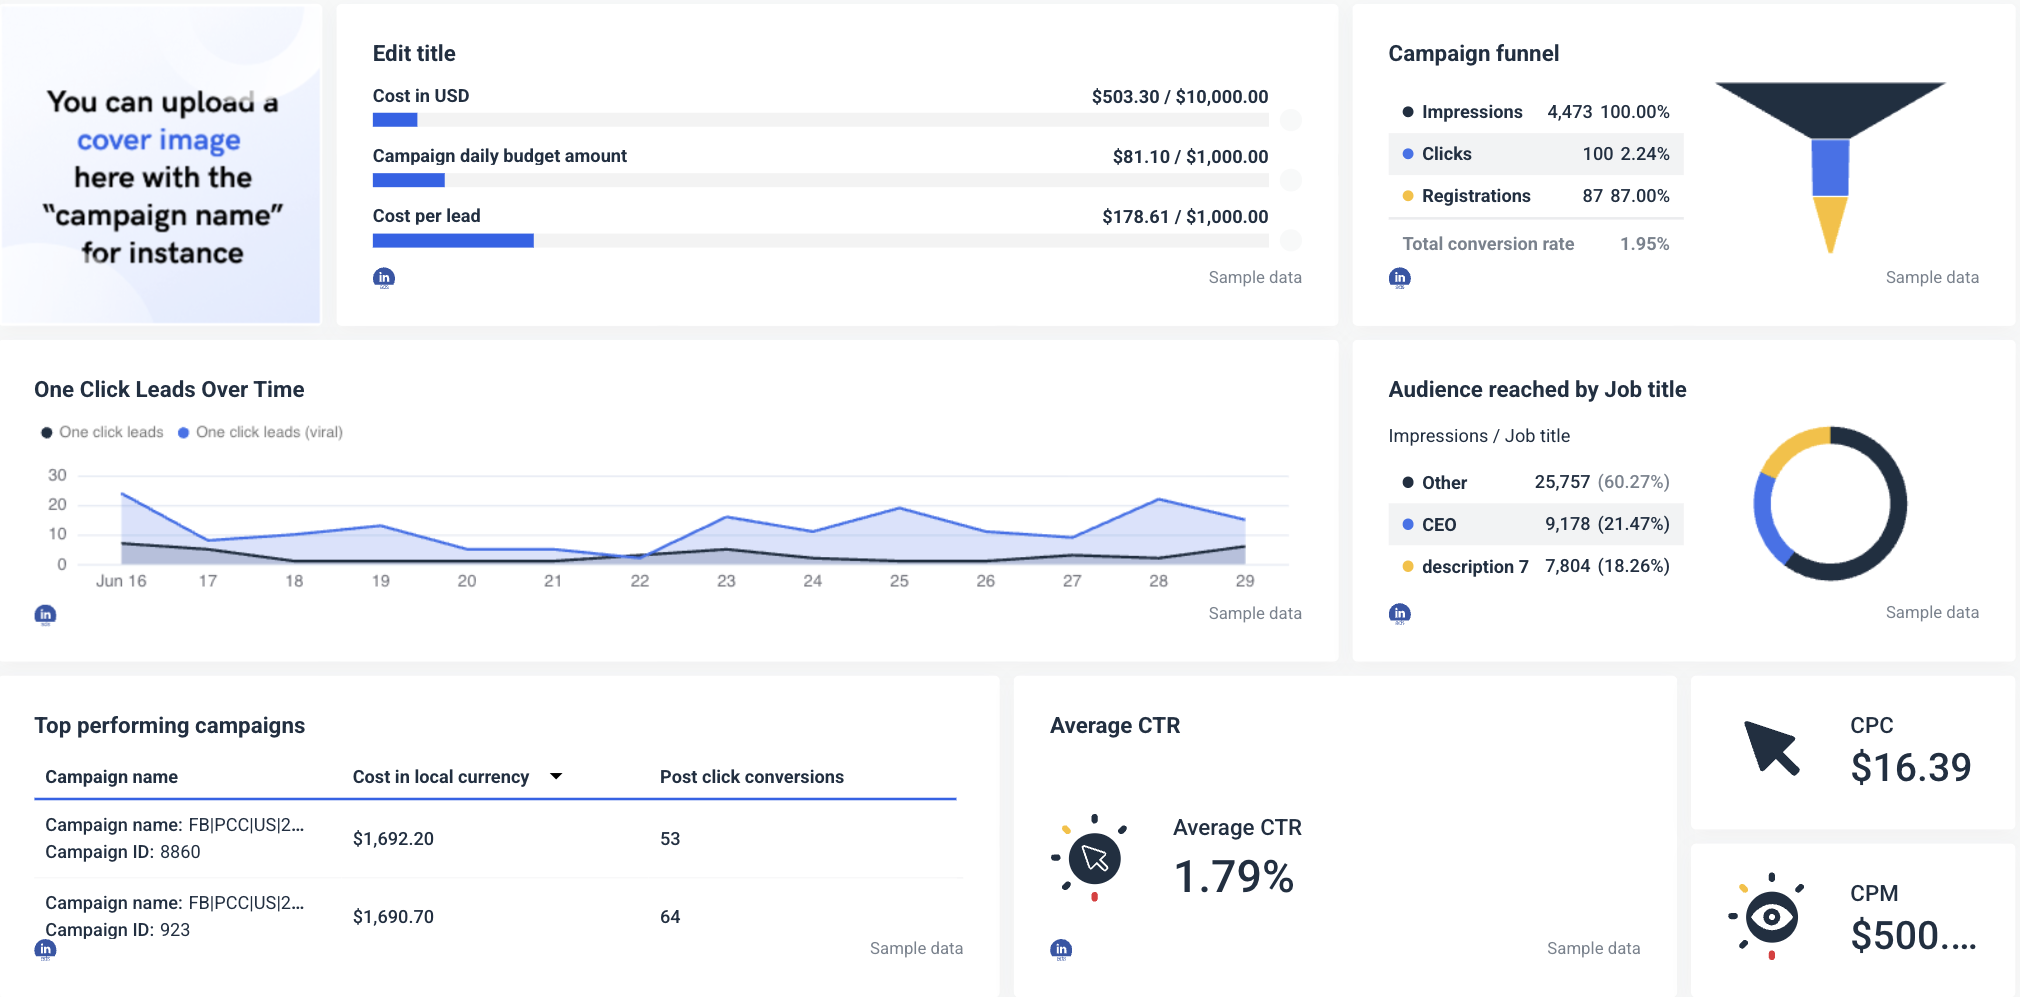 In short, Whatagraph doesn’t just report LinkedIn Ads data—it helps you track performance, showcase your agency’s brand, and demonstrate progress toward goals in a clear, client-friendly way.
4. Facebook Ads dashboard template
For this one, again, we chose Coupler.io’s Facebook Ads dashboard template.
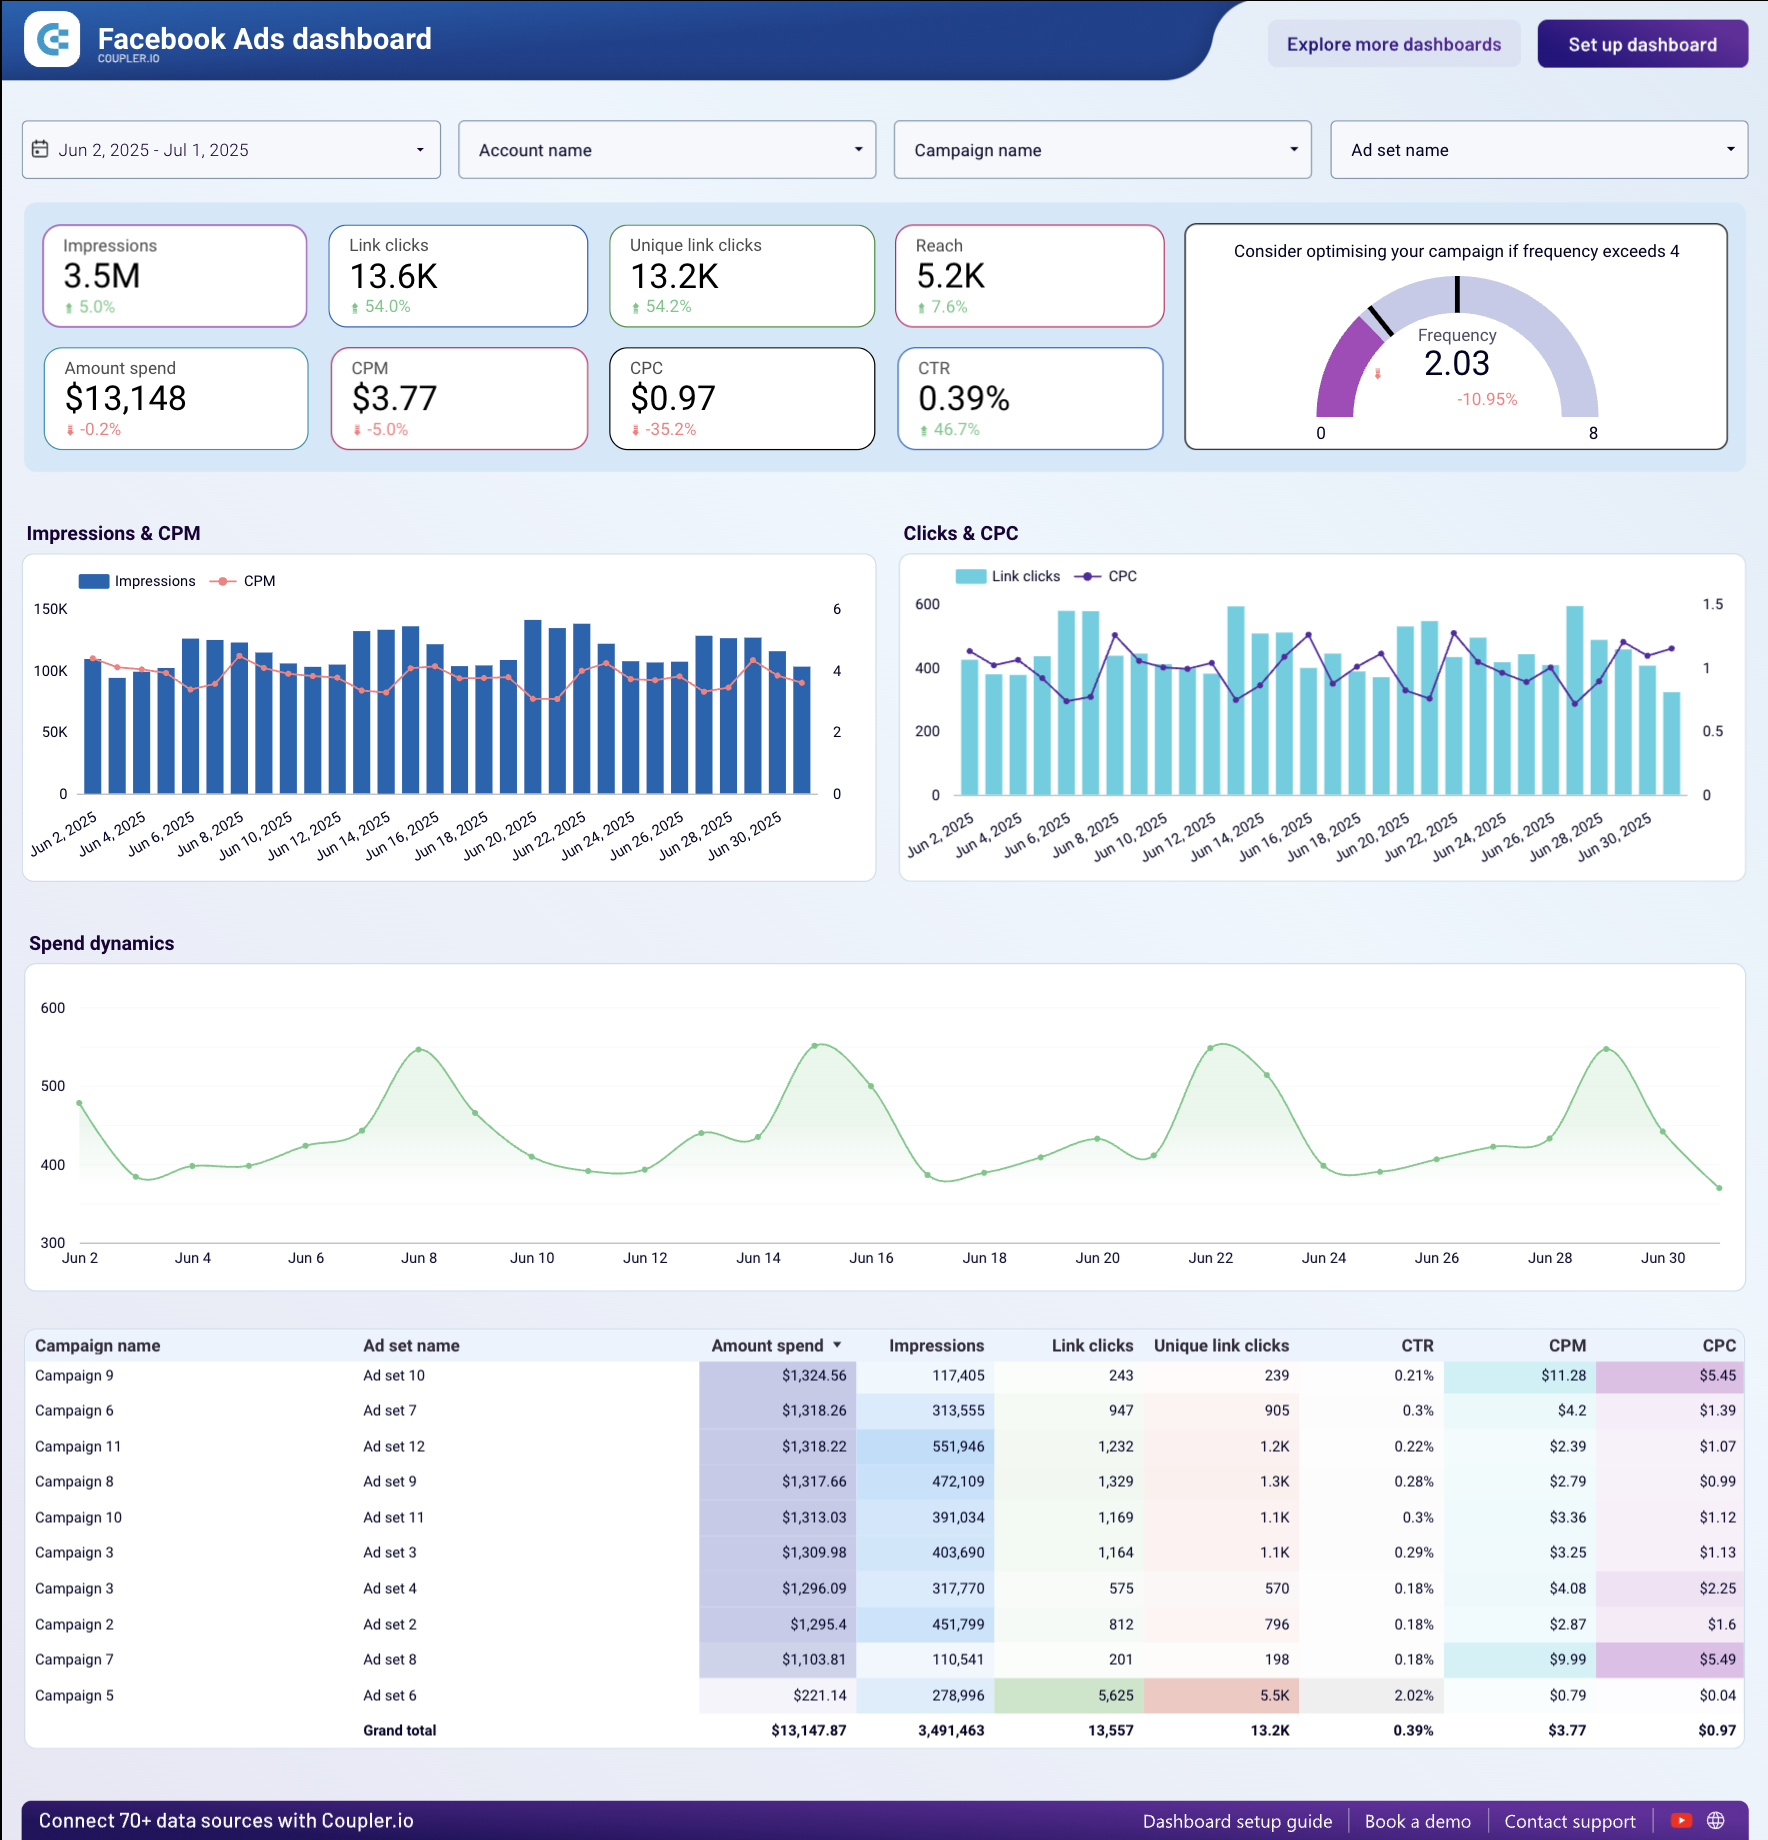
This template is divided into two pages:
- Overview: gives a clear snapshot of Facebook Ads performance with key metrics, trend charts, and a campaign table to see what’s working at a glance.
- Breakdown: dives into clicks by demographics, device, and country, helping you understand who’s engaging with your ads and where.
But again, here’s what’s missing from this template:
❌ Performance summaries and valuable insights
❌ Customization
❌ Best performing Facebook Ads
Whatagraph’s Facebook Ads report template fills this gap. You get:
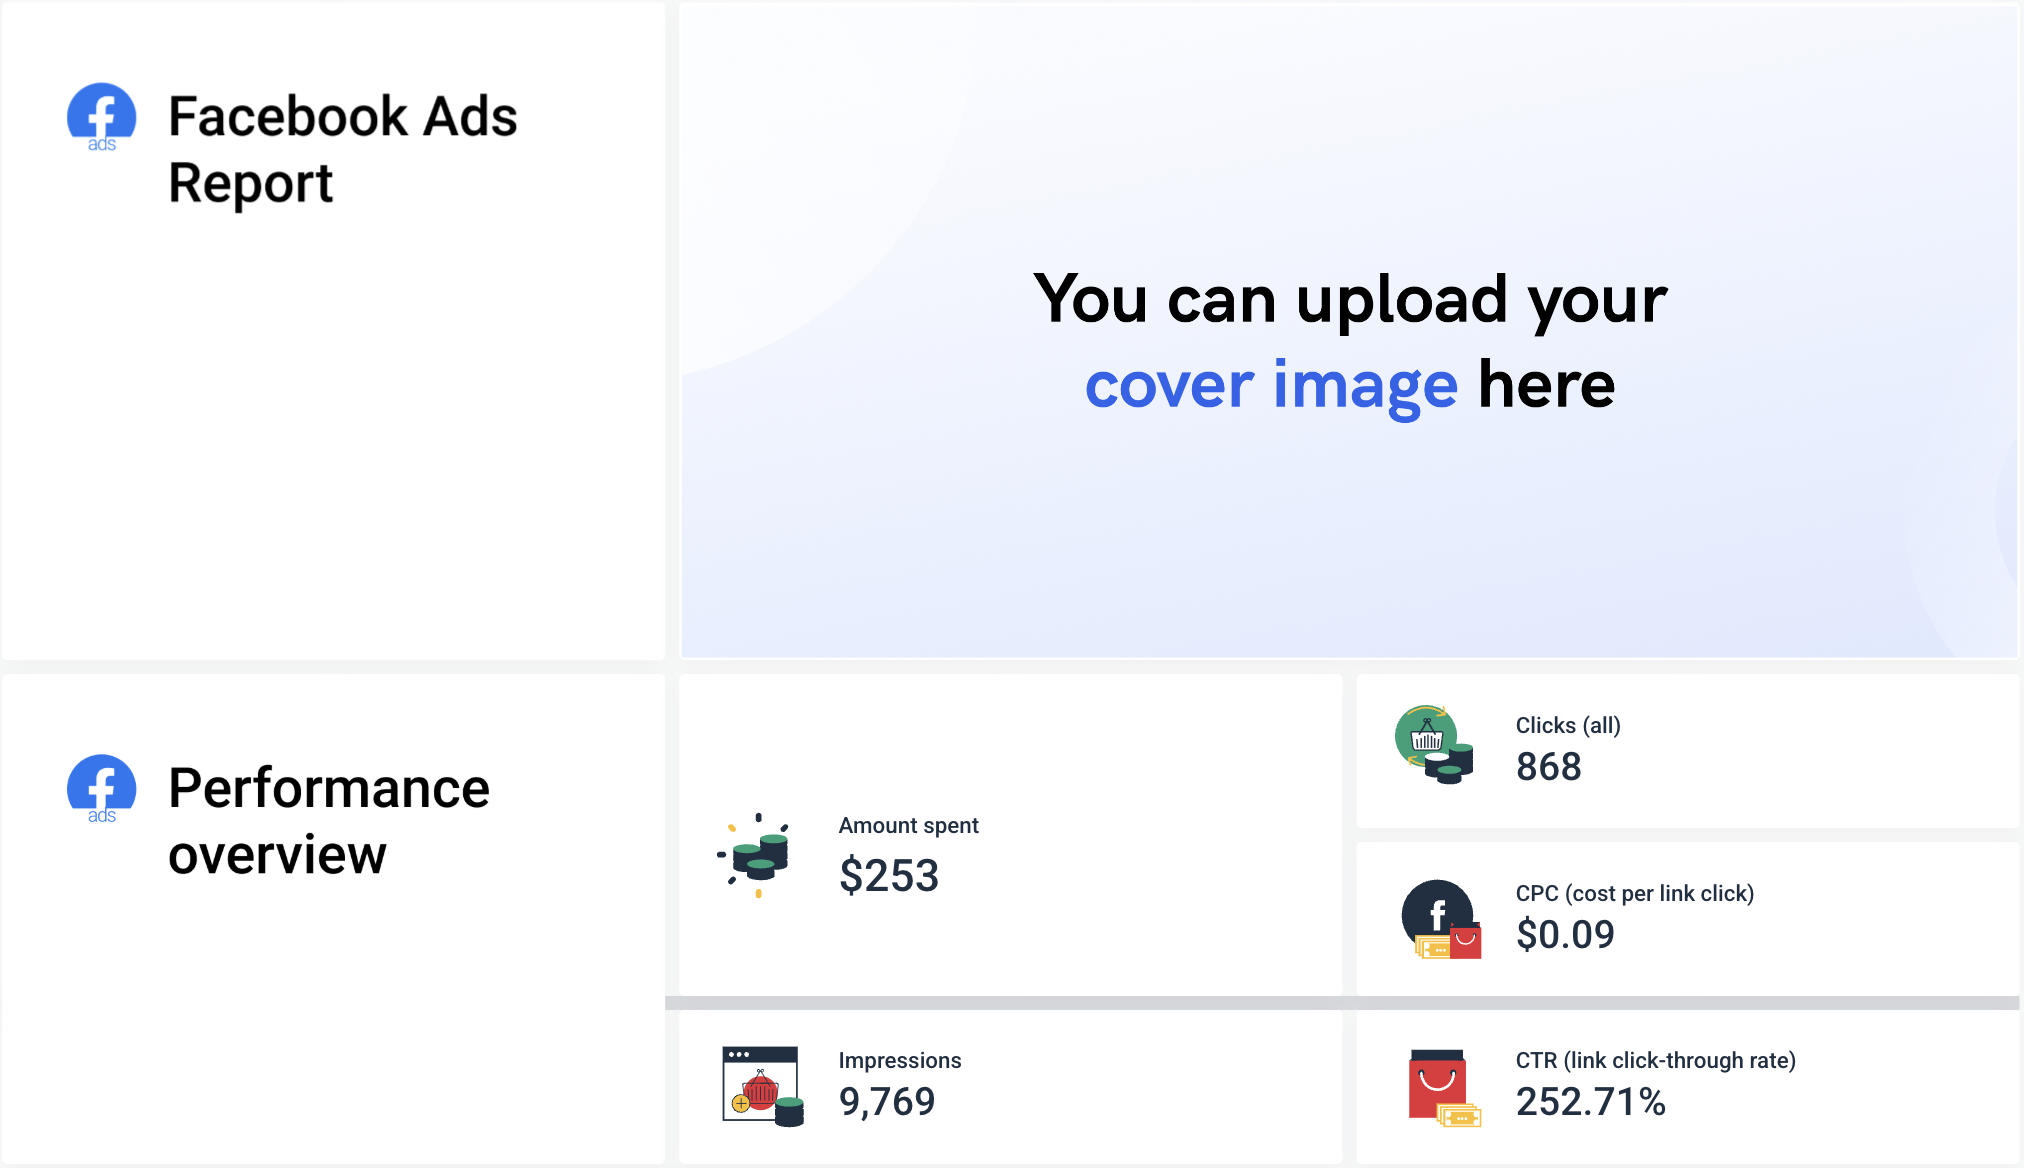
- Monthly overview: At the very top, your clients get a summary of the most important metrics and events for the previous month—or any other period, for that matter. This section includes a brief overview of the monthly KPI goals and the most important metrics, such as total spend, cost-per-click (CPC), and click-through rate (CTR).
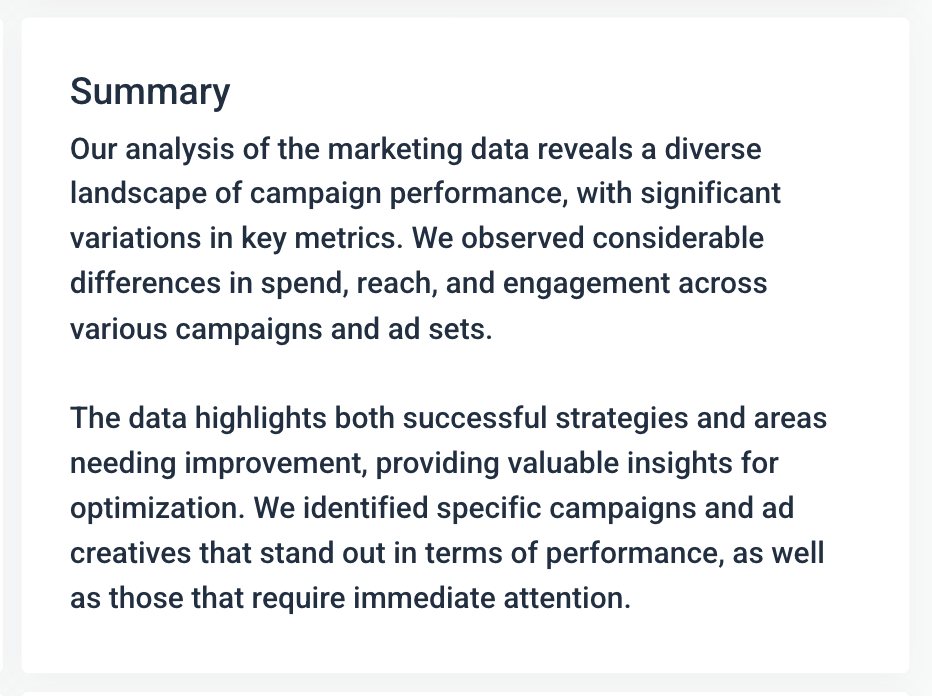
- Actionable insights: Use our AI to write out performance summaries, recommendations, or wins in 18 different languages—and then edit it to your heart’s content before adding to your report.
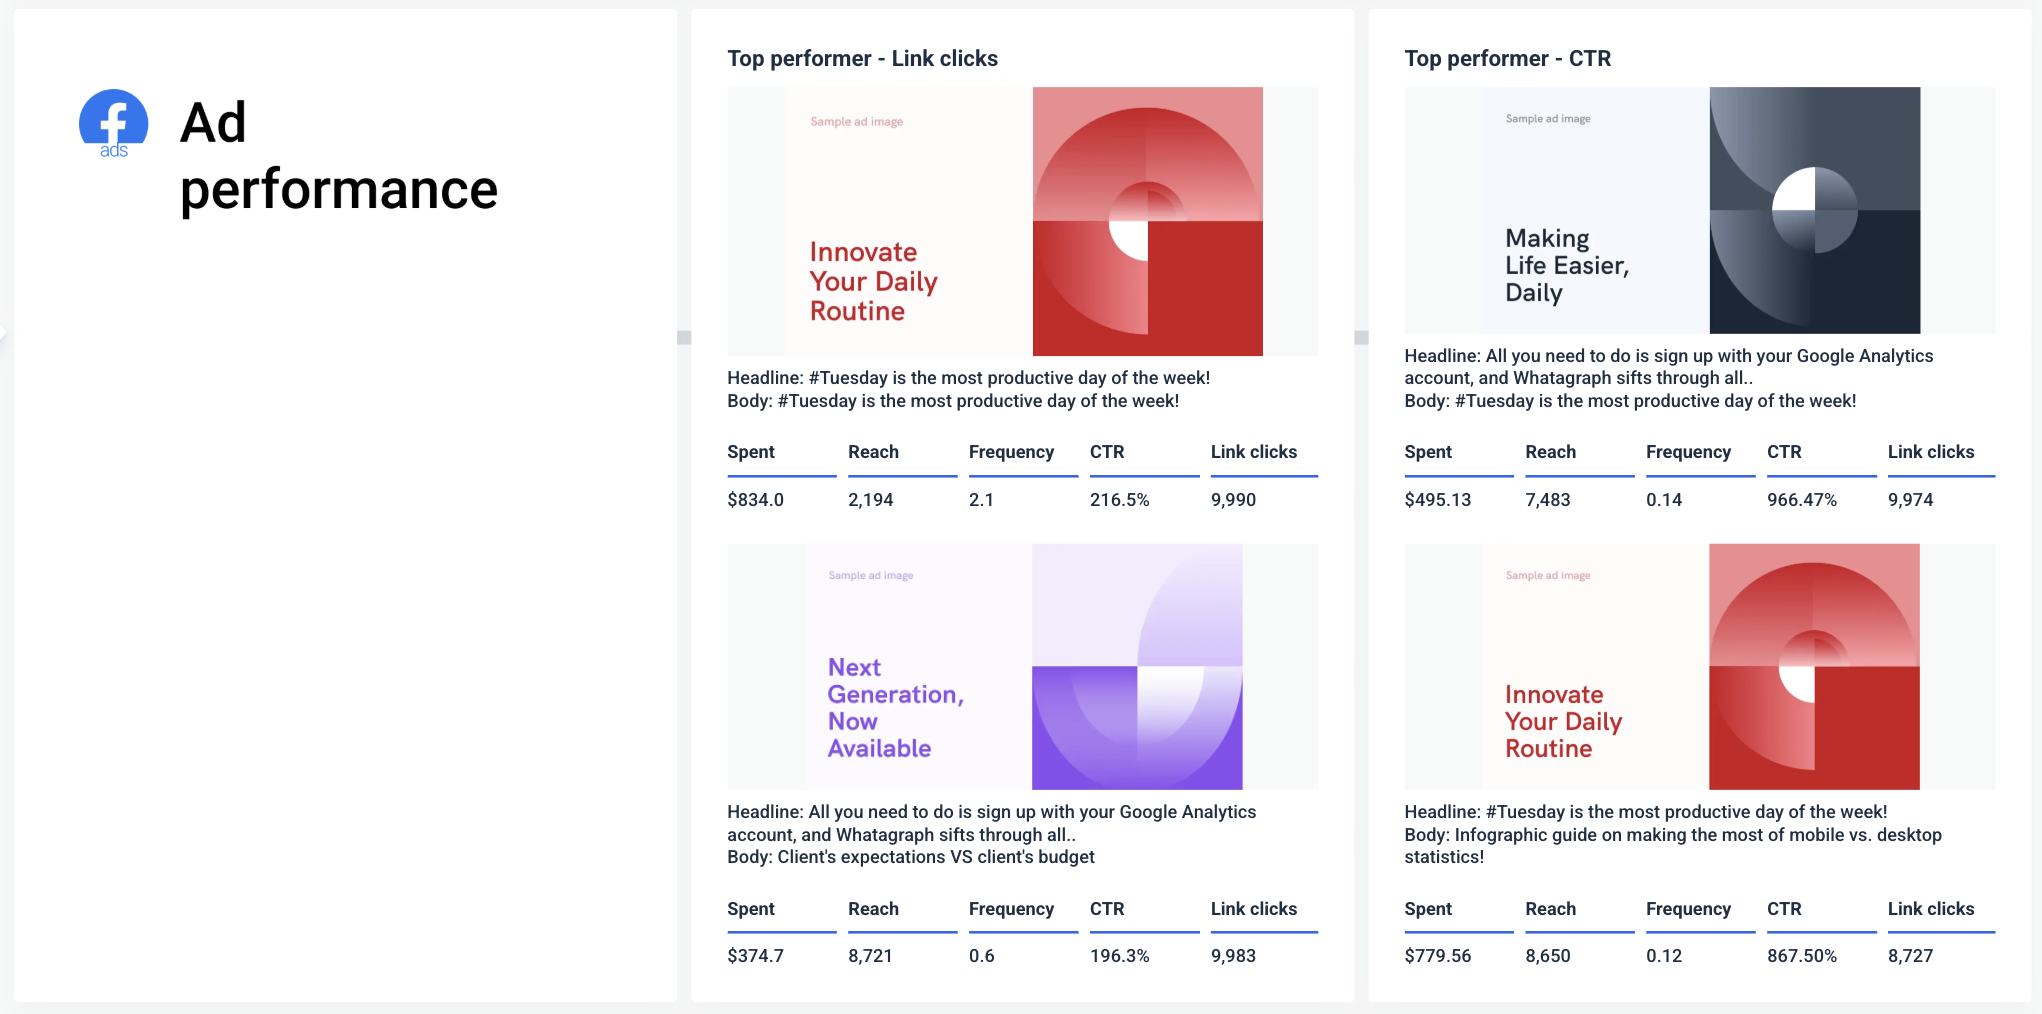
- Ads performance: This is where you can find a breakdown of all your Facebook Ads creatives and the performance metrics for each, such as the number of clicks on each ad, CTR, frequency, reach, and the total amount spent on that ad.
3 Best SEO Dashboard Examples for Looker Studio
Here are the examples of Looker Studio dashboard we’ll cover for SEO:
- Google Analytics 4
- Google Search Console
- Google My Business
5. Google Analytics 4 (GA4) Looker Studio Template
For this, we picked Supermetrics’ Looker Studio GA4 template.
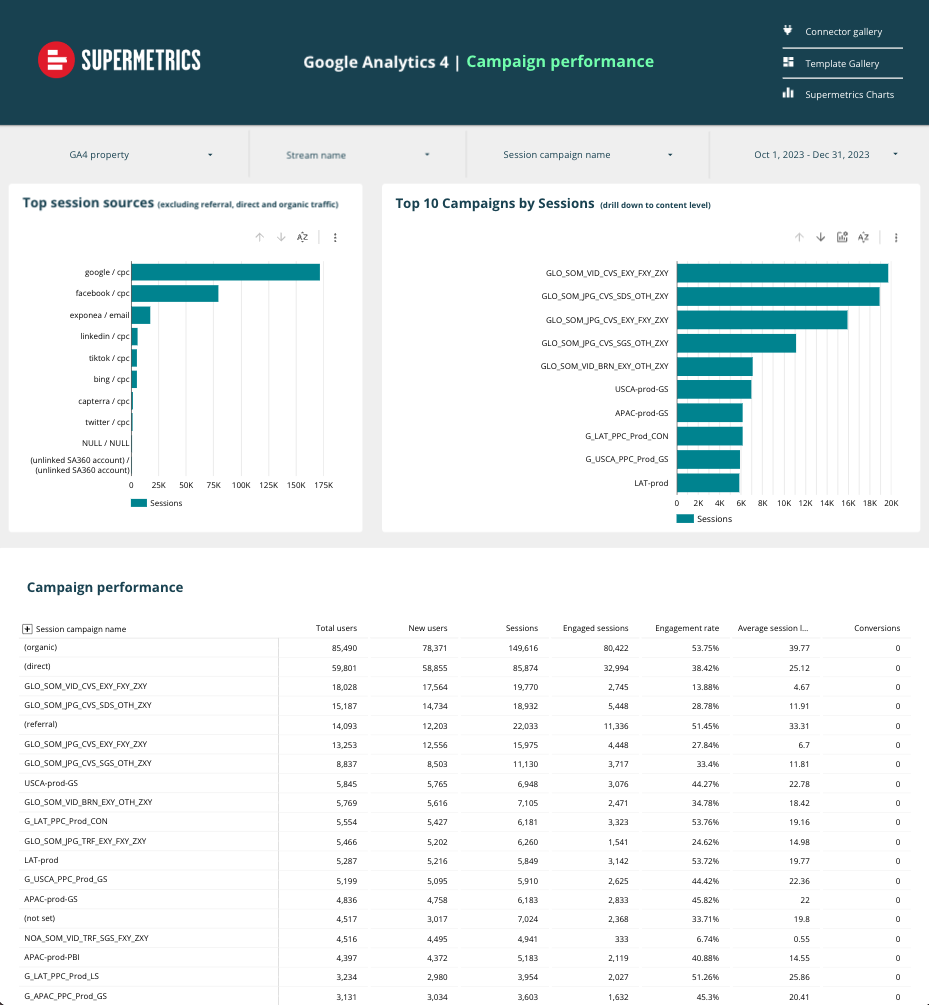
This Supermetrics template gives you a clean, high-level overview of Google Analytics data. It’s split into multiple pages: Overview, Channel Performance, Page Performance, and Campaign Performance.
The layout is functional, and for anyone already familiar with Google Data Studio, it’s a fast way to plug in GA4 data without starting from scratch.
But there are a few caveats:
- Everything is still manual. Even though there’s a template available, you’d still need to manually set it up inside of Looker Studio and tweak layouts, adjust filters, or apply custom branding for a client.
- You’ll need to manage the data connection separately. If the GA4 connector breaks (which happens more often than you’d like), your charts stop loading, and fixing it isn’t always straightforward.
- There’s no summary or written explanation. You get a lot of numbers, but no interpretation. It’s on you to analyze and explain what the data means.
Whatagraph’s Google Analytics 4 analytics dashboard eliminates these pain points. You get:
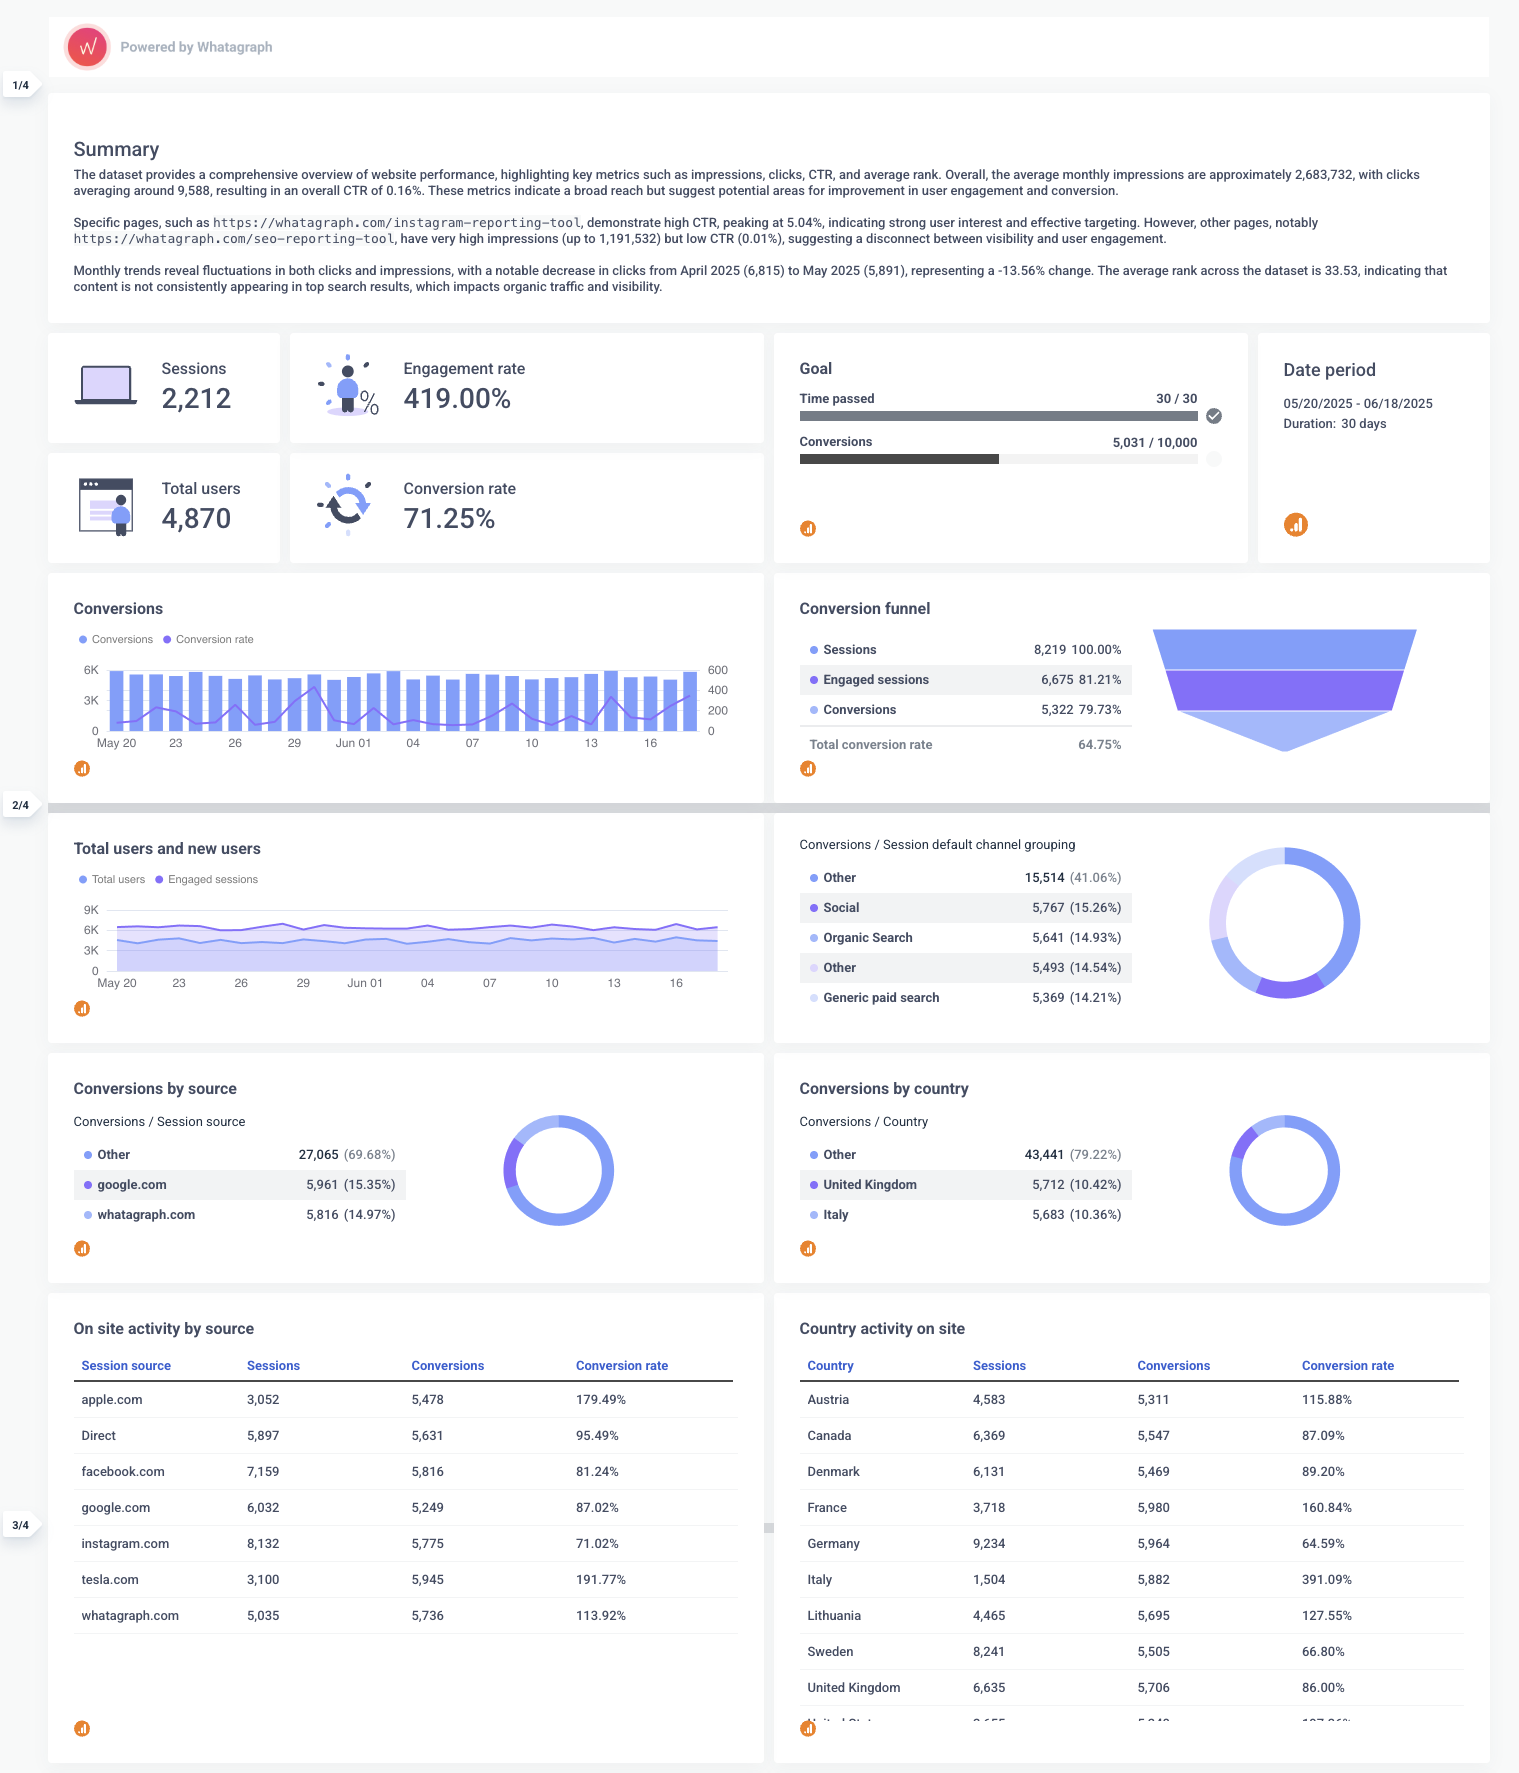
✅ Performance summary at the top: Every Whatagraph GA4 report starts with a short summary of key trends. This can be written automatically by AI or manually by your team. So instead of just showing the numbers, the report explains what they mean.
✅ Fully brandable layout: You can customize the color palette, fonts, logos, and even the report domain — whether you're creating a report for your own company or for a client. Supermetrics (paired with Google Data Studio) can’t do that natively.
✅ Interactive and filterable charts: Want to filter by country, campaign, or channel group? That’s built in. You don’t need to create filters or set up interactions manually, you can just ask AI.
✅ All-in-one platform: Unlike the Supermetrics + Looker Studio combo, Whatagraph handles everything in one place – data connection, cleaning, transformation, and visualization. That means fewer things to break, and fewer tabs to switch between.
6. Google Search Console report template
For this, we picked Data Bloo’s all-in-one Google Search Console report template for Looker Studio.
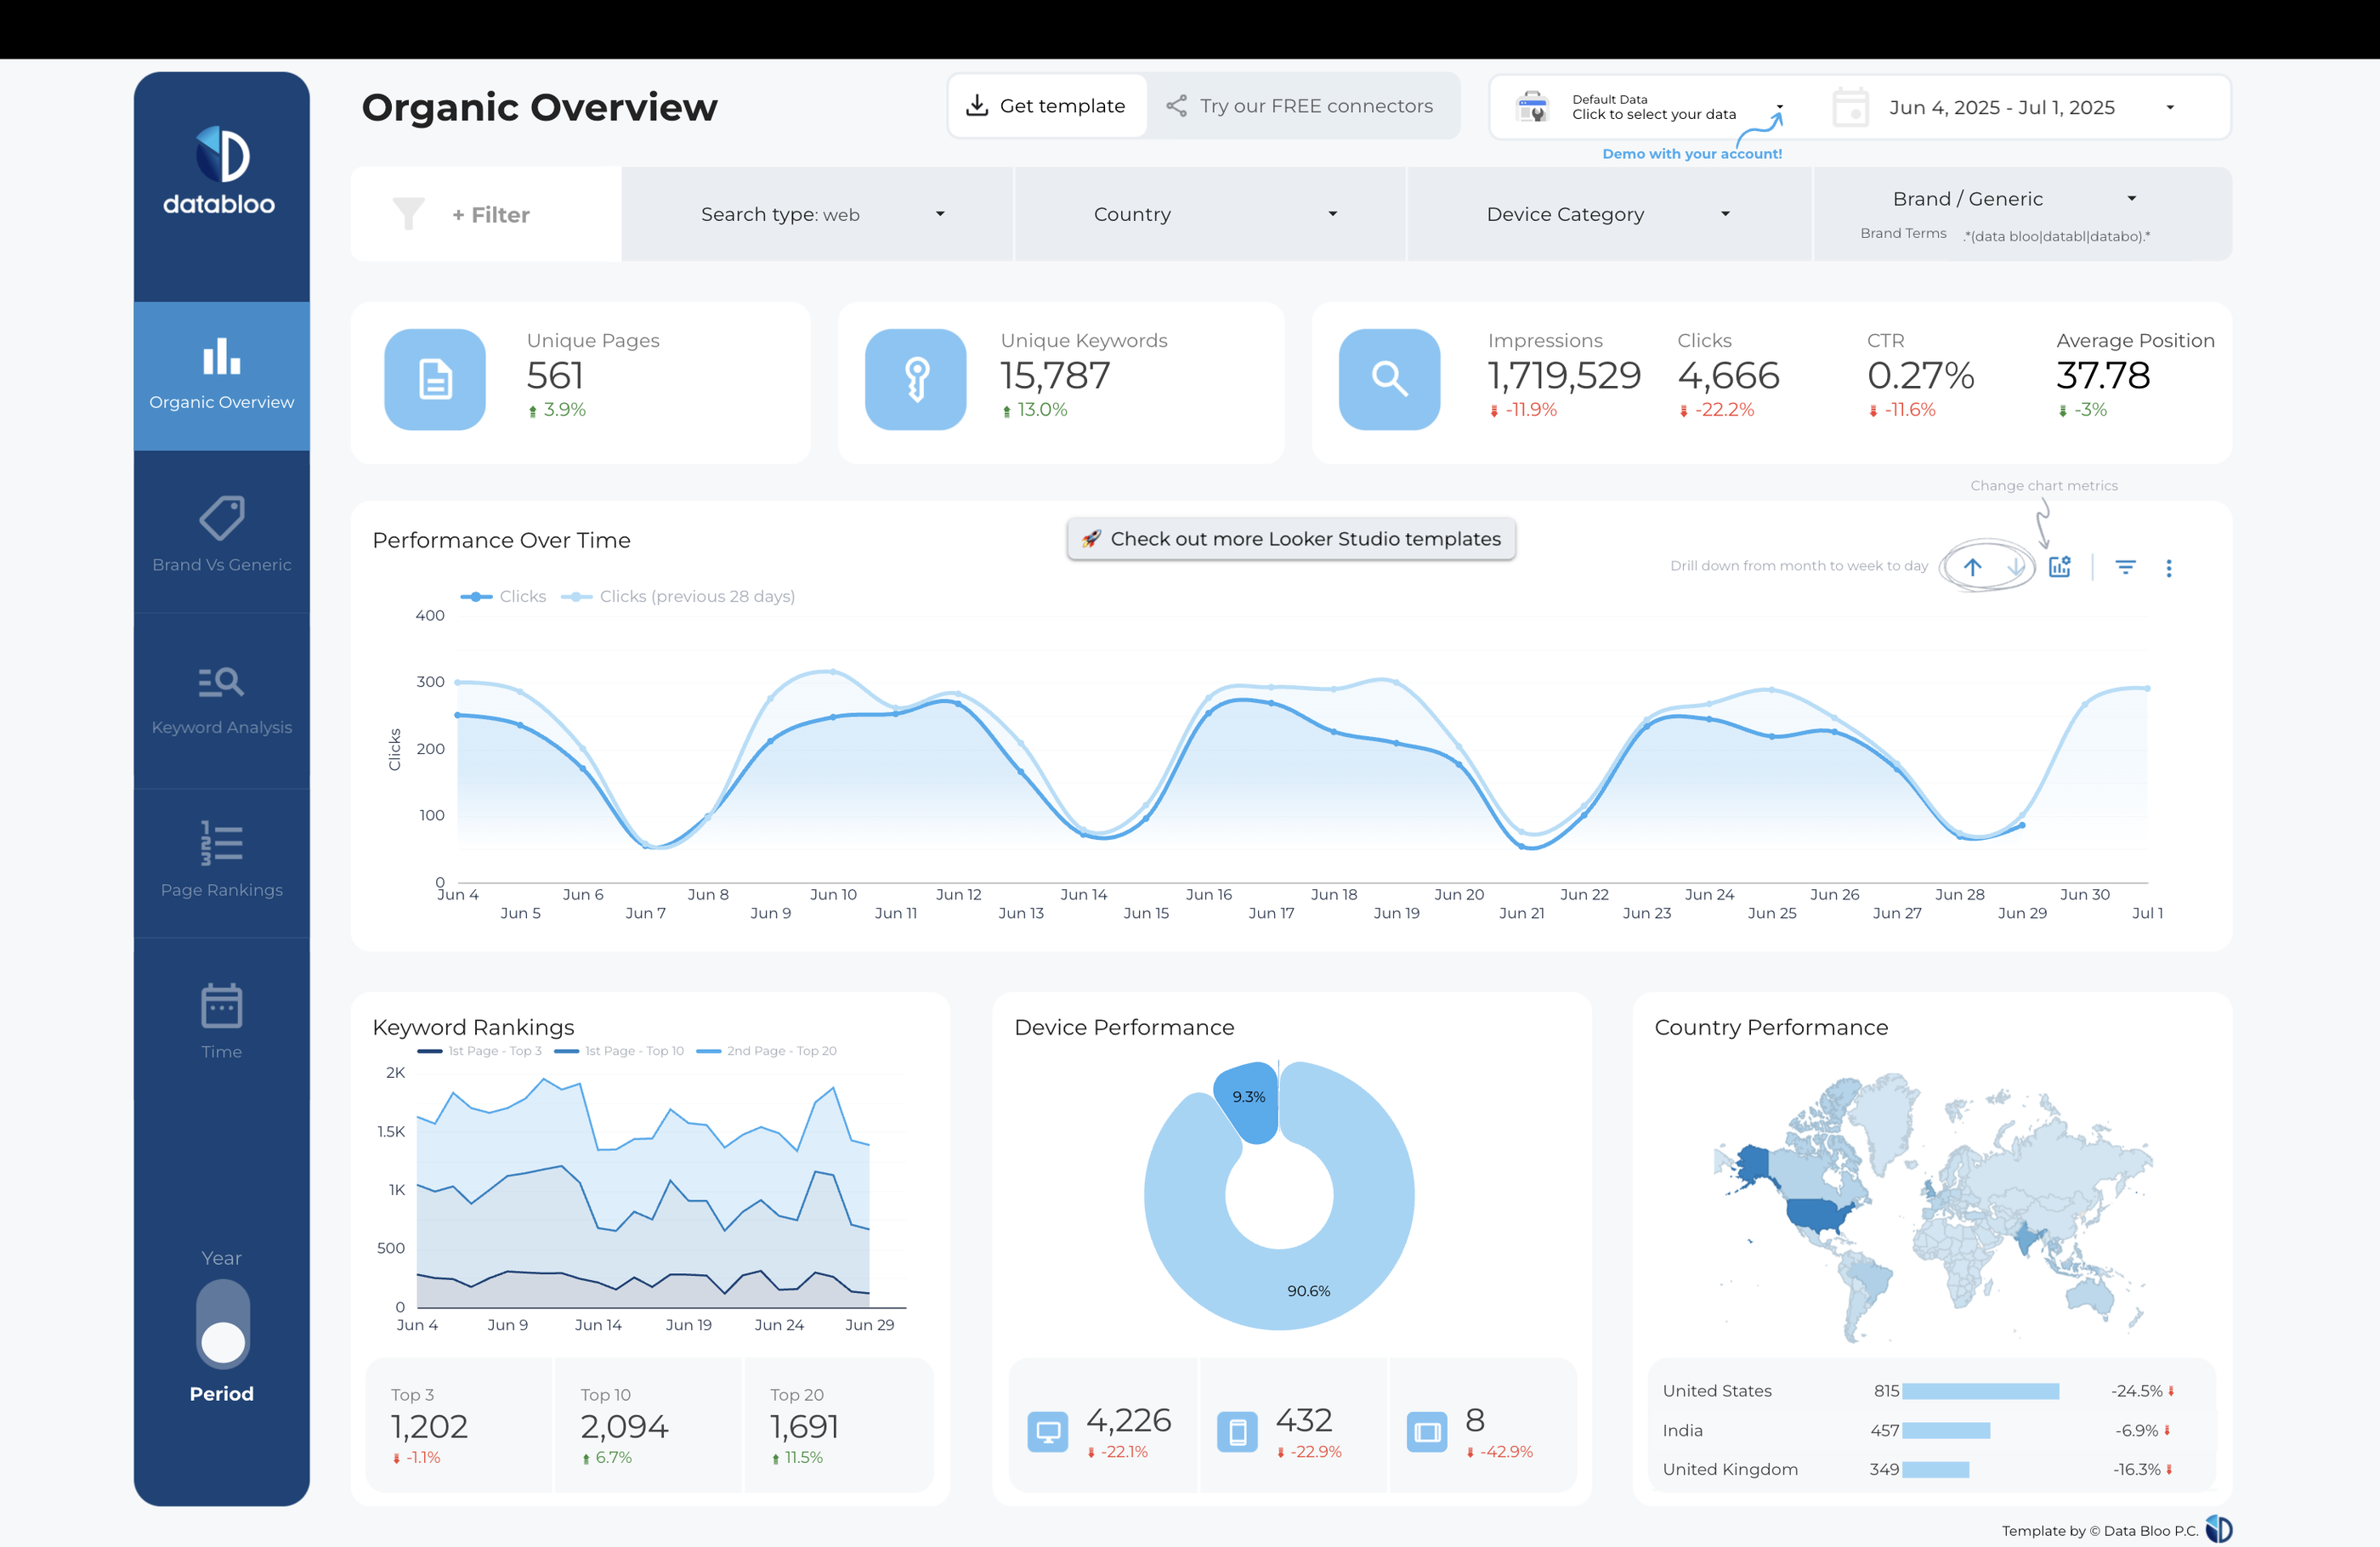
This Looker Studio digital marketing dashboard is broken down into 5 different pages:
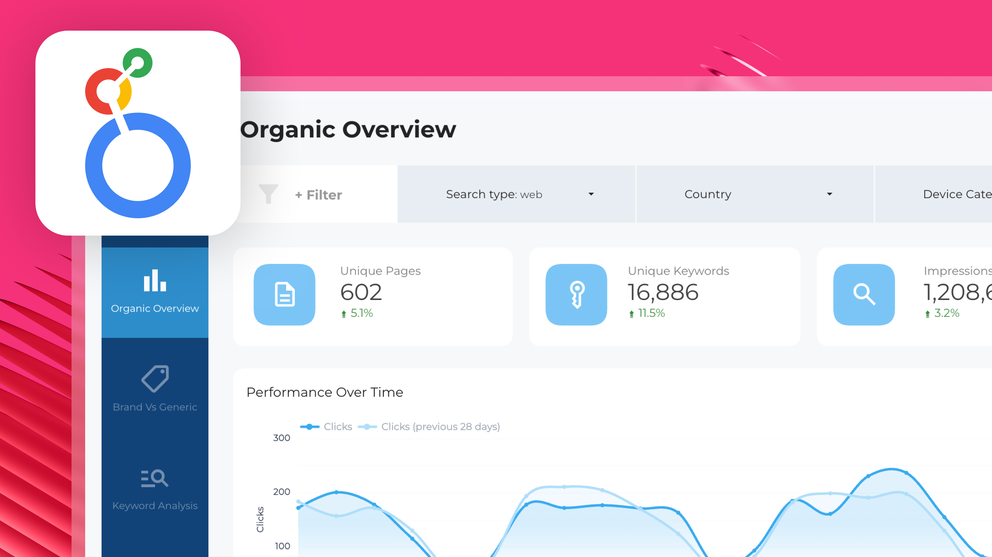
- Organic overview: Shows Search Console data like total unique pages, keywords, impressions, clicks, CTR, and average position at a glance. Includes time-series trends for clicks, device performance pie charts, keyword rankings, and country performance maps.
- Brand vs. Generic: Breaks down performance between brand and generic keywords with impressions, clicks, and CTR. Includes pie charts and trend graphs to compare brand vs generic keyword performance over time.
- Keyword analysis: Compares short-tail vs long-tail keyword performance, showing keyword count, clicks, and CTR. Visualizes keyword length distribution and performance trends over time.
- Page rankings: Displays keyword rankings across top 3, top 10, top 20, and beyond, with keyword movement tracking. Includes a keyword distribution graph and a table of improved and declined keywords with position changes.
- Time: Shows overall performance over time with impressions, clicks, CTR, and average position by month. Bar and line charts help track seasonal trends and performance shifts.
But keep in mind here again that this template is NOT free. You’ll need to pay 149 euros to get access.
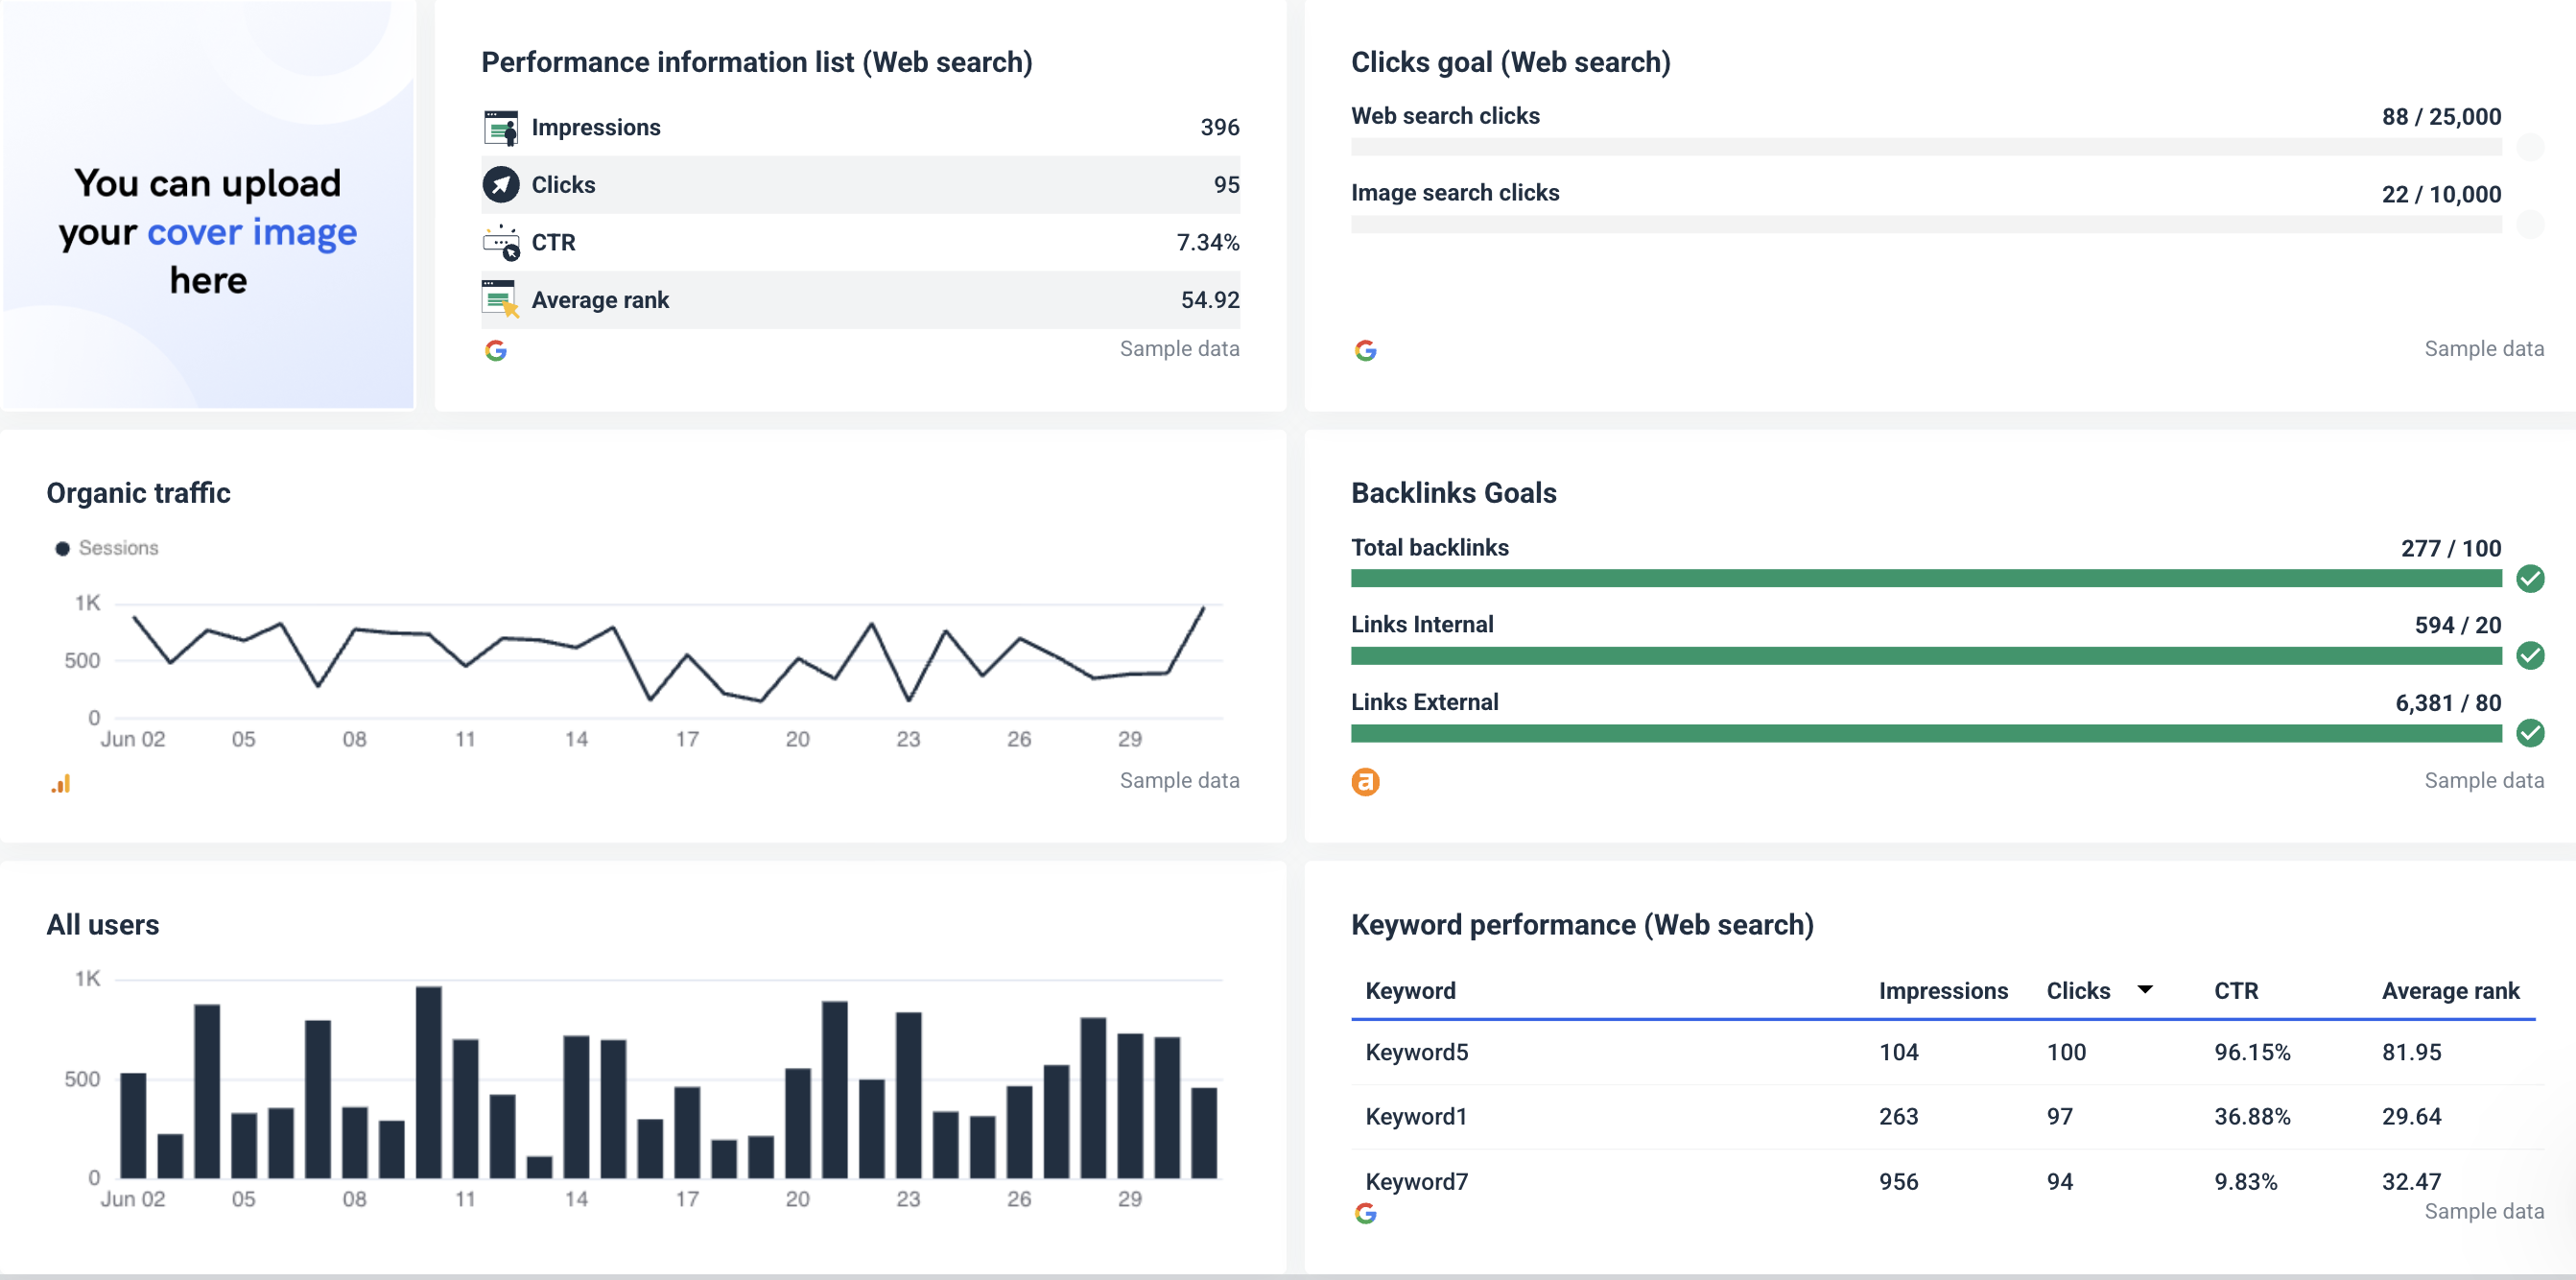
Whatagraph’s Google Search Console dashboard has all these (and comes with all our pricing plans), but with goal pacing widgets, performance summaries, and white-labeling features like custom logos, images, icons, and color schemes.
7. Google My Business Dashboard Template
If you have Google My Business campaigns, this dashboard template from Data Bloo can be a great resource.
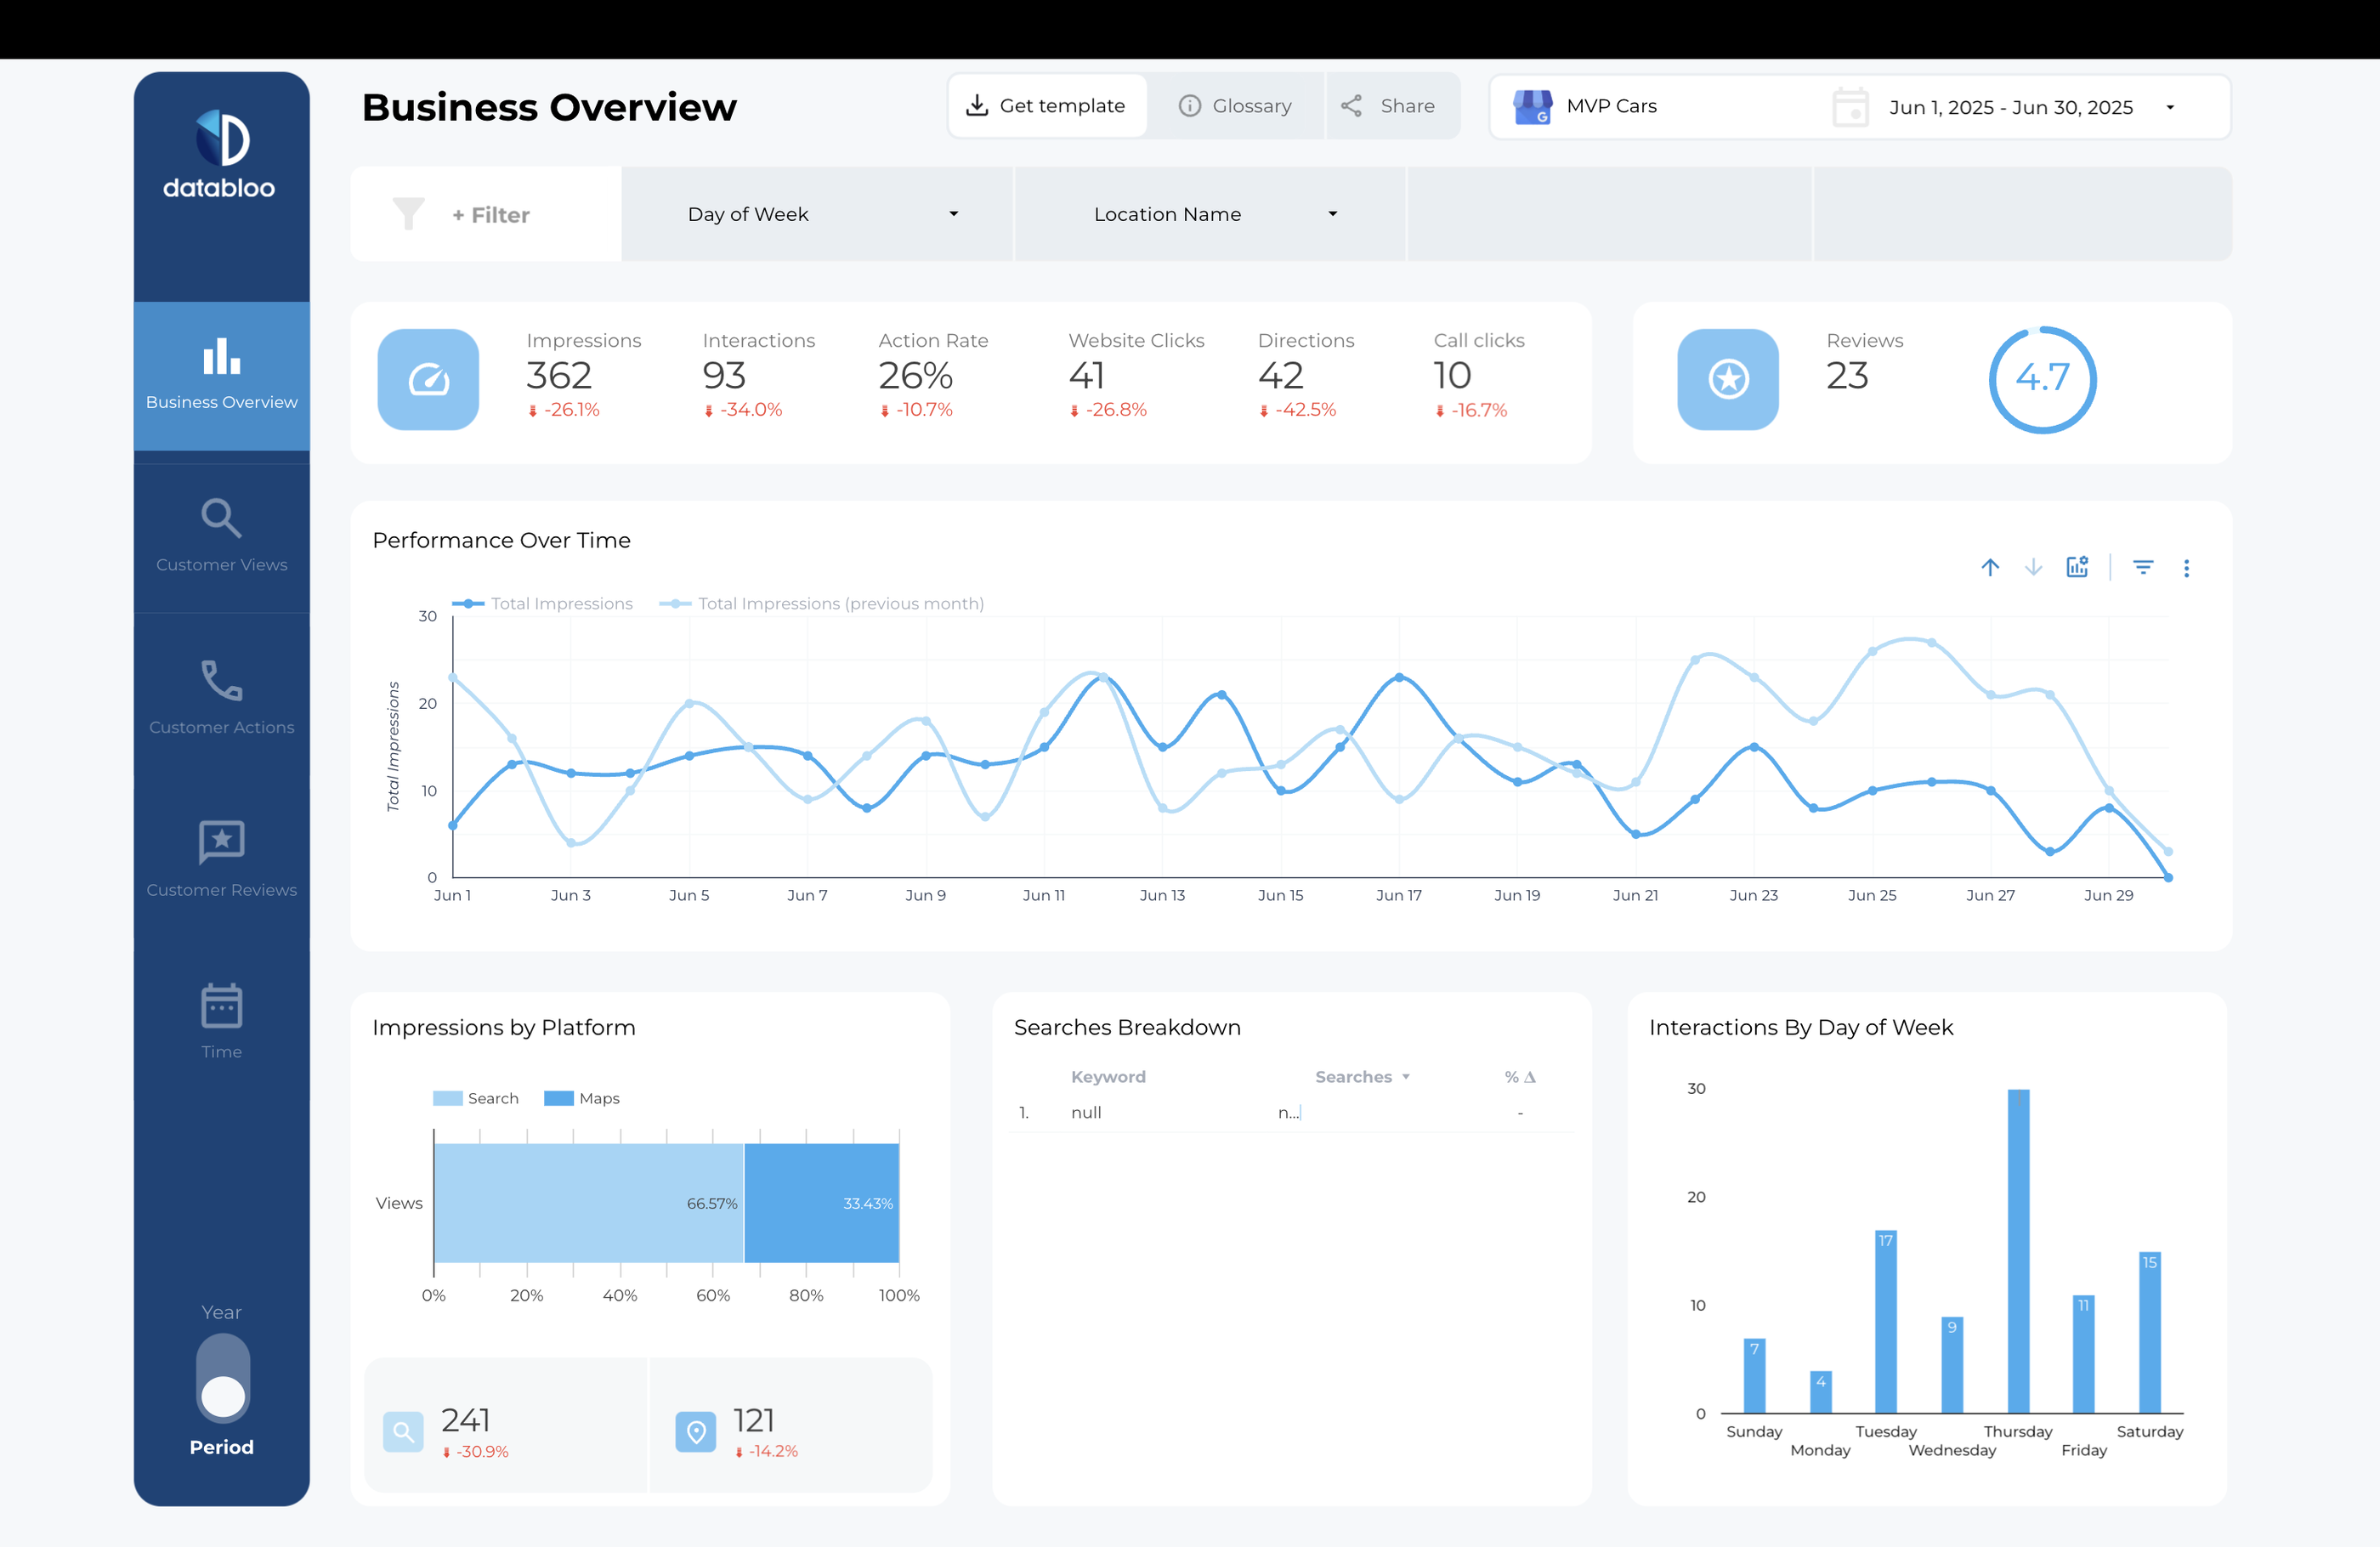
Similar to the GSC template above, it’s divided into 5 different pages:
- Business overview: Shows impressions, interactions, action rate, clicks, direction requests, call clicks, and reviews at a glance. Includes a time-series chart for tracking impressions over the month and bar charts for platform (Search vs Maps) and day-of-week performance.
- Impressions search: Focuses on search impressions, breaking down by device (desktop vs mobile) and day of the week. Includes a trends chart for impressions over time and a detailed table for search analysis by day.
- Customer actions: Tracks website clicks, direction requests, and call clicks with individual and total action counts. Includes time-series trends and a day-of-week breakdown for when customers are engaging most.
- Time: Displays total impressions, actions, action rates, and key GMB metrics by month in a clean bar and line chart combo. A detailed table below shows monthly breakdowns of impressions, clicks, directions, and calls.
With Whatagraph’s Google My Business reporting tool, you can go a step further and even visualize the top comments and reviewers like so:

2 Best eCommerce Dashboard Examples for Looker Studio
Here are the examples of Looker Studio dashboard we’ll cover for eCommerce:
- Overall eCommerce dashboard
- Shopify dashboard
8. Overall eCommerce Dashboard
For this, we chose Supermetrics’ eCommerce performance overview dashboard.
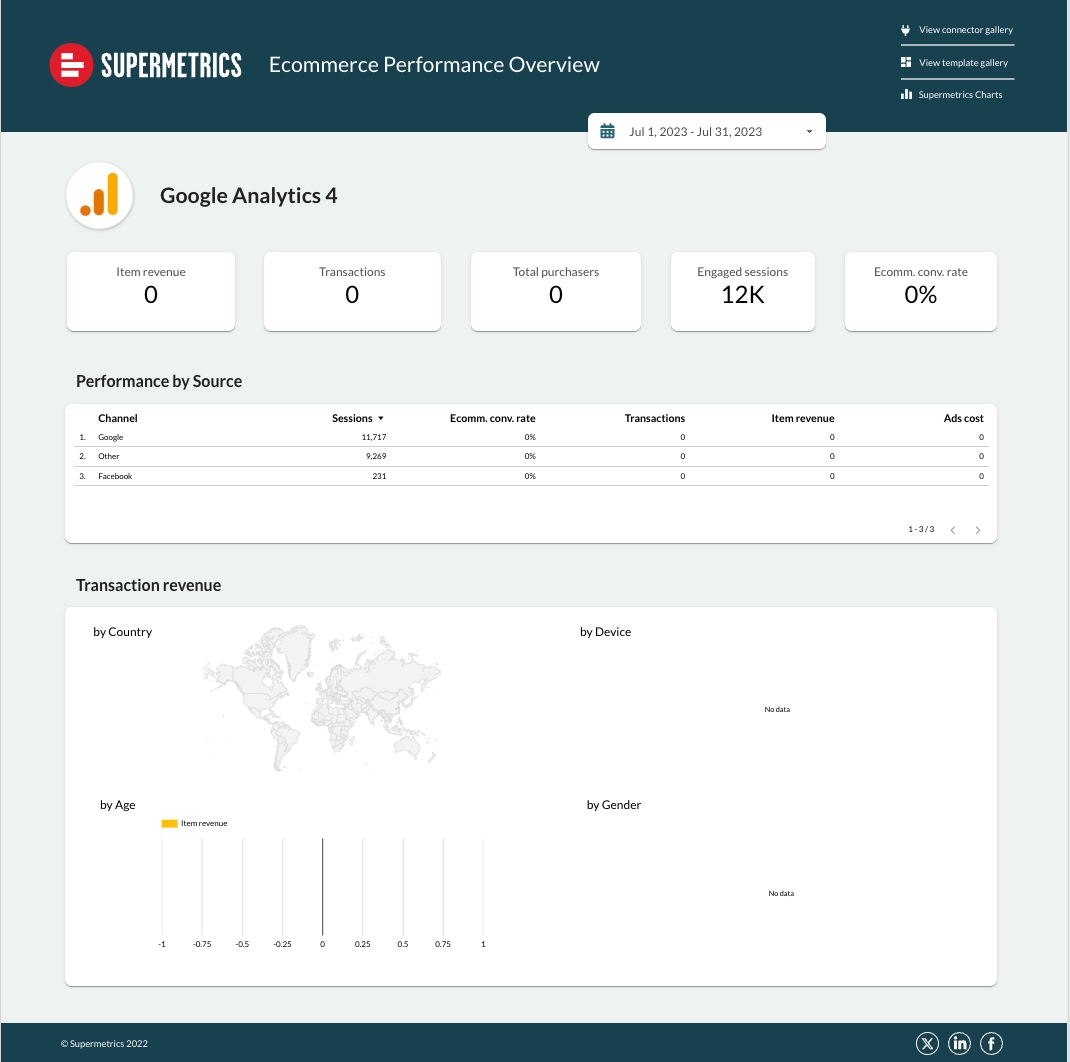
This dashboard is structured with a basic top-level summary showing item revenue, transactions, total purchasers, engaged sessions, and conversion rate.
Below that, it breaks down performance by source in a simple table and attempts to show transaction revenue by country, device, age, and gender.
While it does the job, the dashboard feels bare and uninspiring, with minimal visuals, muted design, and a heavy reliance on plain tables without engaging charts.
It doesn’t guide you on insights or optimization decision-making, doesn’t come with goal pacing, and is not client-friendly for agency reporting.
9. Shopify dashboard template
Here again, we chose Supermetrics’ Shopify dashboard template.
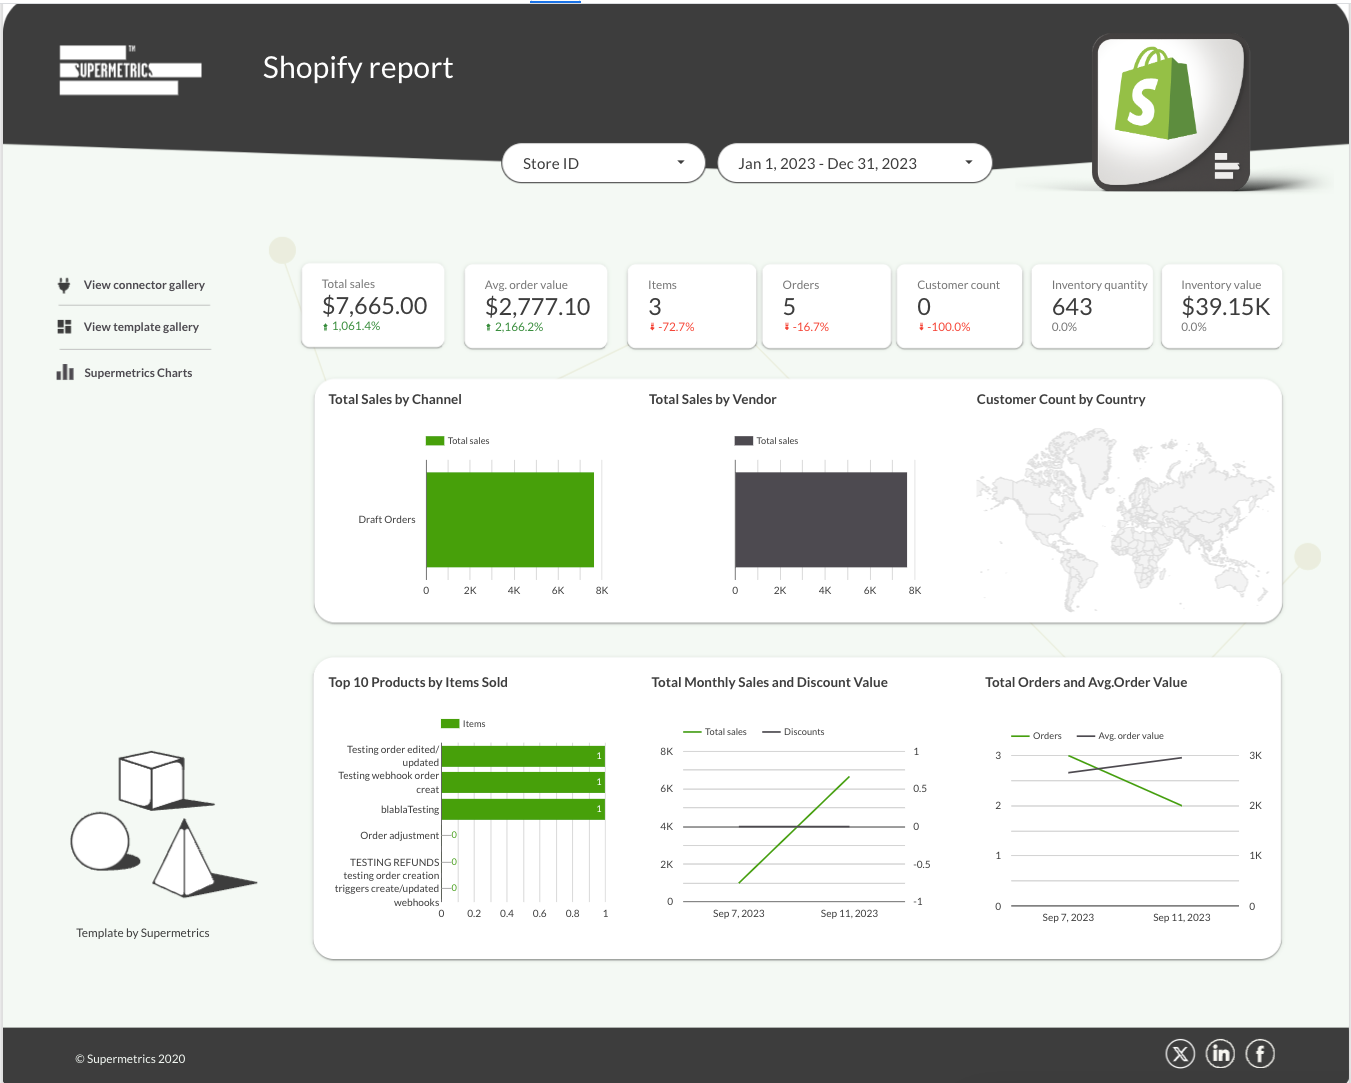 This Shopify report is much better than the eCommerce one as it’s more vibrant and comes with different varieties of charts. It’s also got a nice lineup of key Shopify metrics like Total sales, average order value, and inventory value.
It’s definitely an upgrade from Excel or Google Sheets, but it’s still not:
❌ Interactive
❌ Branded
❌ Actionable
If you’re looking for something like this, Whatagraph’s Shopify report template is the better choice.
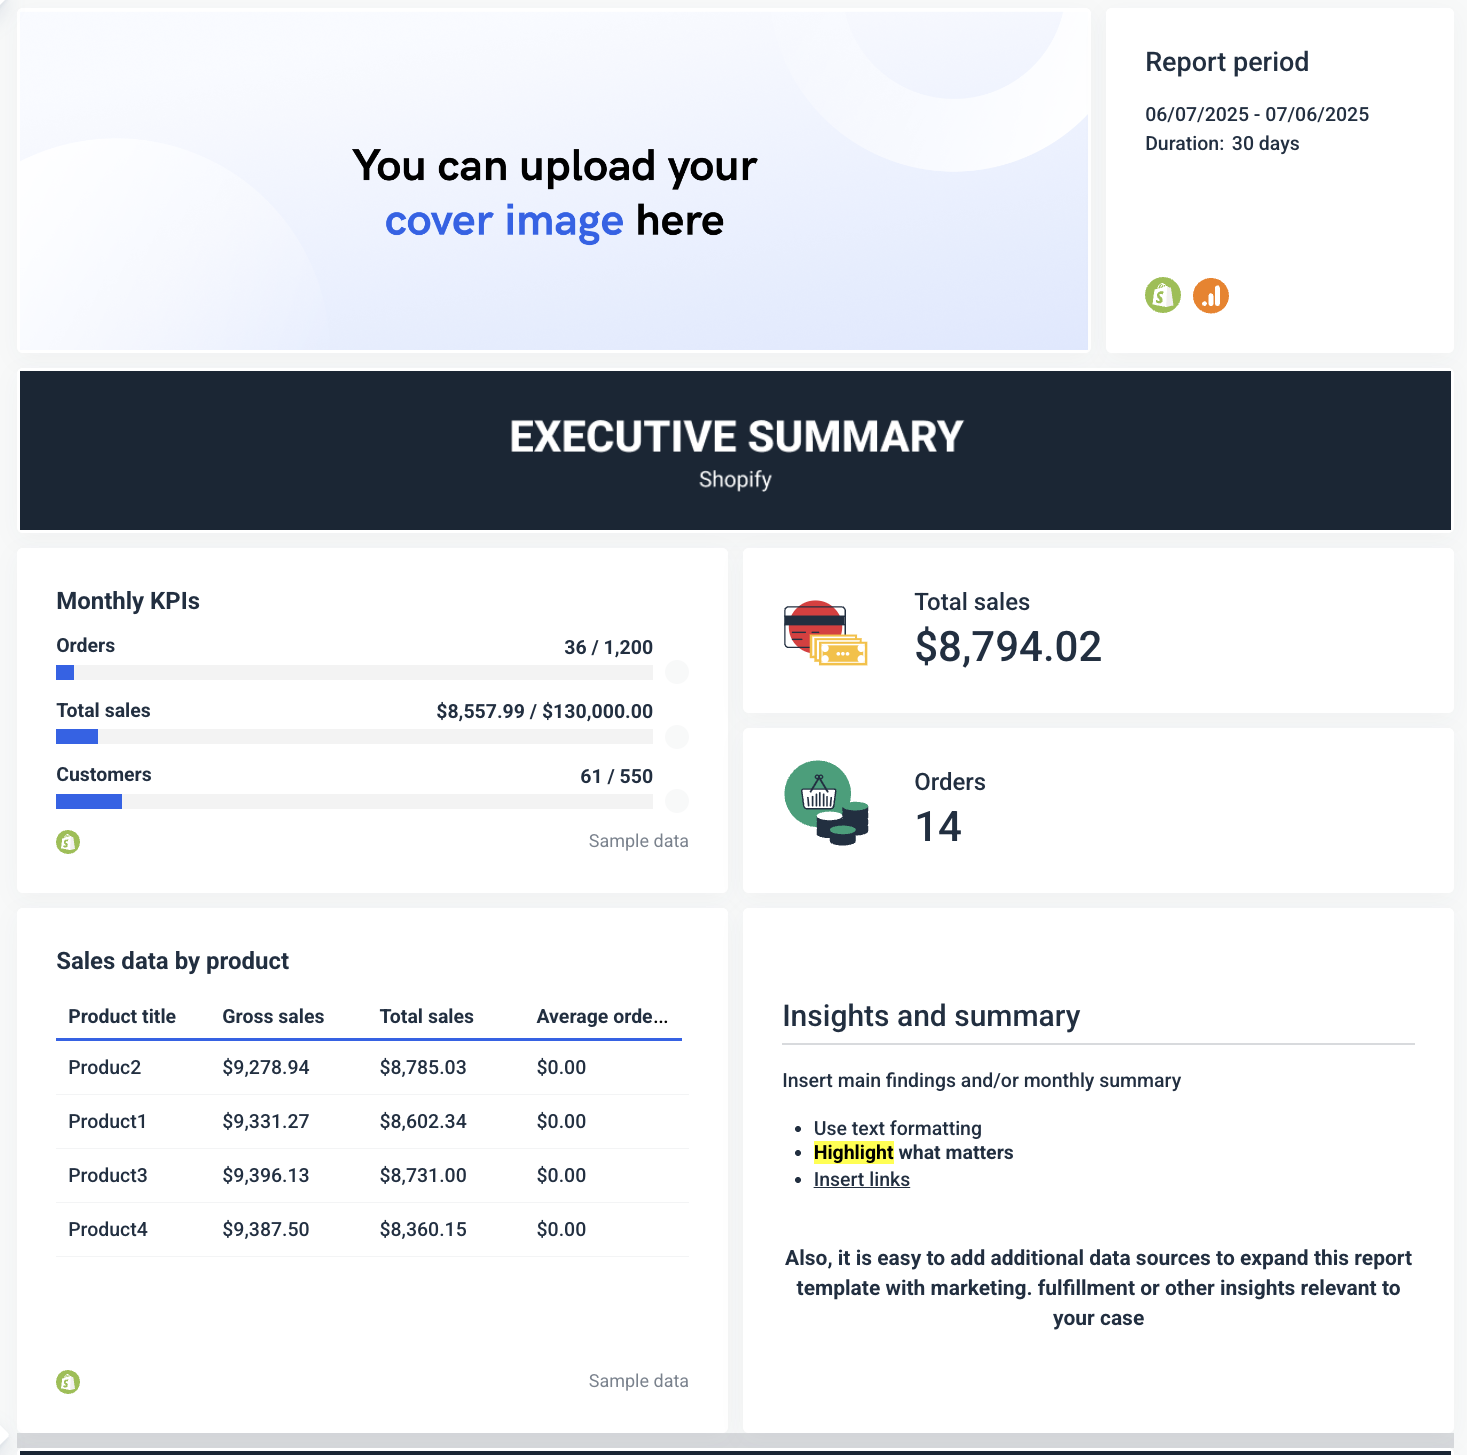
✅ AI-generated performance summaries: Each Whatagraph Shopify report starts with a clear, human-readable summary of key sales and customer trends, written automatically by AI or manually by your team. This turns raw numbers into insights clients can act on.
✅ Fully customizable and branded: Easily add your logos, brand colors, fonts, images, and icons to match your agency or client’s style. You can even share reports on a custom domain—something Supermetrics + Looker Studio can’t natively do.
✅ Interactive, filterable charts and graphs: Filter by product, customer segment, traffic source, or sales channel without manual setup. Want to see sales by country or device type? You can instantly adjust views or add new widgets with a simple AI prompt.
2 Best CRM and Email Marketing Dashboards on Looker Studio for Reporting
Last but not least, here are the CRM and email marketing reports dashboards we’ll cover in this section:
- Hubspot reporting template
- Mailchimp reporting template
10. Hubspot reporting template
For this, we chose Coupler.io’s Hubspot reporting template for Looker Studio.
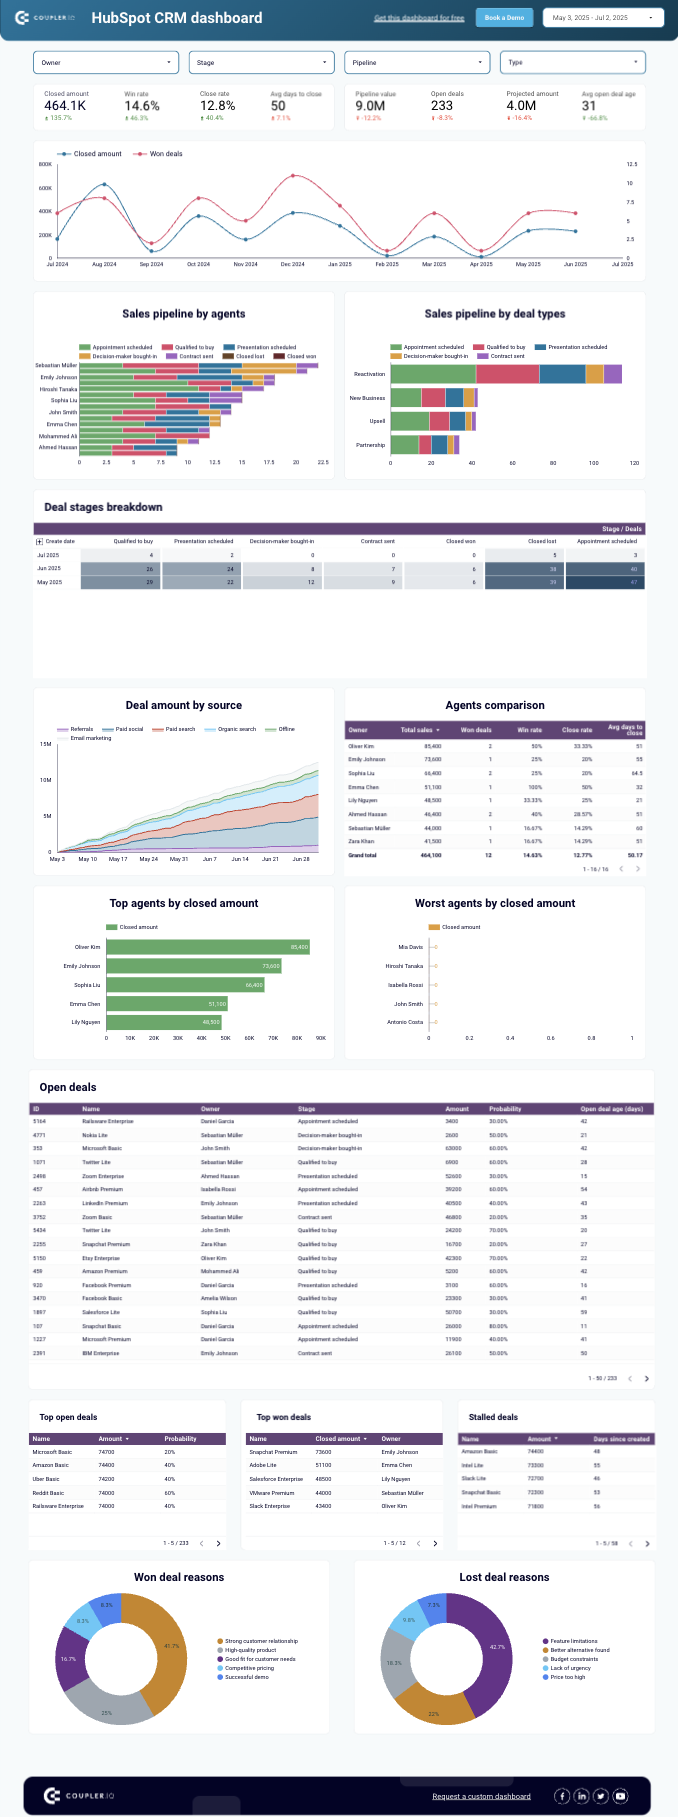
We like that it’s very comprehensive and vibrant.
It starts with a summary bar showing closed amount, win rate, close rate, average days to close, pipeline value, open deals, projected amount, and average deal age, making it easy to check pipeline health at a glance.
The dashboard uses a mix of line charts, bar charts, and tables to show sales pipeline by agent and deal type, deal stage breakdowns, deal amounts by source, and agent performance comparisons.
It also lists open deals, top and stalled deals, and visualizes reasons for won and lost deals with pie charts, giving a clean, logical structure for sales managers to track pipeline activity.
Yet, it still doesn’t include:
❌ Goal pacing
❌ Actionable insights
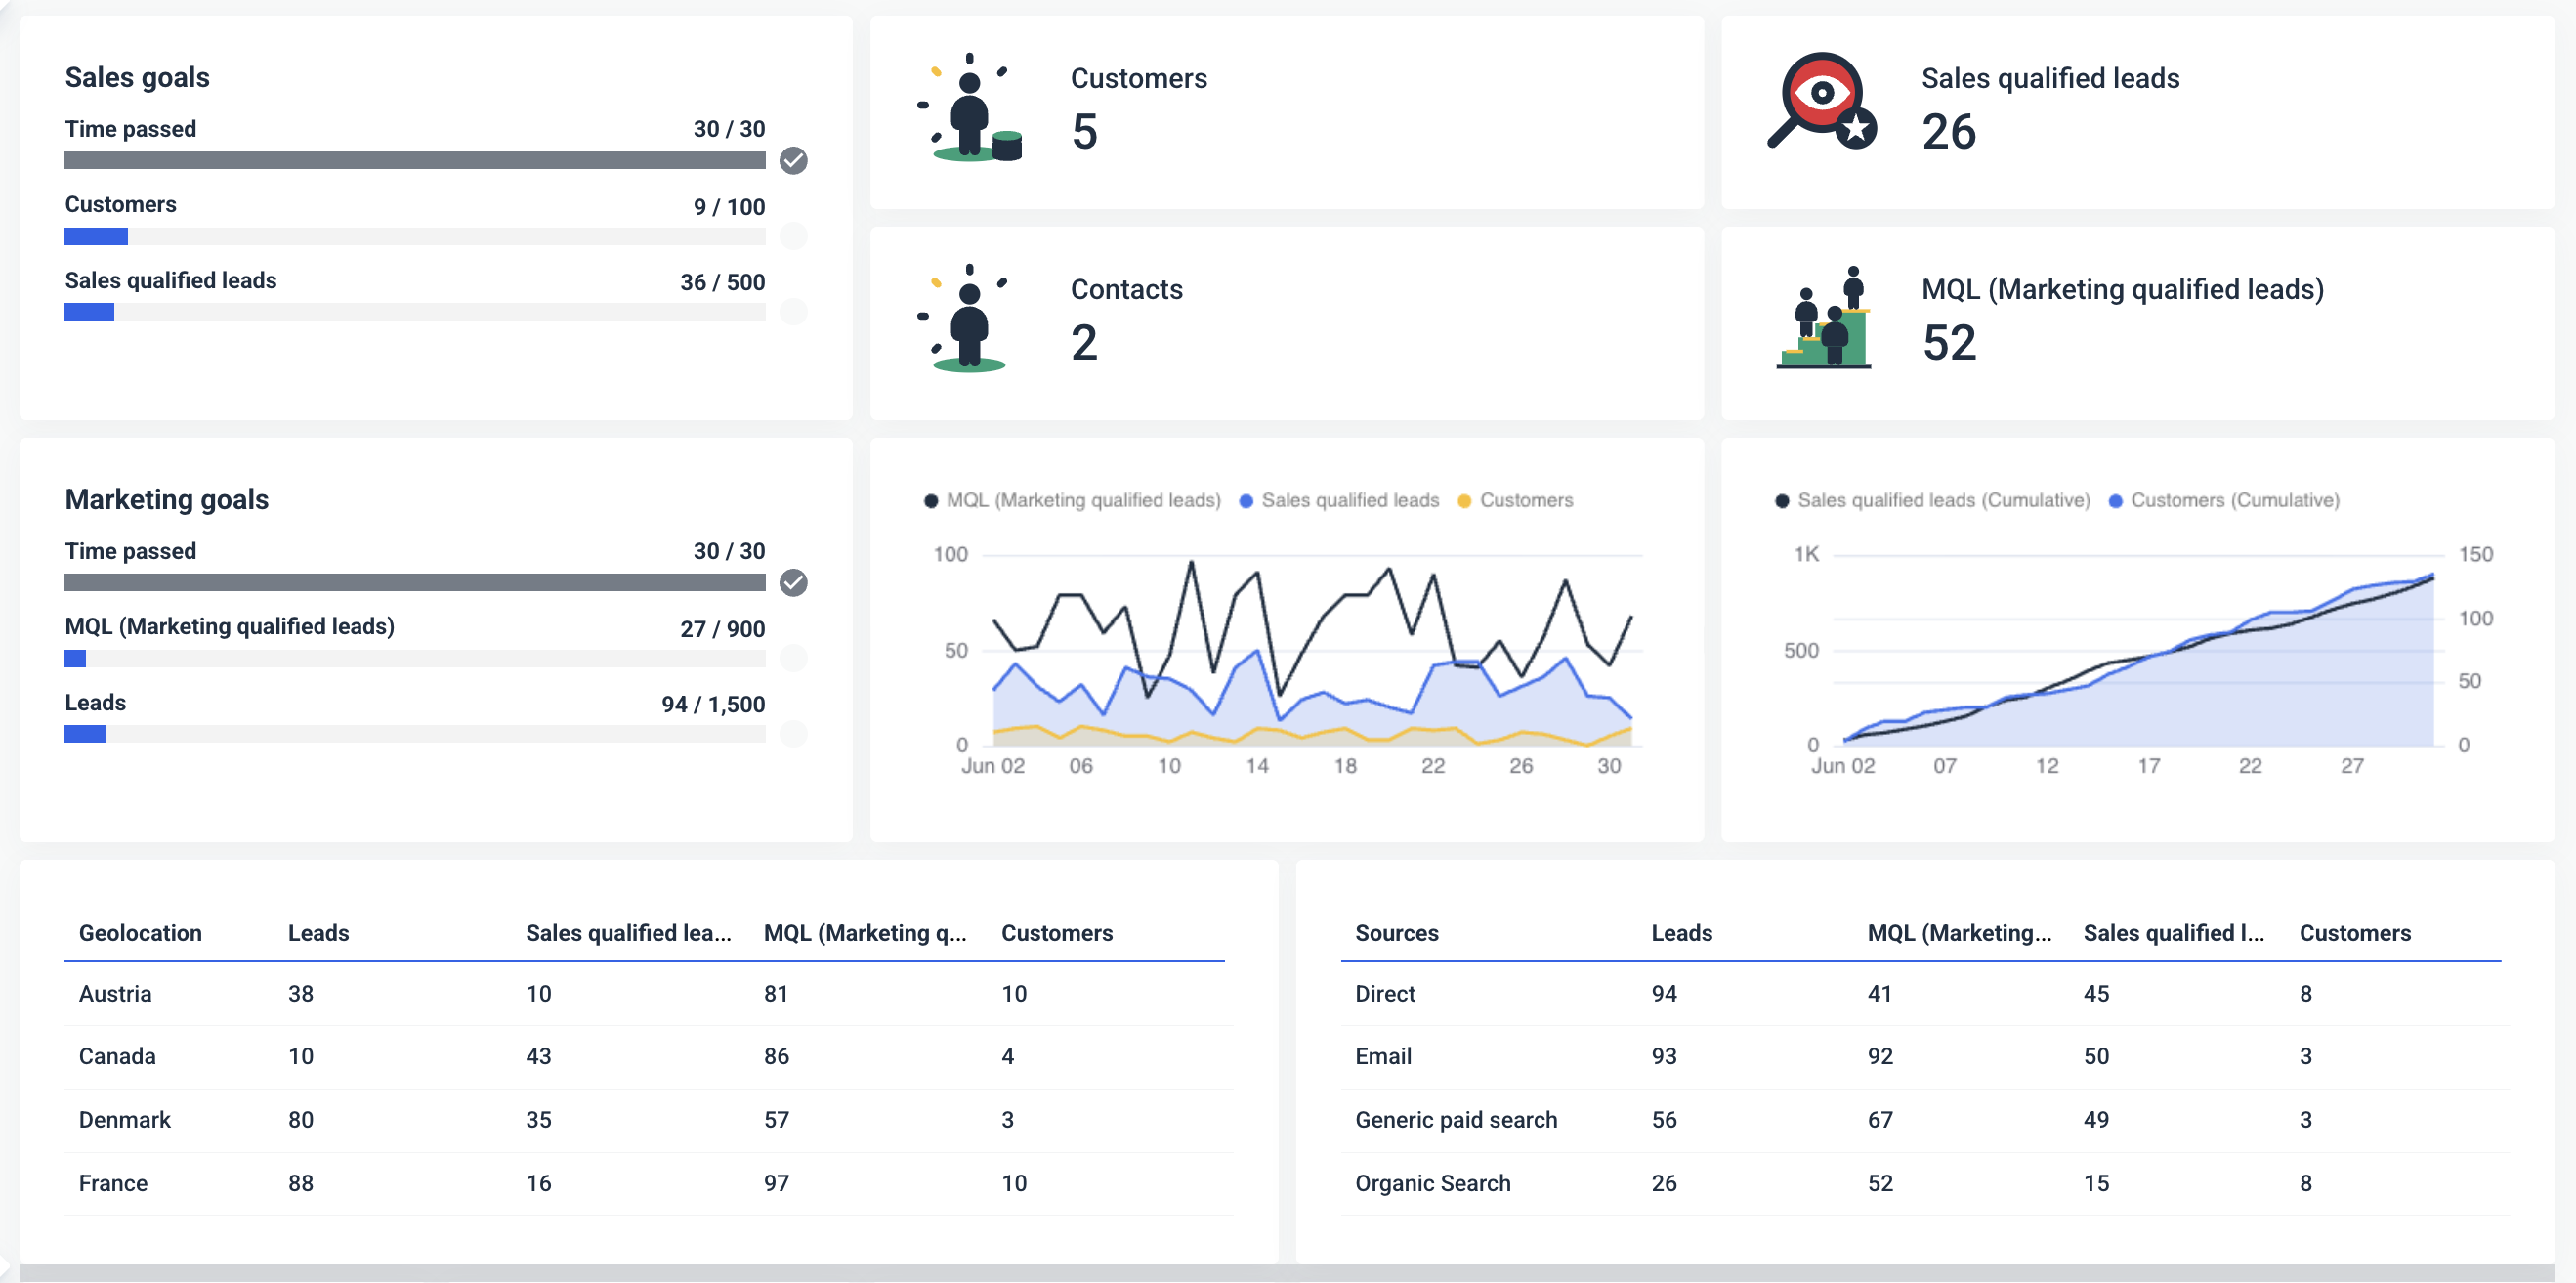
Whereas, Whatagraph’s Hubspot marketing reporting template tells a story of MQLs, SQLs, and the pipeline.
 You’ll get:
✅ Goal tracking at the top: The report shows MQLs, SQLs, leads, and customers against clear monthly targets, with visual goal pacing bars so you can instantly see progress toward your objectives.
✅ Visual funnel tracking: Includes clean funnel charts for leads → MQLs → SQLs → customers, helping you identify drop-offs in your inbound flow.
✅ Source and geo breakdowns: Breaks down leads, MQLs, SQLs, and customers by channel (email, organic, paid) and by country to show where your pipeline is coming from.
✅ Landing page performance: Shows which landing pages generate the most leads and conversions, making it easy to double down on high performers.
✅ Campaign-level insights: Breaks down performance by UTM campaigns to highlight which initiatives are driving pipeline and customer growth.
✅ Email marketing performance: Includes a full funnel view of email campaigns (sent, delivered, opened, clicked, converted) with campaign-specific open and click rates to optimize your email strategy.
✅ Clean, structured, and scannable: Uses logical sections, clear visuals, and consistent tables, making client reporting easier and more actionable than typical Looker Studio dashboards.
11. Mailchimp reporting dashboard for Looker Studio
Last but not least, let’s end with a vibrant (and very Mailchimp-y) reporting dashboard example from Windsor.ai.
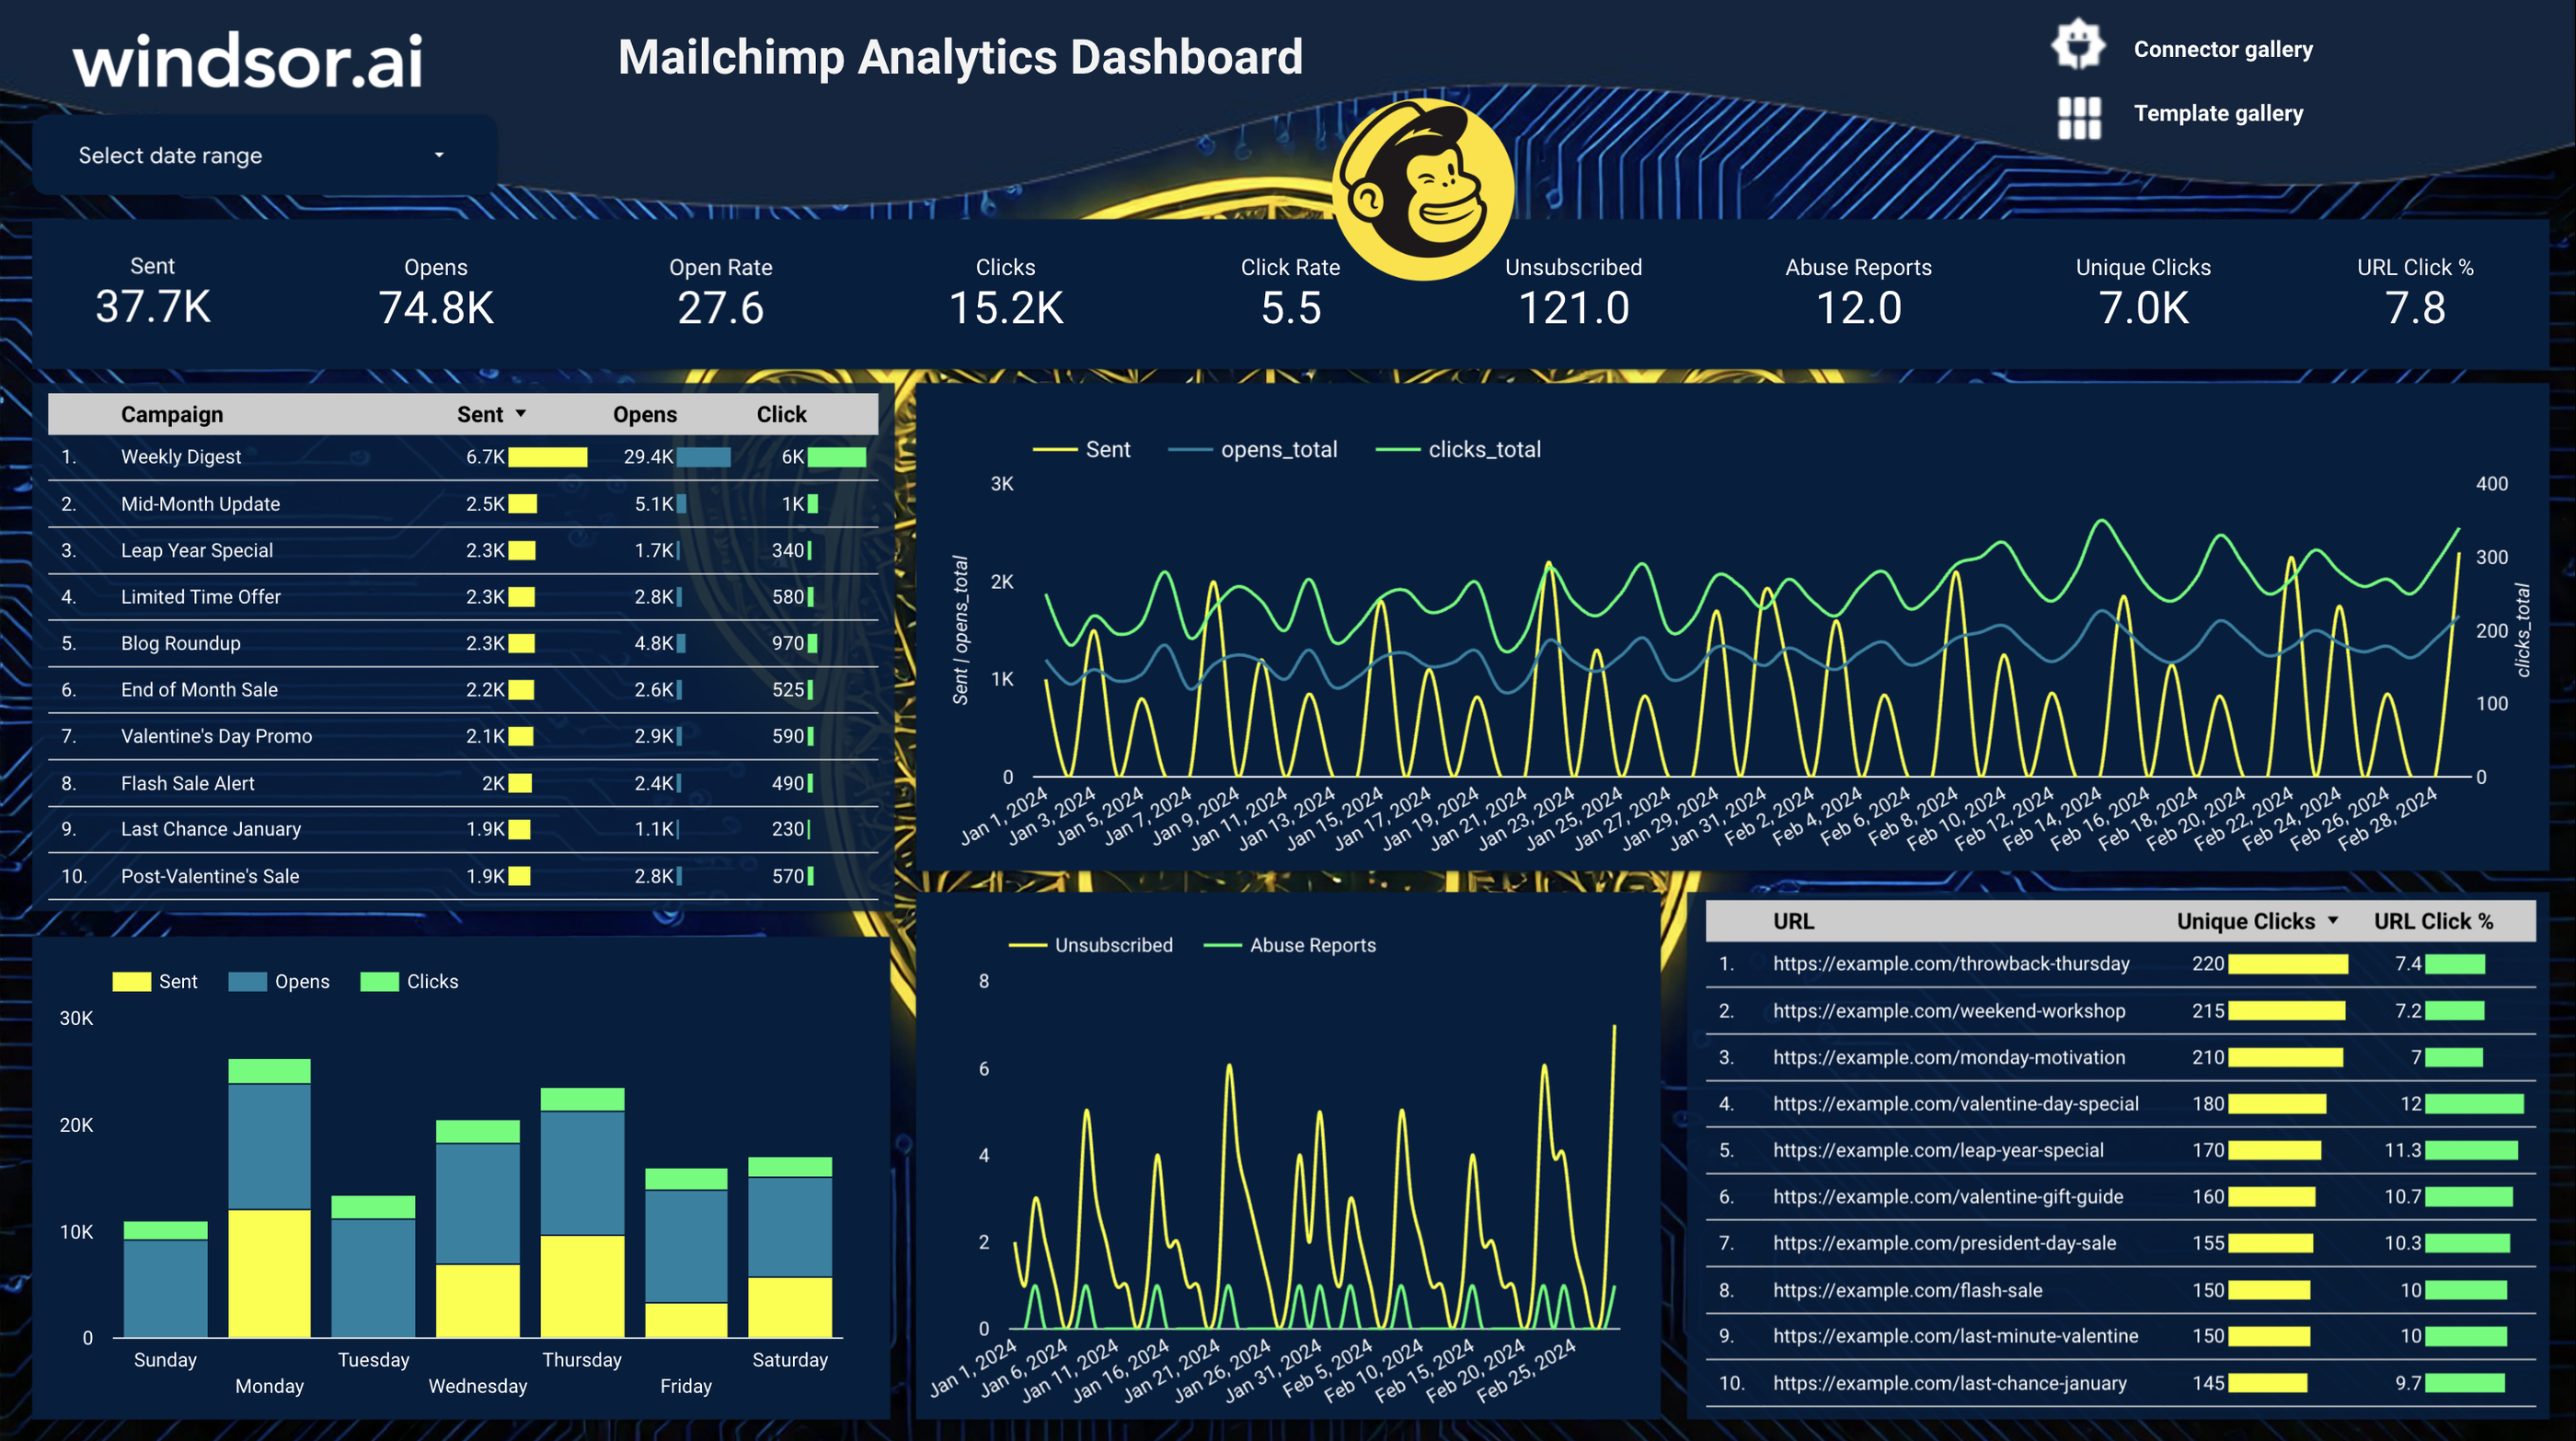
It does a solid job of showing campaign-level performance side-by-side, with clear charts tracking trends over time and a helpful day-of-week breakdown to see when your audience engages most.
There’s also a URL table showing which links get the most clicks, helping you spot top-performing CTAs quickly.
But it’s still missing a lot if you need this for serious reporting.
There’s no way to track goals, no insight into revenue from your campaigns, and no filters to drill into specific audiences or campaigns.
It also doesn’t give you any takeaways or recommendations—so you’re left figuring out what the numbers mean on your own.
Again, if you want these—Whatagraph is the better choice for you—not just for data visualization but also to tell a story with your data and prove the value of your marketing efforts to clients or stakeholders.
How to Build a Dashboard Using Looker Studio?
Here’s a step-by-step breakdown of how to build marketing reporting dashboards in Looker Studio:
1. Choose your template
Head to the Looker Studio Template Gallery or grab a template from vendors like Supermetrics, Databloo, Porter, or Coupler.io. Pick one that matches your use case (e.g., Google Ads, SEO, eCommerce).
2. Copy the template
Open the template and click “Use Template.” This will prompt you to connect your own data sources so the template pulls your actual data instead of sample data.
3. Connect your data sources
Add your Google Analytics, Google Ads, Facebook Ads, or other relevant connectors. Some templates require third-party connectors (often paid), so check compatibility before you start.
4. Check and adjust metrics
Templates might use metrics you don’t track or need. Review each chart to ensure it’s showing the right KPIs (e.g., replace “Sessions” with “Users” if needed).
5. Customize styling
Change colors, fonts, and logos to match your brand or client branding, though Looker Studio has limited customization options. Add section headers if the template feels cluttered.
6. Share your dashboard
Once ready, click “Share” to generate a link for your team or clients. You can embed it into reports or client portals for easy access.
And that’s all there is to building a Looker Studio dashboard.
Templates are a great starting point to save time on creating a Looker Studio report, but they often need manual tweaking, and you’ll still need to manage data connectors, styling, and performance issues yourself.
If you want an even faster route, Whatagraph lets you skip templates altogether by auto-generating dashboards with AI, fully branded and ready to share in minutes. And if you still need dashboard templates for inspiration, we have over a 100 of them.

WRITTEN BY
YamonYamon is a Senior Content Marketing Manager at Whatagraph. Previously a Head of Content at a marketing agency, she has led content programs for 5+ B2B SaaS companies in the span of three years. With an eye for detail and a knack for always considering context, audience, and business goals to guide the narrative, she's on a mission to create genuinely helpful content for marketers. When she’s not working, she’s hiking, meditating, or practicing yoga.