Your Guide to Using LinkedIn Analytics to Improve Your Marketing Results
LinkedIn has changed a lot over the past few years. It started as a way to build up your professional network. Nowadays, businesses use it as a platform for content marketing.

Nov 27 2020 ● 5 min read
Just like with any other marketing effort, you should track the outcome of advertising on LinkedIn – here's where LinkedIn advertising comes in.
Many companies benefit greatly with the help of LinkedIn analytics. By using data and tracking the key metrics, marketers can adjust their content marketing strategy.
For marketers, LinkedIn analytics is exactly what you need to prove your results to clients. In LinkedIn analytics, you can report on your engagement rate, follower demographics, page views, and many other valuable metrics. All of these analytics can improve your bottom line.
In today's article, we're going to show you how you can see your LinkedIn analytics, understand them, and put them into use.
How do I use my LinkedIn Analytics?
Start by navigating to your LinkedIn analytics dashboard: log in to your account and open your company page. From there, you can check your analytics in several different areas. Here are a few:
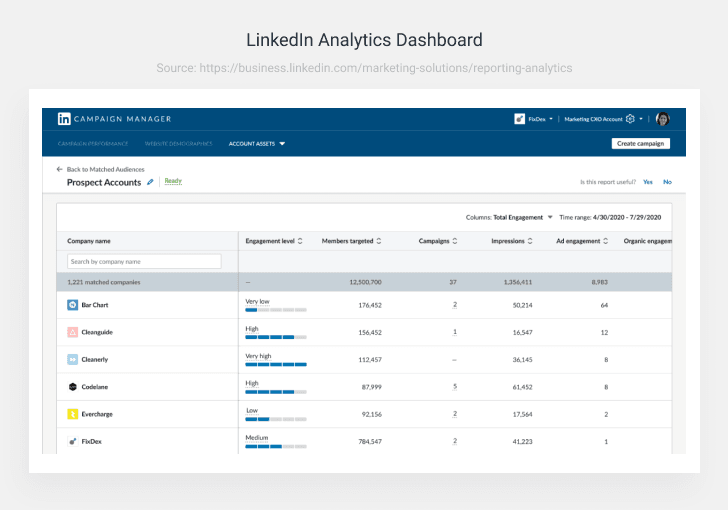
Analytics Dashboard
The Analytics Dashboard is the main area to monitor your LinkedIn page performance. In this Dashboard, there are three different data categories:
- Visitor analytics.
- Updates on engagement metrics for LinkedIn content.
- Follower demographics and numbers on people who subscribe to your page.
Activity Dashboard
This Dashboard is for qualitative information on:
- Likes
- Shares
- Comments
- Mentions
Here, you can crunch the data to understand the reason behind trends in data direction. In other words, the activity dashboard will give you an insight into why some metrics are up or down.
LinkedIn Post Analytics
Conveniently enough, LinkedIn allows you to see in-depth analytics from posts on the Updates Dashboard section. You can also view the performance of each post individually.
LinkedIn Profile Analytics
Another great way to gather information and make sure you're content is performing is by checking your page visitors and profile analytics. You can find these numbers on your profile underneath Your Dashboard.
What do all these LinkedIn stats mean exactly?
Here are some analytics types you'll find on LinkedIn and what each one means.
Company page analytics
You can use these analytics to measure your page performance. That way, you can better understand what efforts are paying off in terms of content performance.
Visitor analytics
Visitor analytics are essentially traffic metrics. From the Dashboard, you can measure unique visitors and page views. Visitor analytics help companies track what kind of visitors their content is pulling.
Visitor demographics can also help you learn more about people visiting your page. The data here includes job functions, locations, and more. If you're familiar with your audience, you're able to adjust your content strategy accordingly.
Follower analytics
This section deals with the interest of people in your company. You can also link the number of followers acquired through sponsored content based on the analytics retrieved.
It also helps you to better acquaint yourself with your audience. Understanding who your audience is will help you create relevant and engaging content tailored for them.
Additionally, you can examine companies that are similar to yours in terms of:
- Total followers
- New followers vs. your company
- Number of updates vs. your company
- Engagement rate vs. your company
By doing this, you can find correlations between new followers, updates, and engagement stats. You're also able to make adjustments based on these comparisons or extrapolate further to find out what might work.
Update analytics
The first element to cover here is impressions – the times at least 50% of your update was visible for more than 300 milliseconds.
On the other hand, we have unique impressions, accounting for the number of times people saw your posts or updates for the first time.
We've all heard about clicks – it's a metric that tells you whether or not your CTA worked. These clicks are exclusively measured by the number of clicks on your post, company name, or logo. However, interactions on posts are not included here.
Another great way to measure efficacy is through engagement rate. LinkedIn adds the number of interactions, clicks, and new followers acquired, divides it by the number of impressions the post receives to get the engagement rate.
It's a lot of metrics to take in – thankfully, there are tools like Whatagraph to manage all of this.
Whatagraph analytics for LinkedIn
Analytics can bring you to the forefront of your game on social media, and LinkedIn, in this case. However, such a large amount of data may be challenging to manage.
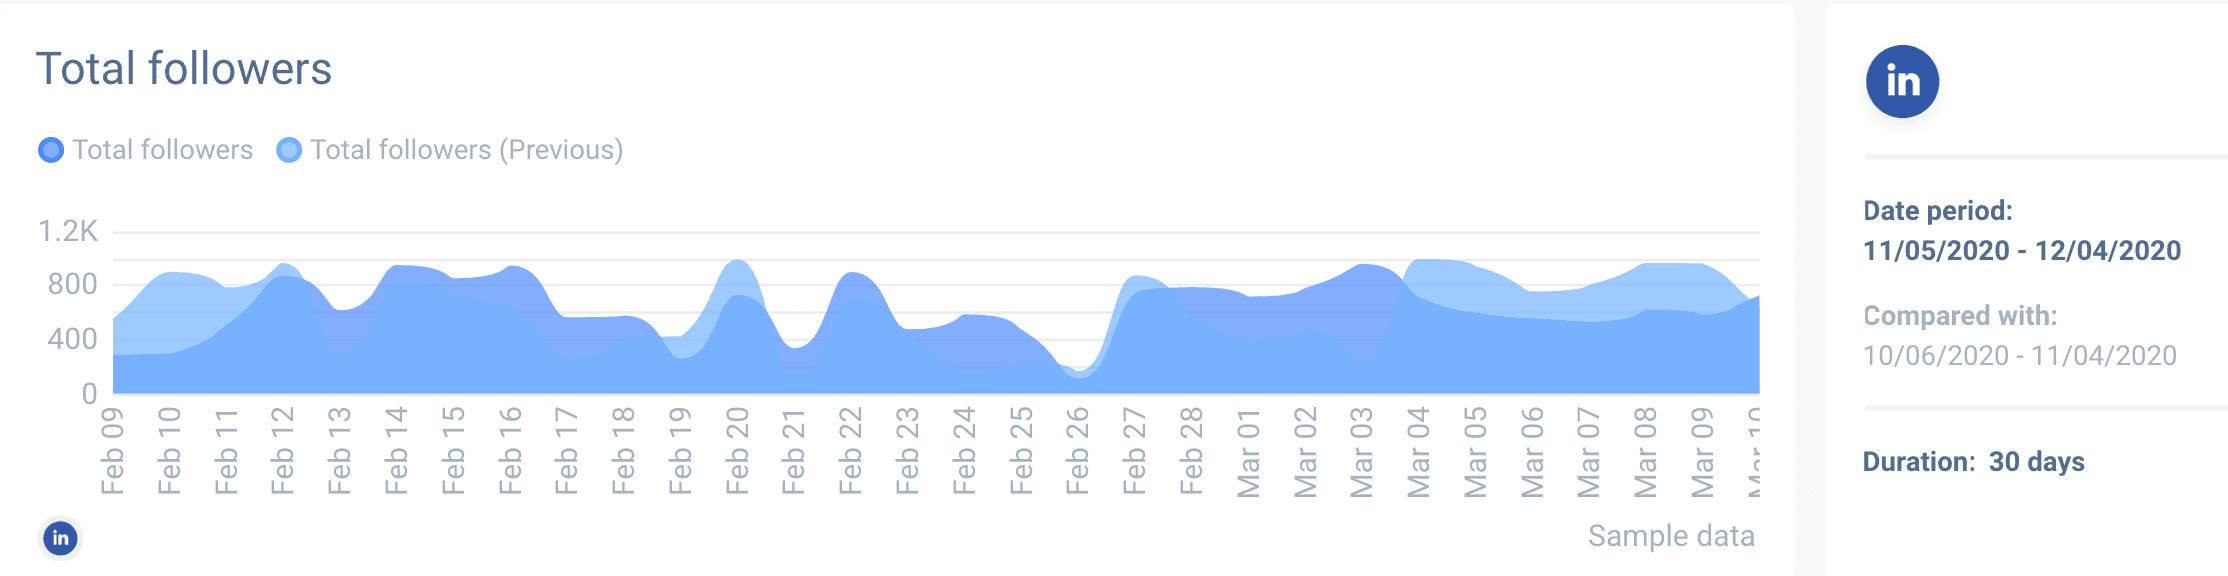
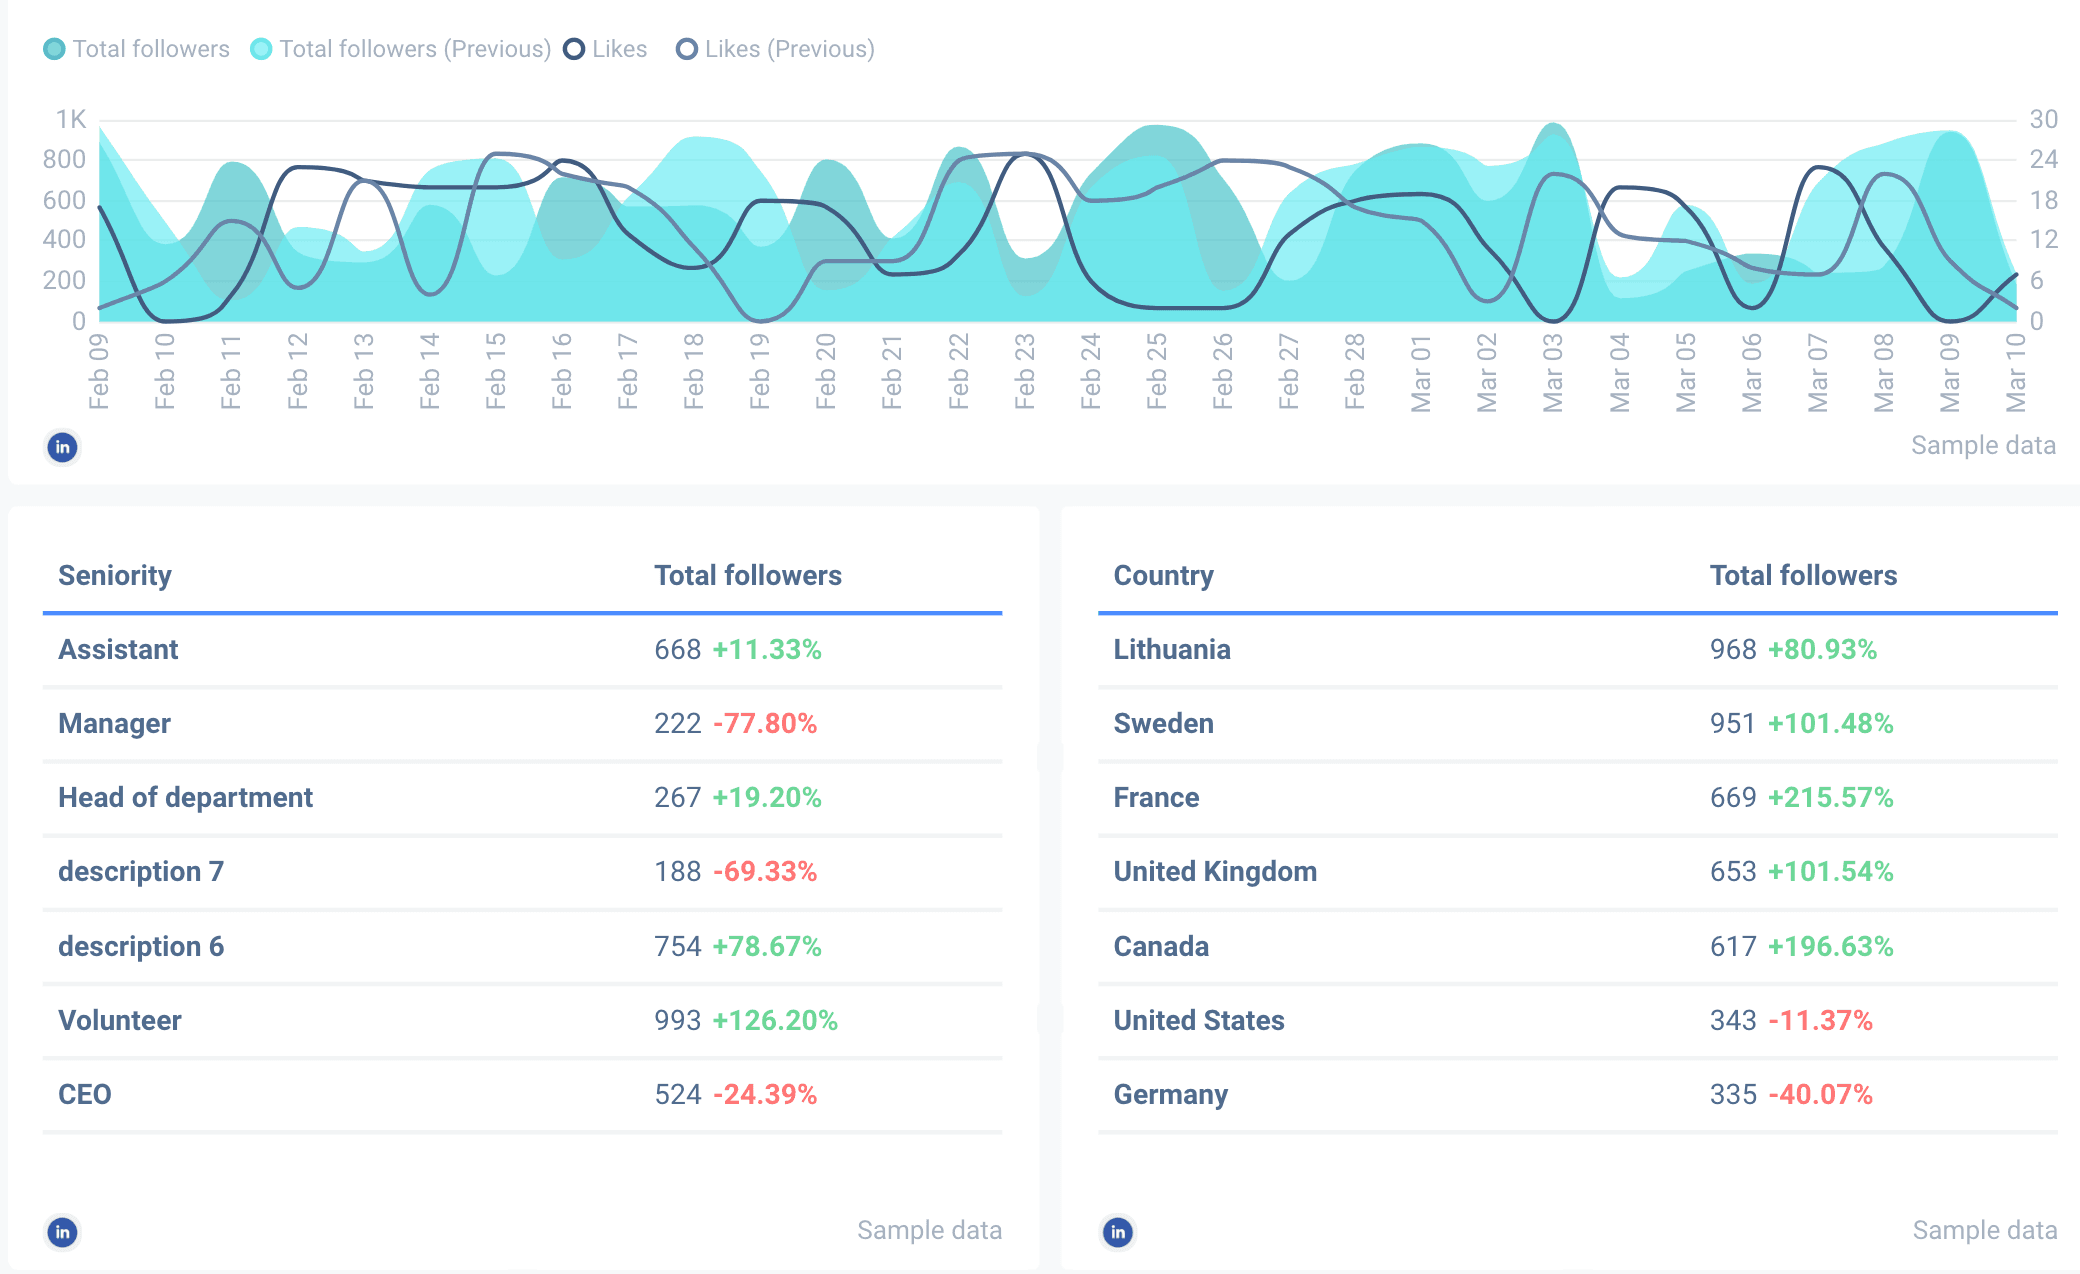
The good news is that social media analytics is simplified with Whatagraph. This automated LinkedIn reporting tool allows you to simplify complex data through visualization and reporting.
Here's an example:
Not only are the reports visually-appealing, but they're also highly functional.
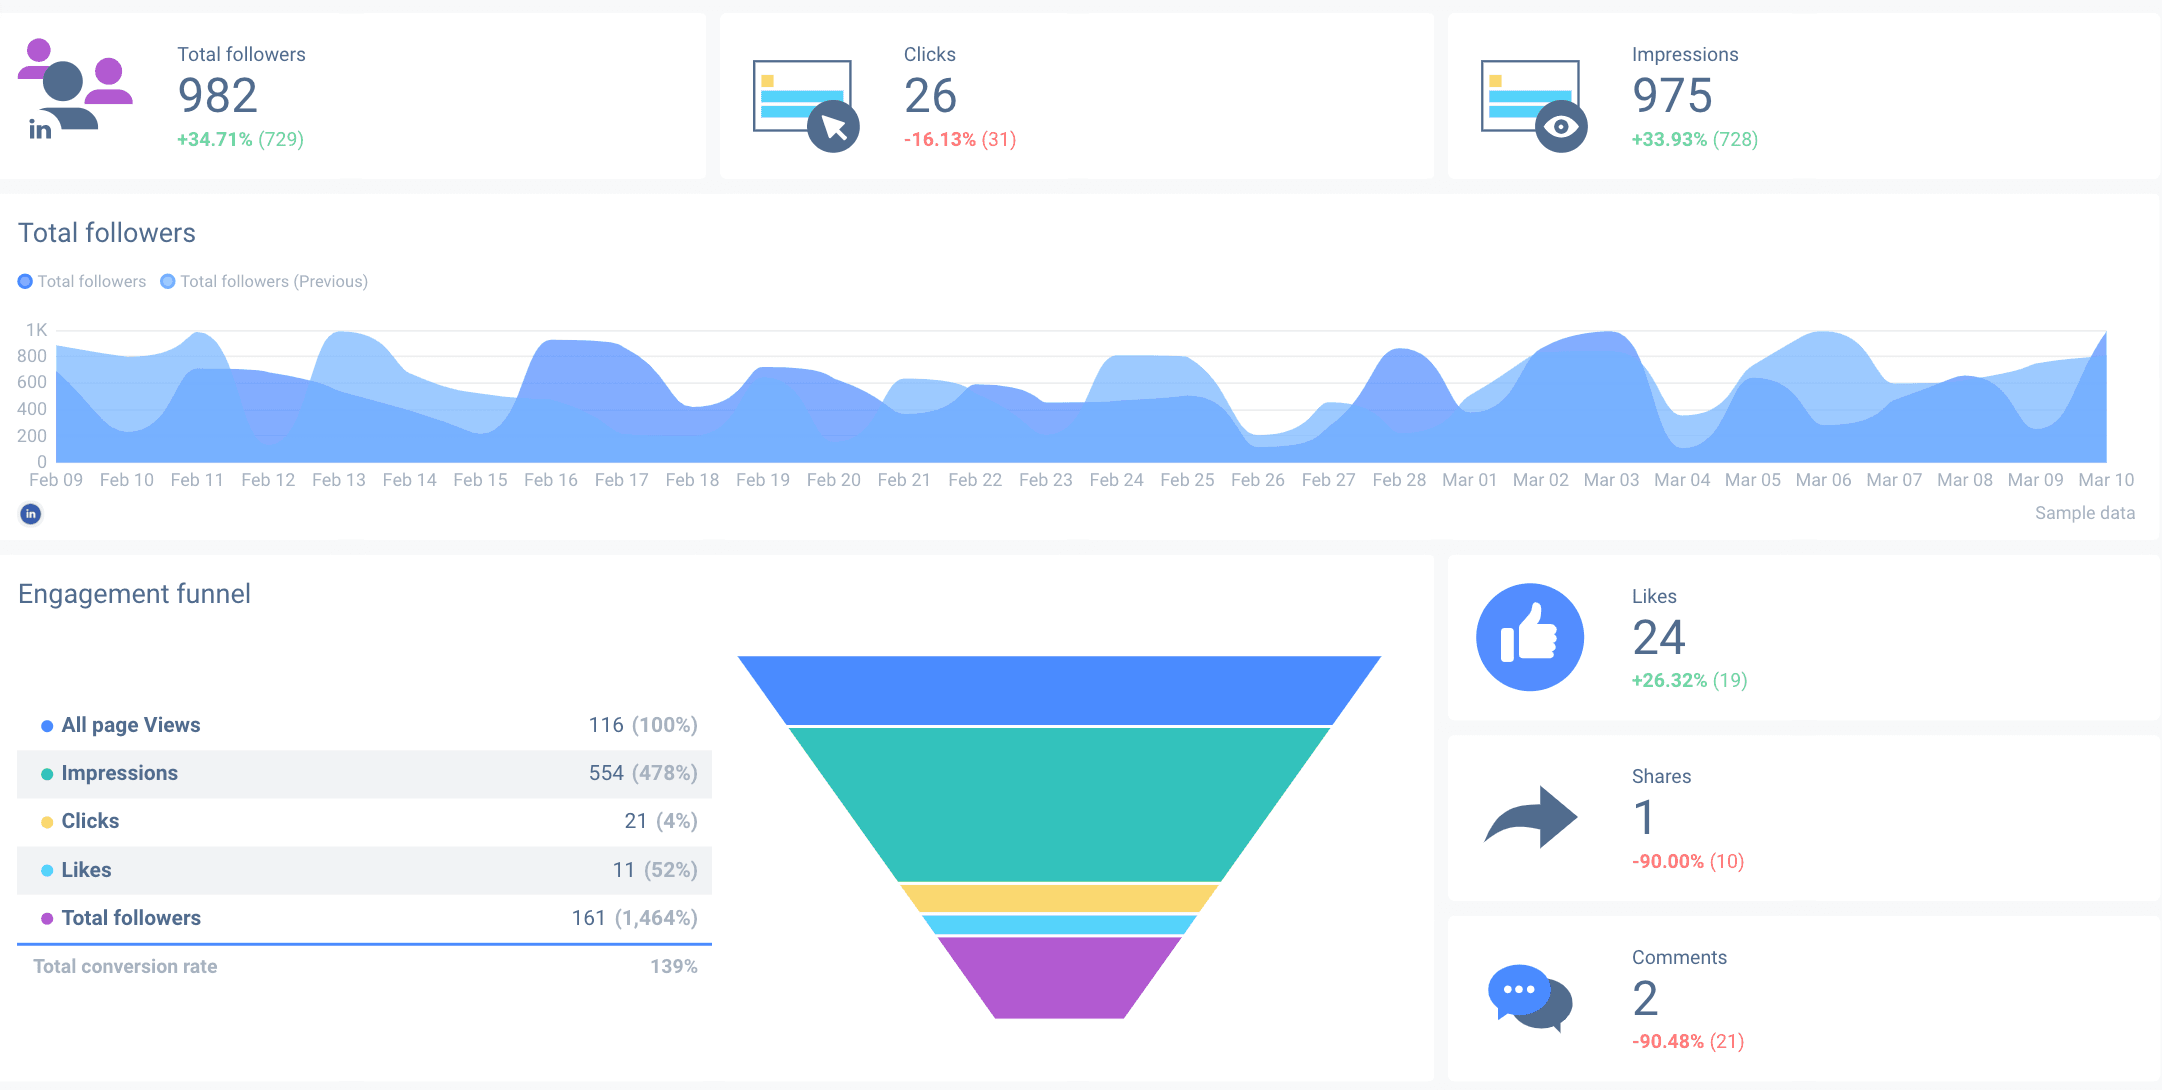
With Whatagraph and its no code connector, you can track real-time performance data, build fully customizable dashboards for analytical reports, and dive as deep into the data as you want. This makes the analytics process not only simple but actionable as well.
We actually created a free LinkedIn dashboard template for you to use. Contain and manage all of LinkedIn analytics in one place, with real-time data. Give it a try.
Published on Nov 27 2020
WRITTEN BY
Mindaugas SkurvydasMindaugas is the SEO specialist at Whatagraph with experience in driving organic traffic and improving SERP visibility for industries like B2B martech, B2B and B2C finance. He loves to be at the edge of new developments by maintaining numerous contacts with other publishers in the SaaS niche. When he’s not writing he’s pushing our technical SEO strategies into implementation.