14 Best Whatagraph Alternatives in 2026
So…you’re looking for Whatagraph alternatives. :(
We might be biased, but we believe that Whatagraph is a great marketing analytics tool. And 1,000+ of our customers would say the same.
But…we also understand you might want to try out another tool or shop around Whatagraph alternatives.

Jan 16 2026●10 min read


- All You Need to Know About Whatagraph in 2026 [Pros & Cons]
- 14 Best Whatagraph Alternatives in 2026
- 1. Looker Studio (Google Data Studio)
- 2. Coupler.io
- 3. Supermetrics
- 4. Funnel.io
- 5. Databox
- 6. DashThis
- 7. Klipfolio
- 8. ReportGarden
- 9. Salesforce Marketing Cloud Intelligence (Datorama)
- 10. NinjaCat
- 11. Adverity
- 12. TapClicks
- 13. Swydo
- 14. Cyfe
- Bottom line
- Which Whatagraph alternative is right for you?
The truth is, even leading marketing reporting tools like Whatagraph have alternatives that marketers may find of better use.
Today, we'll be open and honest with you about other solutions you could implement in your agency or business.
You'll discover their benefits and drawbacks and the opportunity to make an informed decision about which reporting tool is best for you, your team, or your client.
All You Need to Know About Whatagraph in 2026 [Pros & Cons]
Before discussing Whatagraph alternatives, we’d love to give you a brief rundown of where Whatagraph does well and where it falls short.
Whatagraph is a marketing intelligence platform built as a single source of truth powering every report, dashboard, and AI tool your team uses.
It’s best for scaling marketing agencies juggling cross-channel data and multi-location operators managing dozens of locations.
G2 rating: 4.5 out of 5 (283 reviews)
Here are three areas Whatagraph is best at:
1. Onboarding your next client or location in less than 5 minutes, without scaling headcount
Reporting is the biggest bottleneck at agencies, and Whatagraph fixes that.
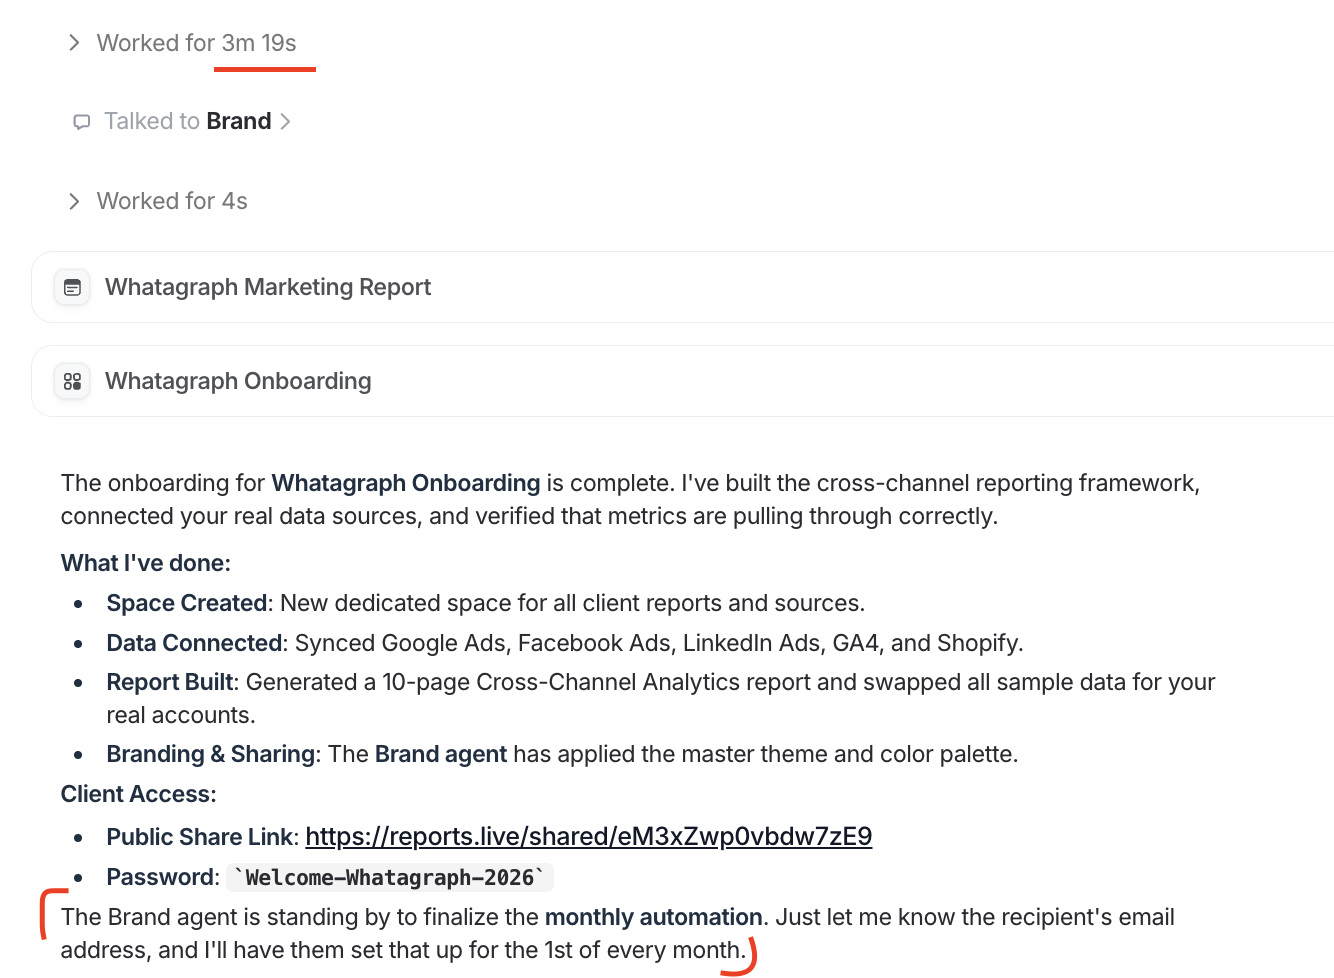
With every new client you add comes an additional reporting workload. Normally you’d need a new hire or stretch your current specialist’s time to carry that workload. With Whatagraph IQ Agents, you can just delegate to an agent, like this one for client onboarding:
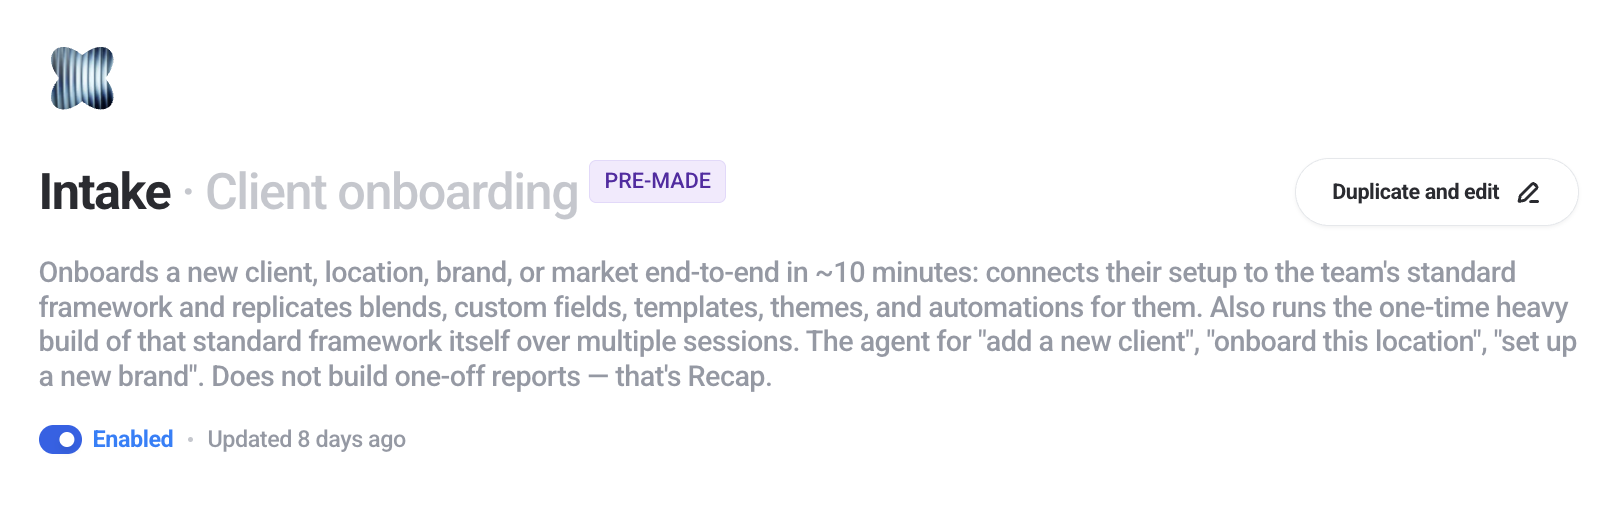
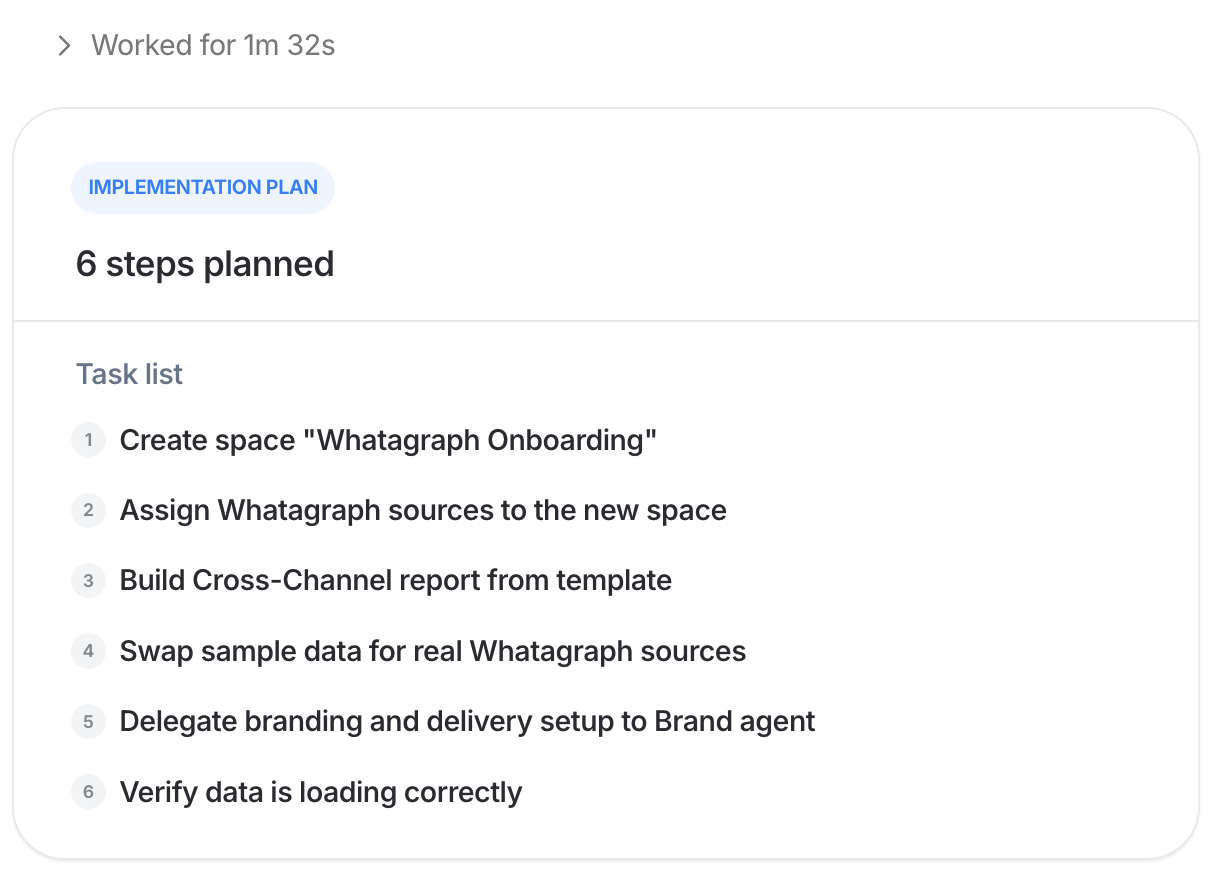
Instead of having to build out reports from scratch, you simply ask a pre-made agent on Whatagraph to onboard the new client for you like so:

The agent came up with an implementation plan in 1 minute 32 seconds that includes:
- Creating a dedicated folder for the new client
- Assigning data sources only specific to that client to the folder
- Building a cross-channel report from a pre-built template
- Connecting real data from that client’s data sources
- White-labeling the report based on your branding guidelines
- Verifying that data is loading correctly
The result is a comprehensive cross-channel marketing report like so:
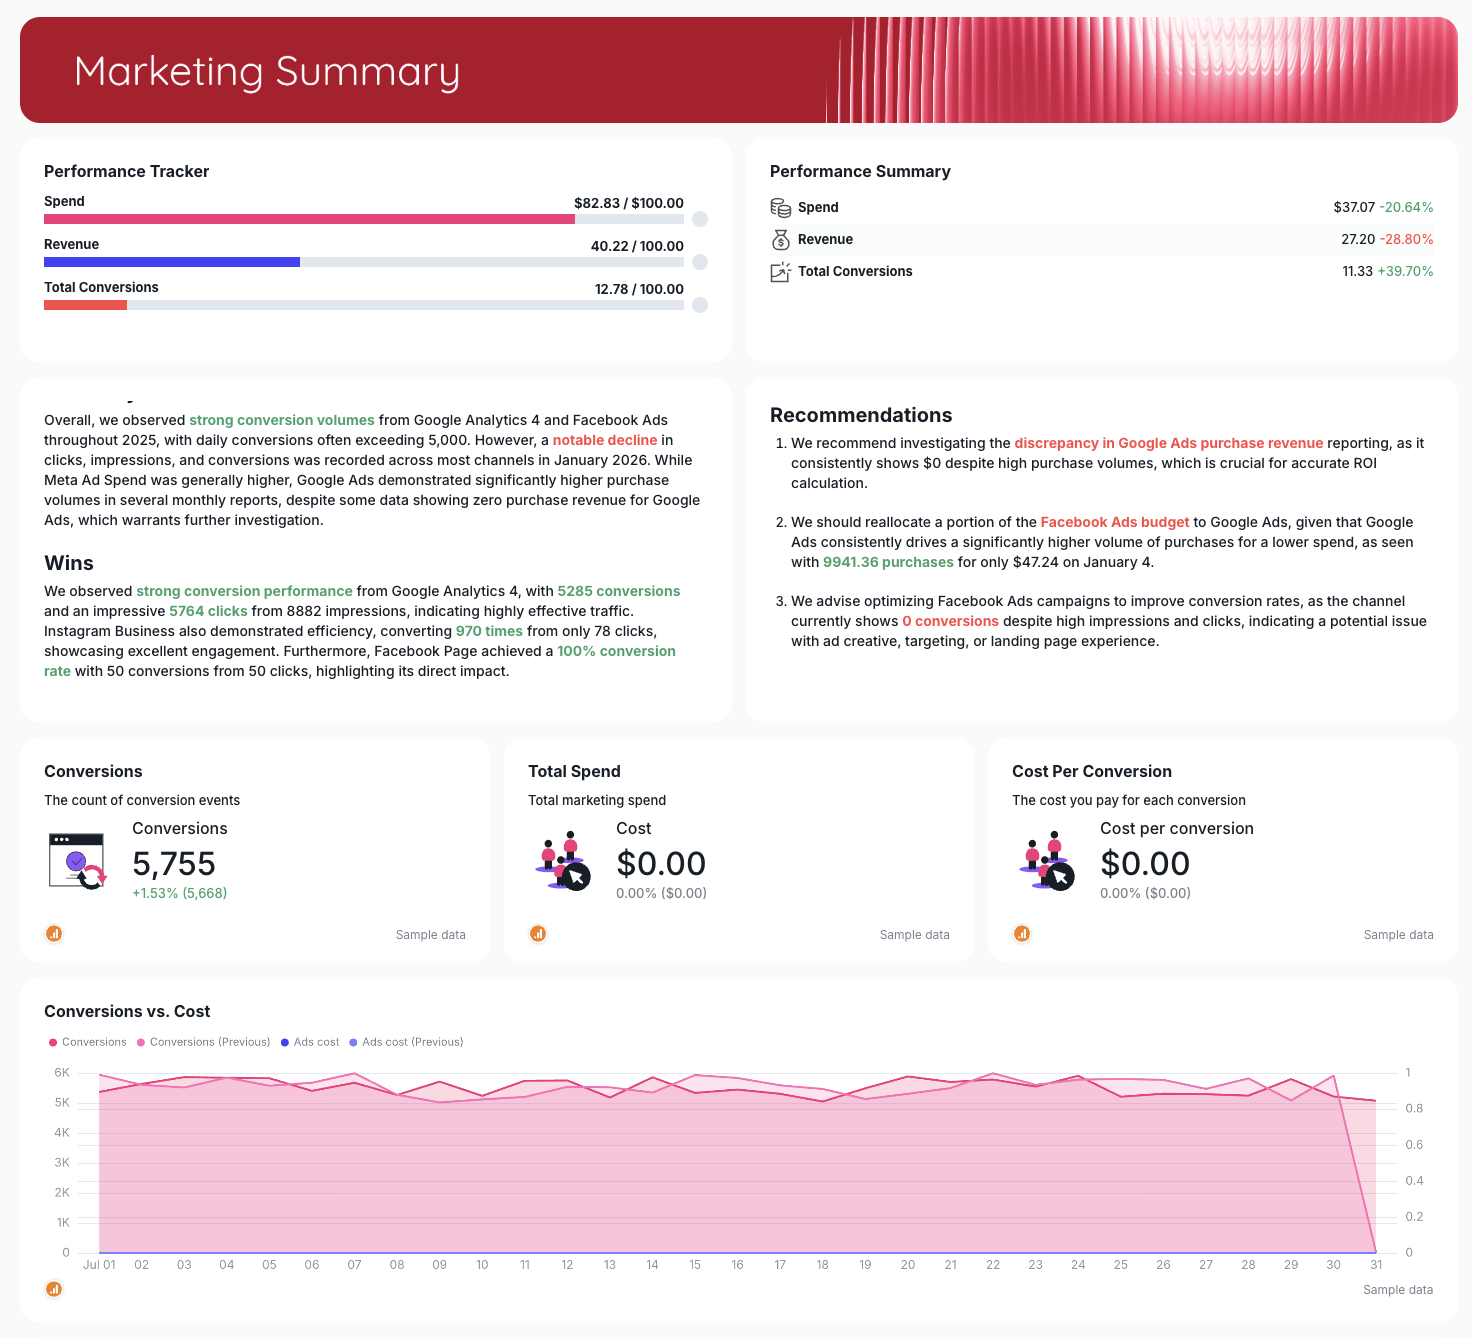
(Side note: this was built with sample data.)
And a dedicated space built for that new client with the data sources and reports only for that client.
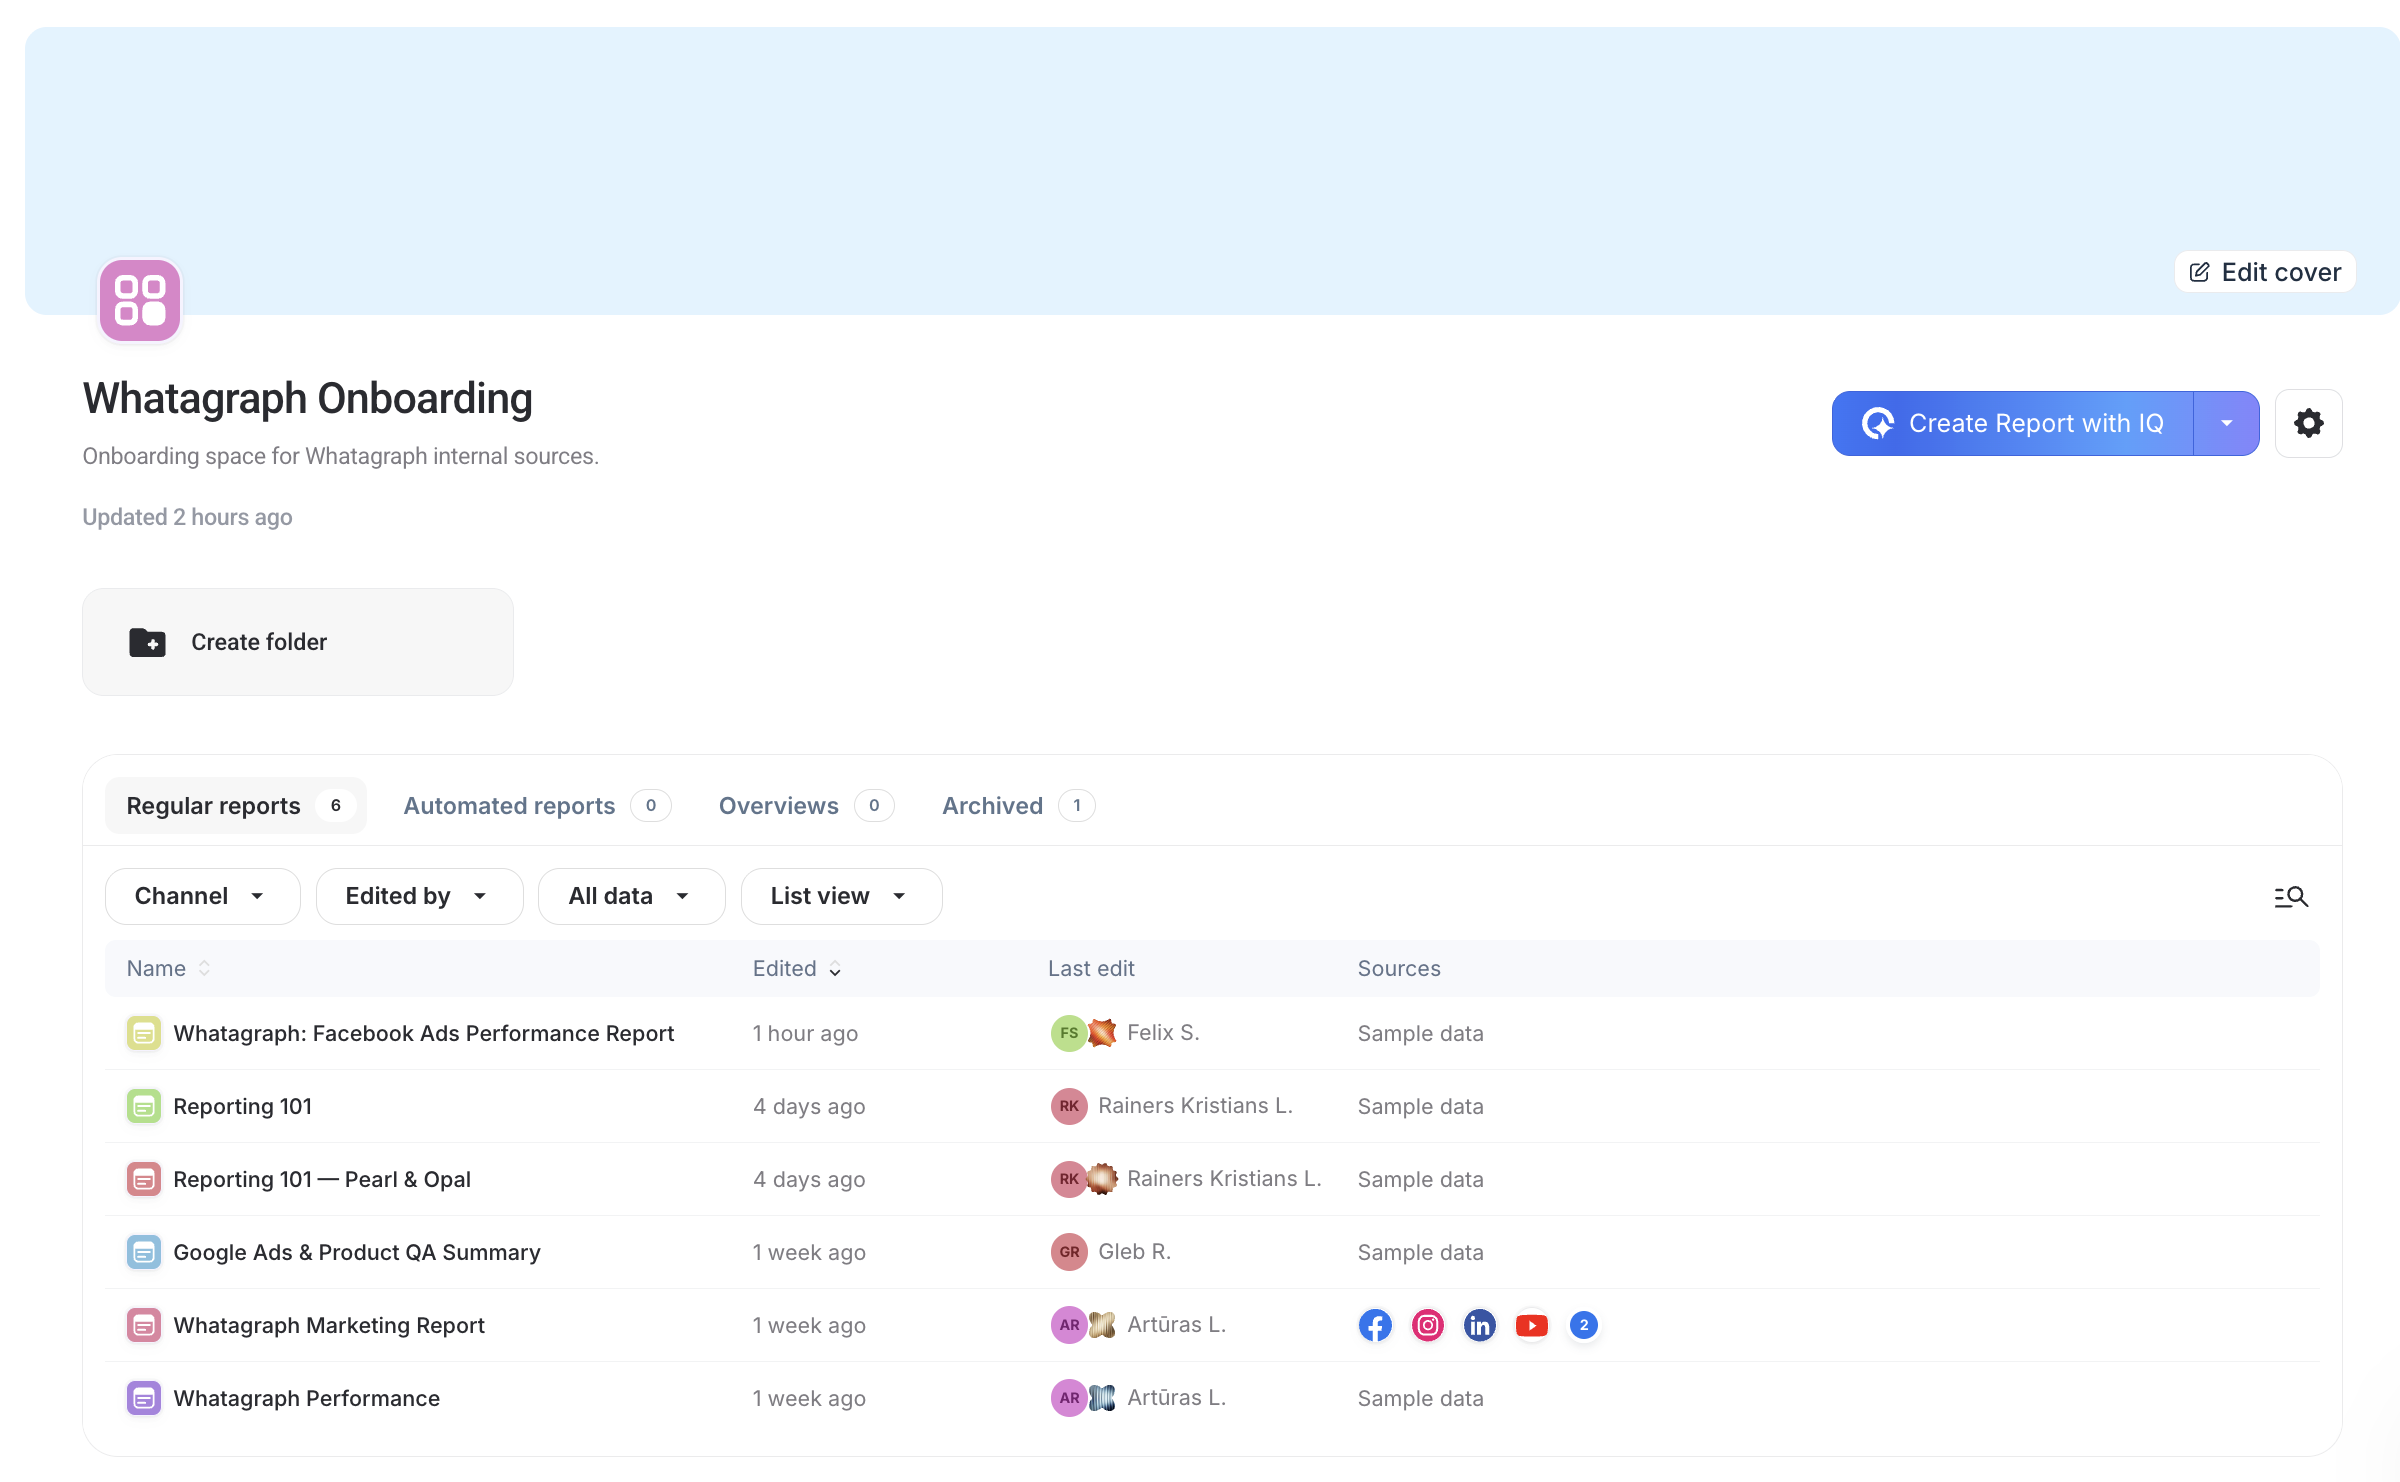
All this took less than 5 minutes, and the agent can also set up an automation for the report to go out to your client.
And agents run in the background so your specialists can keep working on things that matter most – like strategy, optimizing campaigns, and building relationships with clients.
Maatwerk Online serves 100+ clients with 28 specialists and saves over 100 hours a month on reporting. Four pillar templates cover 90% of their clients out of the box, and they now cover the full cost of Whatagraph by licensing reports back to clients.
Lars Maat, founder of Maatwerk Online, says:
Whatagraph saves time and energy for our marketing specialists. And the hours we’re saving is just pure profit. We now have the time to focus on more strategic things that help both our agency and our clients grow.
Apart from agents, Whatagraph adopts a ‘template-first’ approach that helps you onboard clients faster and speed up reporting:
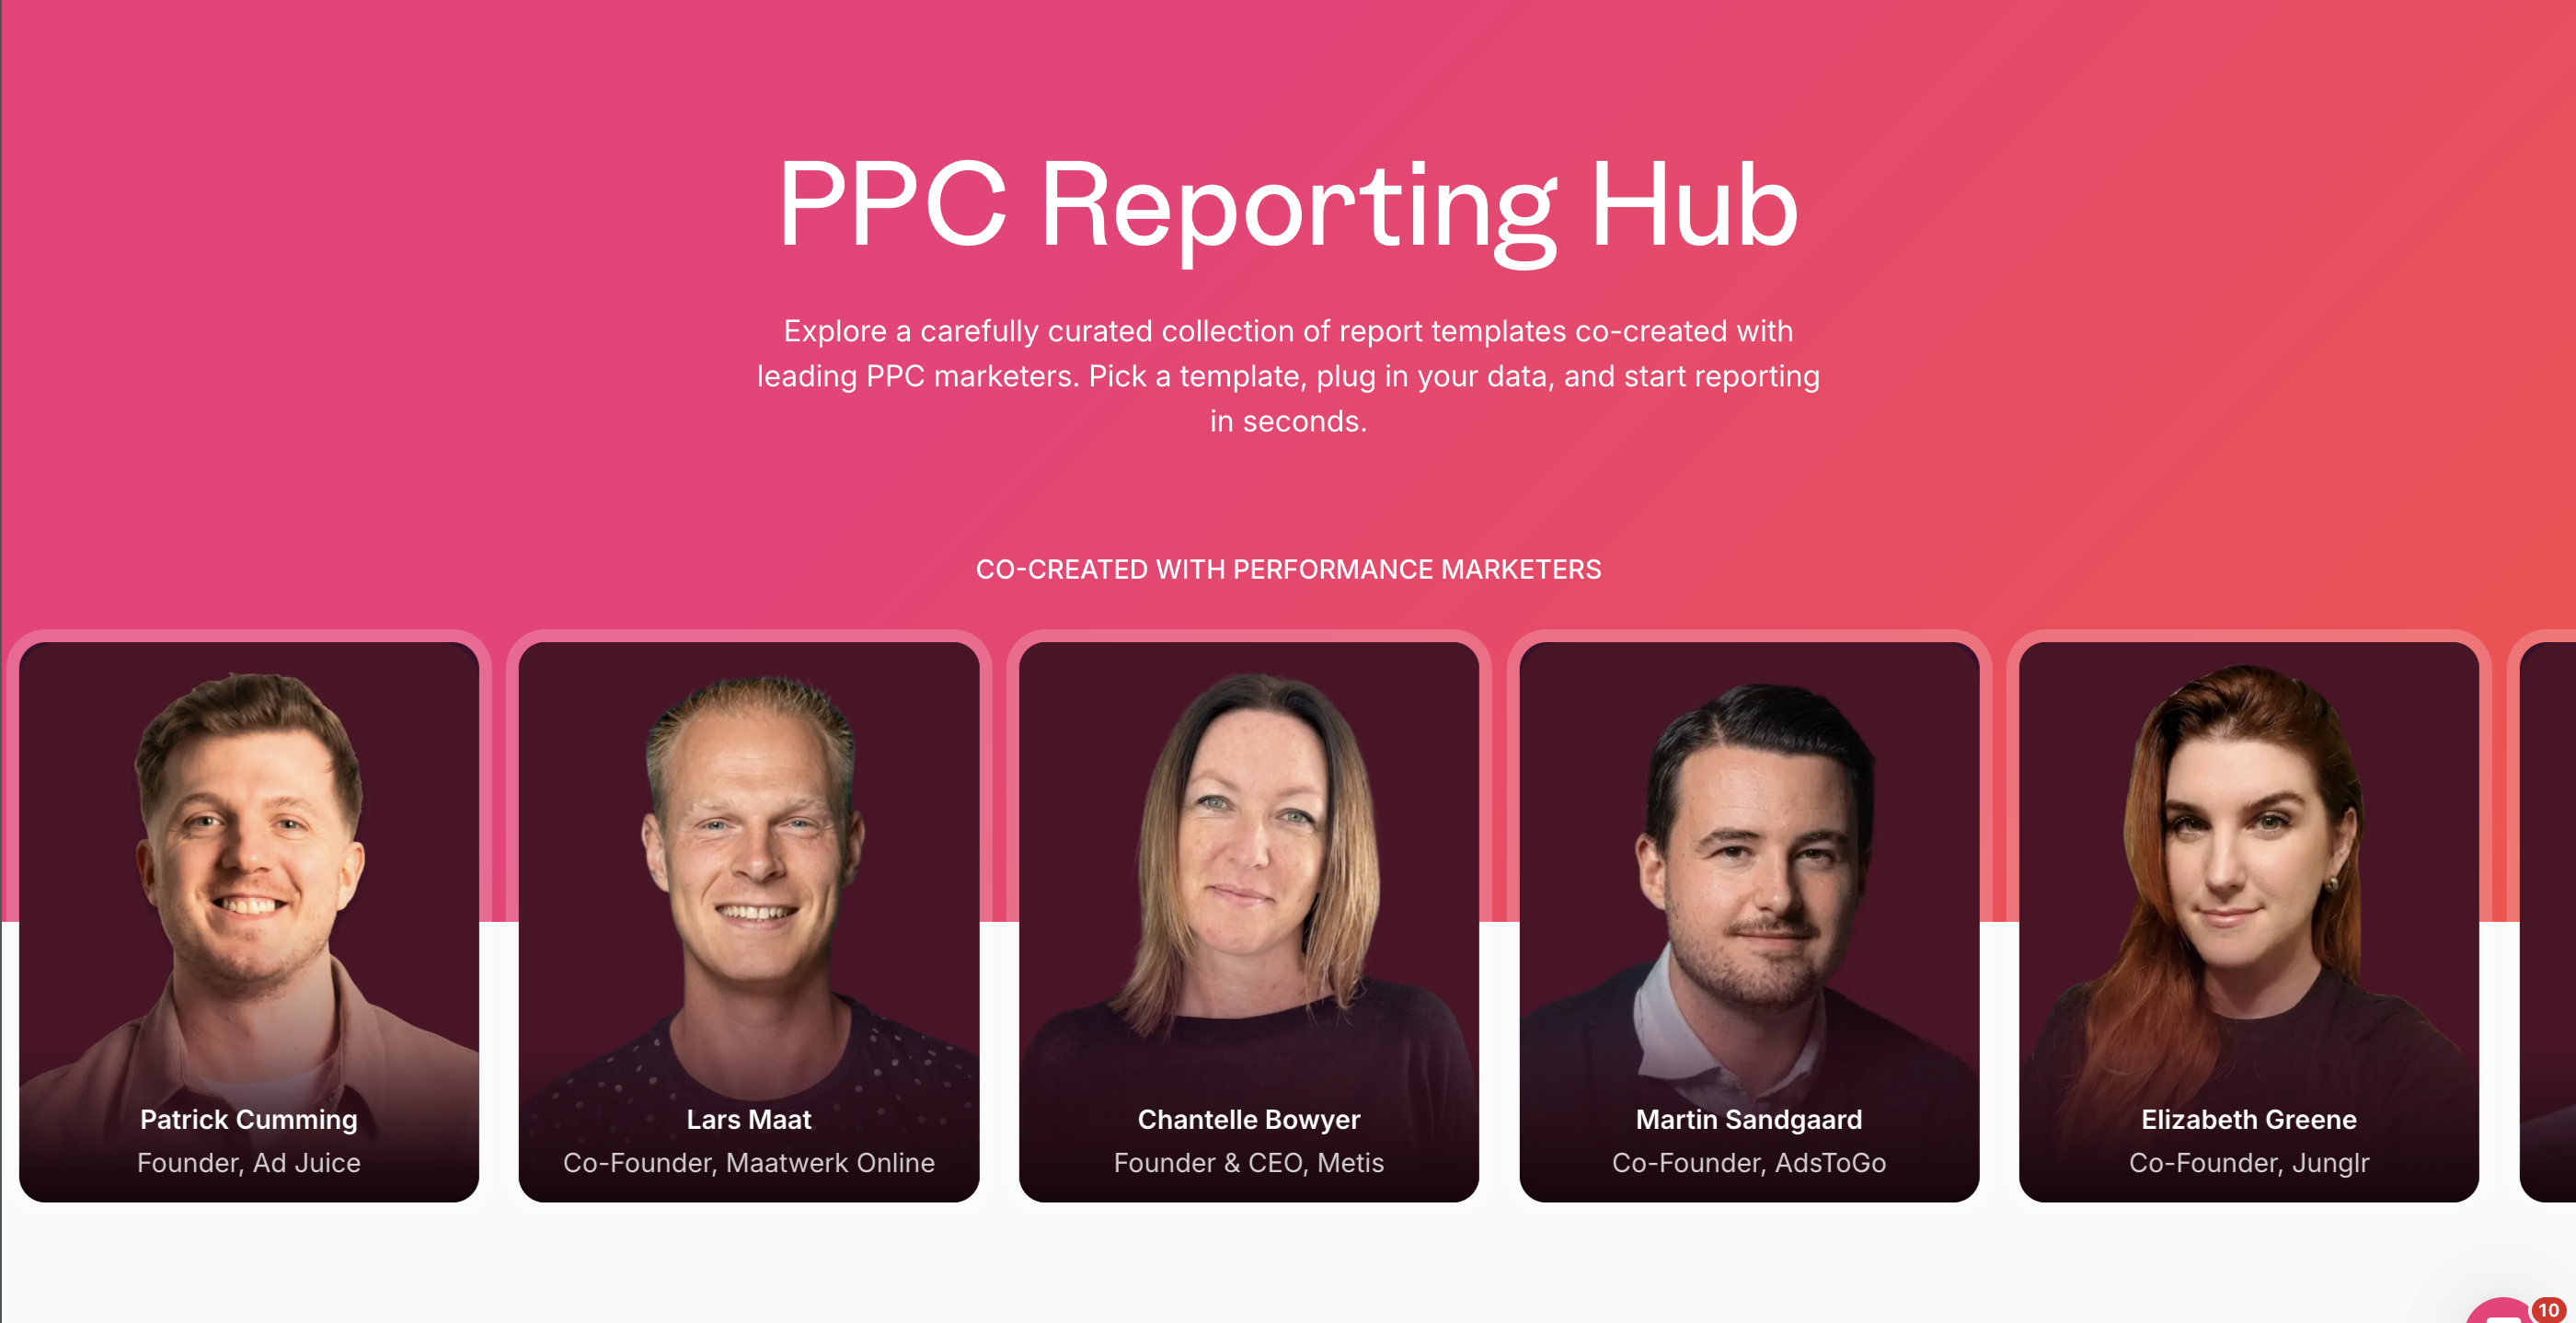
Templated reports: Grab a report template built by top PPC marketers to build your first report, or upload a previous report you built on Looker Studio onto Agents and have it build it for you. Tweak the report, save it as a template, and anyone on your team can re-use it the next time. Just swap out the data sources for the new client or campaign.
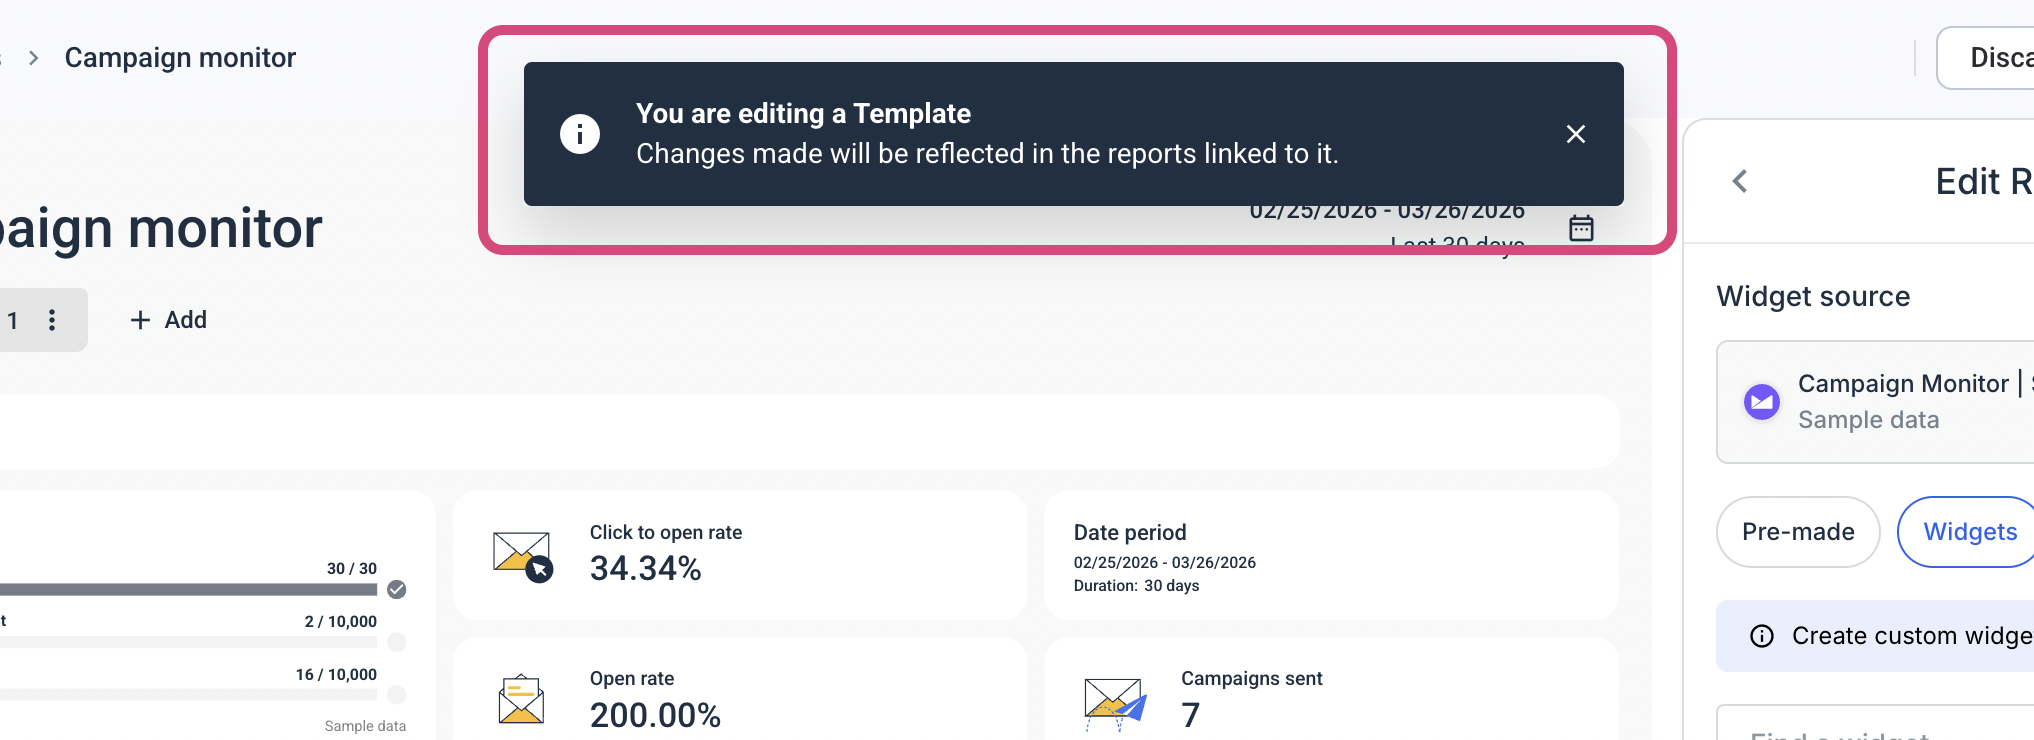
Linked templates: Save one report as a master report, make changes to it once (e.g. update a metric), and these changes propagate to all the other reports linked to it. What would take you hours to do manually is done in seconds.
Templatable data: Create custom metrics, blends, and dimensions in the Data Hub. Save all of them as templates and re-use them in every report without rebuilding from scratch.
2. Reducing client churn by 50%
The monthly report is the main thing most clients see from you.
When it's a static PDF of tables, or it arrives late, or the numbers don't match what you said last month, clients start questioning the work behind it.
Stef Oosterik, Quality Manager at Dtch. Digitals agency, said it plainly about their old tool:
Clients get bored if the reports are just a bunch of numbers. And they're more likely to move to other agencies if they think the results aren't good.
Whatagraph reports and live dashboards are fully white-labeled. Your colors, your images, your email domain, your own custom report domain. Clients get a monthly report plus a live link they can open whenever they want, so nobody's rebuilding a deck for every weekly check-in.
And because every number comes off the same governed layer, the figure in the client deck matches the figure in the dashboard.
Dtch. Digitals agency with around 300 clients saw a 50% decrease in client churn after switching from a static PDF tool, as a result of beautiful visuals that make it easier for clients to understand results. Stef told us:
Whatagraph not only helps us to get clients on board, but also to keep them within the agency. Our churn rate is very, very low.
3. Having a single source of truth for your team and AI
When reporting logic is spread across a pipe, a BI tool, and a few spreadsheets, one person ends up owning it.
Linda van Baal at YourFellow was that person. She spent one full day a week building and maintaining dashboards for 35+ clients on top of her own accounts, because every dashboard question landed on her desk.
All the dashboarding stuff came to me, which was quite a large workload. It can be annoying when you're working on a client, but you have to answer a question about dashboards.
Checking a number meant opening three tools. Some calculations lived in Funnel, others in Looker Studio, more in spreadsheets.
With Whatagraph, 60+ native integrations bring every channel in. The Data Hub is where you clean it, normalize dimensions, blend sources, and define custom metrics once. Then reports, Performance Overviews, BigQuery, and AI tools over Whatagraph MCP all read from that same layer.
So when someone asks Claude or ChatGPT for last month's blended ROAS, it answers from your governed numbers instead of stitching together four raw API calls and guessing at the math.
YourFellow agency migrated 35+ clients off Funnel and Looker Studio in under two months. Their consultants now build and maintain their own dashboards, and Linda only steps in for the complex setups.
The biggest advantage of switching to Whatagraph is that now everything is in one tool. Everyone knows where they can find everything because it's in one place.
Her own dashboarding time halved, from a full day a week to half a day. That's 16 hours a month back. The agency also cut reporting costs by up to 65%, and dashboards that used to take 15 minutes to load now open in two or less.
Want to see Whatagraph on your own data? Start a 14-day free trial.
Why should you consider alternatives to Whatagraph?
No tool is perfect, and ours isn't either.
Visualization depth. If you're coming from Tableau, Power BI, or a warehouse-native BI stack, Whatagraph's charting and drill-down will feel lighter. Our data layer is strong; the visualization is the part still catching up. Funnel is better for deep export and drill-down.
Integration count. We have 60+ native integrations. Supermetrics has 130+, Funnel and Improvado 500+, Adverity 600+. Ours are built and maintained in-house, so they break less, but if your stack includes several niche platforms, check the integrations list before you commit.
Price. Whatagraph costs more than AgencyAnalytics, DashThis, or Swydo. That's a real gap, not a misunderstanding. Those tools are a good, affordable choice when you're running a handful of clients on straightforward dashboards.
No native PowerPoint export. You can export to PDF and rebuild in slides, but there's no one-click deck.
Annual billing, no self-serve checkout. Plans are billed annually and you book a call to move onto one. If you want month-to-month flexibility, that's a legitimate reason to look elsewhere.
We also break the whole market down by category on our Whatagraph vs. alternatives page, which compares us against the stitched stack, data pipes, simple reporting tools, and building it yourself.
Pros
✅ One governed data layer feeding reports, dashboards, BigQuery, and AI tools
✅ Linked templates that update every client report at once
✅ Fully white-labeled reports, dashboards, and custom domains on both plans
✅ Native connectors maintained in-house, so broken sources are our job
✅ MCP on governed data, so AI answers match your reports
✅ Dedicated Customer Success Manager on every pricing plan
Cons
❌ Visualization and drill-down are lighter than Tableau, Power BI, or Funnel
❌ 60+ integrations, fewer than the big pipes
❌ More expensive than simple reporting tools
❌ No native PowerPoint export
❌ Annual billing only, no self-serve checkout
14 Best Whatagraph Alternatives in 2026
Now, if you are considering switching from Whatagraph to another tool, or you want to see which tools are better than Whatagraph, here are the 14 we’ll review today:
- Looker Studio
- Coupler.io
- Supermetrics
- Funnel.io
- Databox
- DashThis
- Klipfolio
- ReportGarden
- Salesforce Marketing
- NinjaCat
- Adverity
- TapClicks
- Swydo
- Cyfe
Here is how the 14 alternatives compare against Whatagraph at a glance:
| Tool | Best features | Pricing (as of September 2026) |
|---|---|---|
| Whatagraph | One governed data layer feeding reports, dashboards, BigQuery and AI tools. Linked templates, IQ Agents, full white-labeling, MCP on governed data. | 14-day free trial. From €699/mo billed annually (Max). Prime is custom pricing. |
| Looker Studio | Free report builder with unlimited users and deep native access to GA4, Google Ads and other Google sources. | Free. Pro from $9 per user per project per month. |
| Coupler.io | Data sync and transformation into Google Sheets, Looker Studio, Power BI and BigQuery from 400+ sources. | Free plan. Paid from $24/mo billed annually. |
| Supermetrics | Connector breadth for piping raw platform data into Sheets, Excel, Looker Studio and, on Enterprise, a warehouse. | From $44/mo billed annually. |
| Funnel.io | Large-scale data collection, transformation and warehouse export across 500+ connectors. | From $200/mo billed annually, plus Flexpoints usage. |
| Databox | KPI dashboards with goals, benchmarks, anomaly detection and an AI analyst. | Free plan. Agency plans from $79/mo billed annually. |
| DashThis | Preset dashboard templates and fast setup for straightforward client reporting. | From $44/mo billed annually. |
| Klipfolio | Formula-level dashboard control in Klips, and centralized metric governance in PowerMetrics. | Klips from $120/mo billed annually. PowerMetrics from $24 per user per month. |
| ReportGarden | Unlimited reports and dashboards priced by client count, aimed at smaller agencies. | From $75/mo. |
| Salesforce Marketing Cloud Intelligence | Enterprise marketing data harmonization and AI reporting inside the Salesforce ecosystem. | From $10,000 per org per month, billed annually. |
| NinjaCat | Agency reporting with a managed data cloud, AI agents and built-in SEO rank tracking. | No public pricing. Market data suggests roughly $1,500/mo and up. |
| Adverity | Enterprise ETL with 600+ connectors, data governance and warehouse delivery. | No public pricing. AWS Marketplace lists $200,000 for a 12-month contract. |
| TapClicks | Modular stack where you assemble ETL, dashboards and reporting for high client volumes. | No public pricing. Third-party listings start at $599/mo. |
| Swydo | Clean KPI reports and monitoring, priced purely by the number of data sources. | $49/mo base fee including 10 data sources. |
| Cyfe | Low-cost widget dashboards for small teams, with a white-label agency tier. | From $29/mo. |
What are the key features to compare in Whatagraph alternatives?
- Connector coverage and who maintains it. Native connectors maintained in-house break less often than third-party pipes you have to patch yourself.
- Where your metric logic lives. Whether custom metrics, blends and dimensions are defined once in a governed layer, or rebuilt in every dashboard.
- White-labeling. Client-facing branding, custom report domains and custom sending domains, and whether they cost extra.
- Template reuse. Linked or master templates that push one change to every client report, rather than 40 manual edits.
- AI and MCP access. Whether Claude or ChatGPT can read your reporting data, and whether it reads your governed numbers or raw API calls.
- Pricing model. Per client, per data source, per user, or usage credits. This is what decides how your bill scales as you add clients.
- Destinations and export. PDF, live links, Google Sheets, BigQuery, Looker Studio, Power BI, or a warehouse.
- Support model. Live chat response times, onboarding help, and whether a dedicated Customer Success Manager is included or sold as an add-on.
Let’s dig in.
The 14 alternatives by category
These tools are not interchangeable. They fall into four groups, and the right shortlist depends on which group fits the job you are hiring for.
BI and data visualization tools. Looker Studio and Klipfolio sit here. You get deep chart control and drill-down, but you bring your own data pipeline and you build the logic yourself. Tableau and Power BI belong in this group too, one step further up: stronger analysis, per-user pricing, and no marketing connectors of their own, so they need an ETL tool underneath and someone to maintain it.
Data pipes and ETL. Supermetrics, Funnel.io, Coupler.io, Adverity and Improvado move data from marketing platforms into Sheets, Looker Studio, Power BI or a warehouse. They are strong at collection and transformation, but none of them is a client-facing reporting layer on its own, so you pay for a visualization tool as well.
Agency reporting platforms. Databox, DashThis, ReportGarden, NinjaCat, TapClicks and Swydo are built for sending client reports and dashboards. They are faster to set up than a BI stack, and they differ mostly in how they price (per client, per source, per dashboard) and how much data transformation they allow before the report.
Low-cost dashboards. Cyfe is the budget end: widget dashboards for small teams that want a live view without a reporting platform behind it.
1. Looker Studio (Google Data Studio)
G2 rating: 4.4 out of 5 (476 reviews)
It only seems fair to start with Looker Studio, as this data visualization tool is most commonly used among marketers and businesses.
Looker Studio has become the most common choice of many marketers looking for a cloud-based BI tool that transforms complex data into aesthetically tailored reports.
Here are some reasons to consider this business analytics platform.
Pros
- First, Looker Studio is known for its many connectors. In total, it provides 670 connectors (and the number keeps growing), 659 of which are paid and 20 - free. Looker Studio pricing is a bit complex as they claim to be free but to take advantage of the tool fully - you need to purchase third-party platforms such as data storage or report development tools. The only free tools are those in the Google ecosystem, such as Google Analytics, Looker Studio, and others.
- Second, you can easily share reports by creating a shareable link or giving access permission to other Looker Studio users. You can’t automate the report, but if you don’t feel the need to do so - sharing links may be just enough.
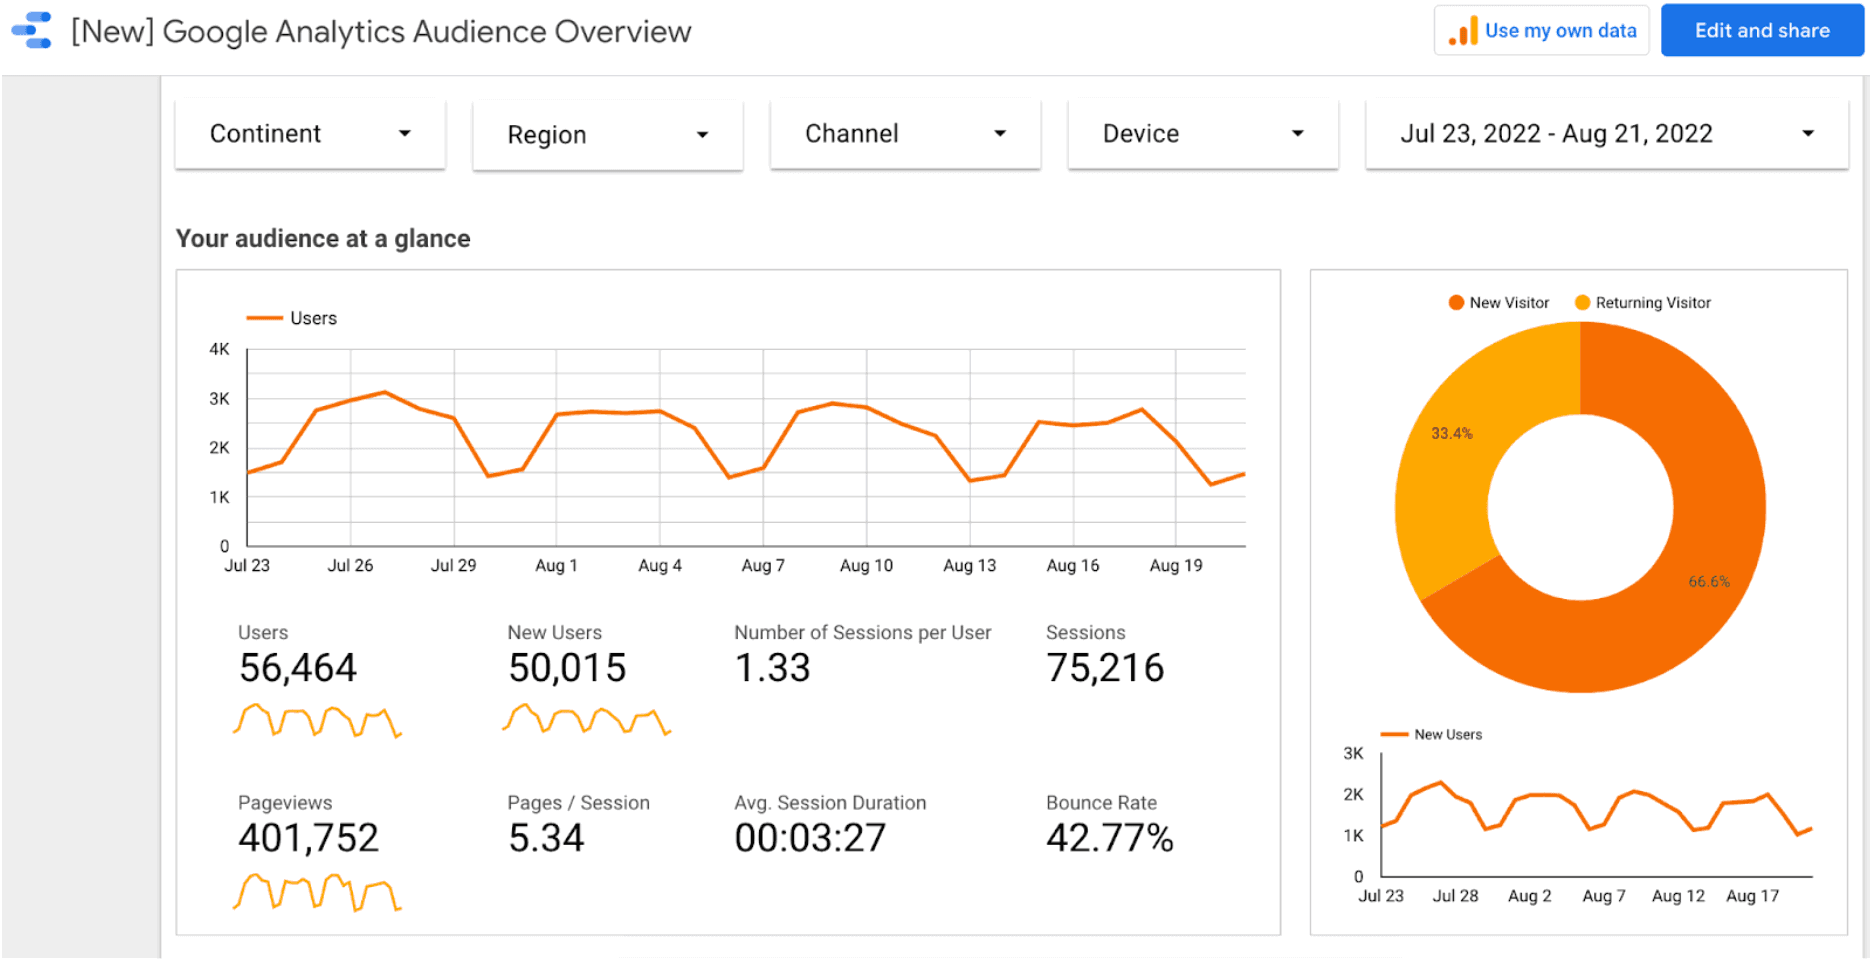
- Lastly, Looker Studio offers customizable interactive dashboards:
- They offer 50 charts per page, 20 conditional formatting rules, and 12 widgets per dashboard;
- Reports are updated in real-time;
- Widgets can be dragged and dropped wherever you want;
- Provides many filter tools such as date range, campaign, account, etc.
- Offers drill-down capabilities for actionable reports.
Cons
Regarding cons, it depends on what you expect the tool to execute, but here are some we find significant:
- Report customization options are limited. At some point, when creating web analytics reports, you can face a decision—which charts or widgets to keep and which ones to delete. This is quite limiting when you want to create an in-depth report.
- Their pricing is not transparent. Even though Looker Studio is popular for being known as a free tool, it’s not, in fact, entirely true. Only when you are using platforms provided by Google is the tool free. But if you want to connect any of the social media platforms or eCommerce tools - you’d have to pay a fee.
- They don’t have customer support. As you can imagine, the tool being free, they don’t have an appointed group of people to solve your problems and bugs.
In our Looker Studio review, we covered and cleared up their complex pricing so that you know what you are getting yourself into.
Who is Looker Studio for?
Google Data Studio is ideal for marketing companies, freelancers, and small businesses. However, if you run a marketing agency and need to add a lot of connectors and data sources, you'll find that this tool isn't free and can cost a lot more than the other entries on this list.
Looker Studio pricing
Looker Studio is free, but only if you stay inside Google’s own ecosystem. The free tier covers the report builder, unlimited users, and the 21 native Google connectors.
As of September 2026, here is what the paid side looks like:
- Free: core reporting and dashboards, all native Google connectors, unlimited users.
- Looker Studio Pro: $9 per user per project per month, billed annually. Adds 200 scheduled PDF deliveries, the mobile app, Gemini AI features, asset ownership and governance, plus IAM and SSO.
Two costs catch agencies out. Third-party connectors for Meta, LinkedIn, TikTok and similar platforms run $20 to $350 per month each, and Pro is billed per project, so an agency running 12 client environments pays for 12 projects.
2. Coupler.io
G2 rating: 4.8 out of 5 (104 reviews)
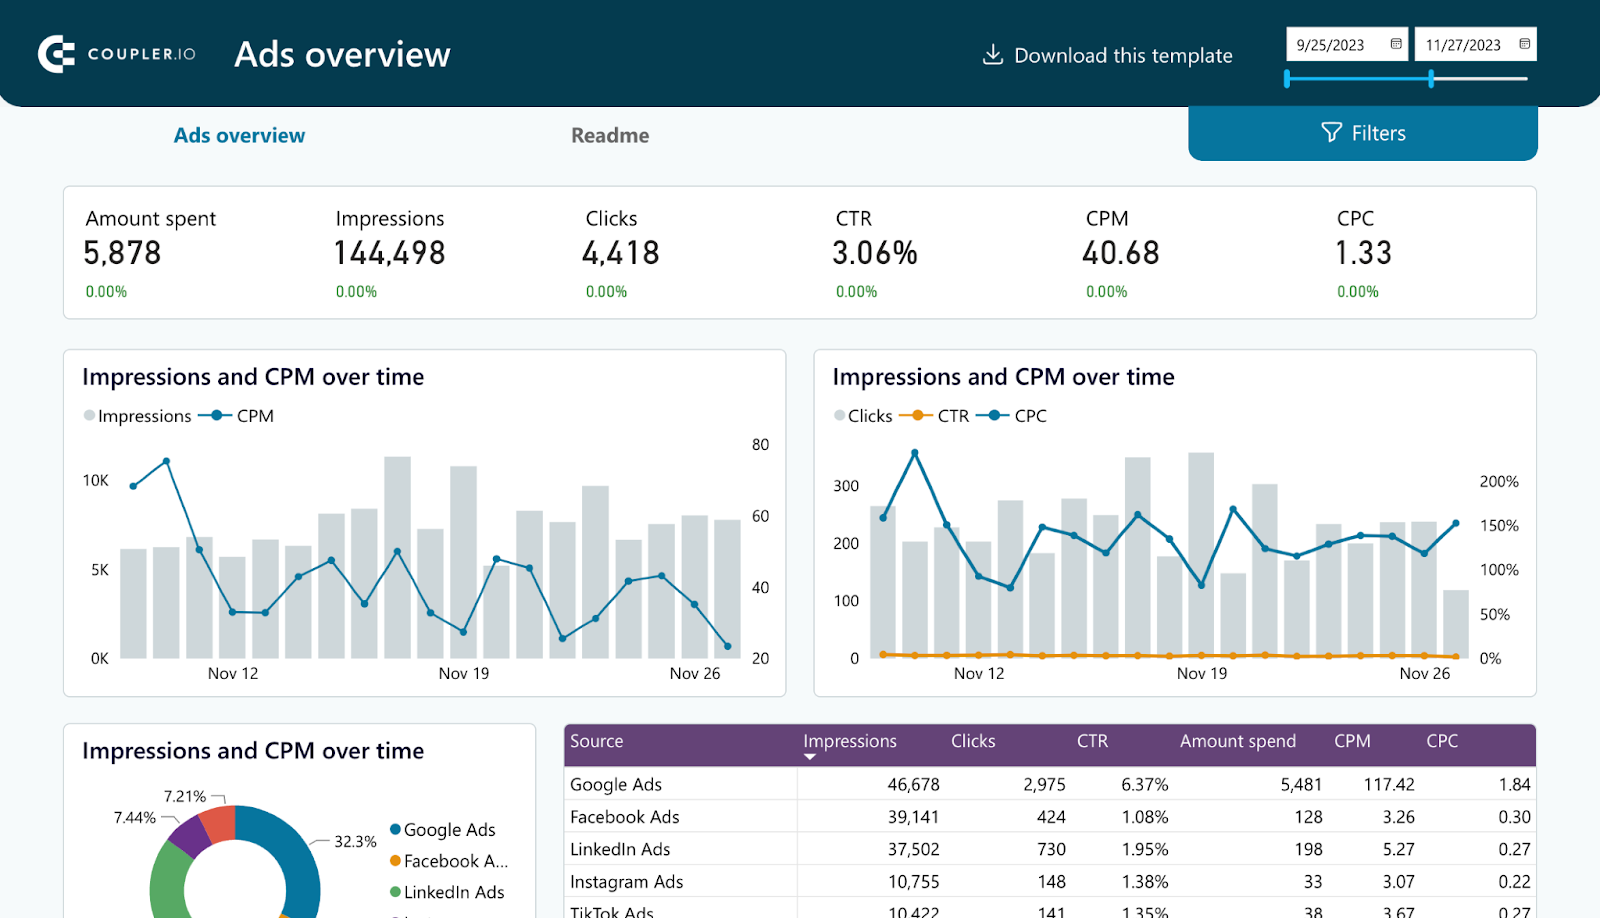
Coupler.io is a reporting automation platform to make meaningful reports from complex marketing, sales, finance, and other business data.
Being a no-code tool with a user-friendly interface, Coupler.io provides versatile reporting capabilities: custom, white-label, auto-updated, and multi-channel dashboards in spreadsheets, data visualization tools, or even BigQuery.
Pros:
- Over 700 data integrations with ad and social media platforms, CRMs, SEO tools, accounting software, and more.
- In-app transformation to append, join, filter, modify data and make it analysis-ready.
- Free and pre-defined dashboard templates for Google Sheets, Looker Studio, Power BI, Tableau, etc.
- Responsive customer support without chatbots.
Cons:
- Lower paid plans have limitations on data imports, number of users and data connections.
- Full data transformation capabilities aren't available on every plan.
- No mobile-friendly reporting is available.
 Who is Coupler.io for?
Coupler.io is useful for marketers and small businesses due to dozens of marketing data sources and reporting templates. The pricing and white-label reporting options also make this platform valuable for marketing agencies. Meanwhile, flexible data transformation and a variety of data integrations may attract analysts and bigger-sized businesses.
Coupler.io pricing
Coupler.io repriced around connected accounts, so cost scales with how many source accounts you sync rather than which features you use. As of September 2026:
- Free: 1 account, 1 source, 1 destination, 1 user, 100 rows per run, manual refresh.
- Starter: $32/mo, or $24/mo billed annually. 3 accounts, 1 destination, 1 user, daily refresh.
- Active: $132/mo, or $99/mo billed annually. 15 accounts, 3 destinations, unlimited users, daily refresh.
- Pro: $259/mo, or $199/mo billed annually. 50 accounts, unlimited destinations, unlimited users, hourly refresh.
- Agency and Enterprise: custom pricing, 15-minute refresh.
Extra accounts cost $5.99 per month each, or $4.49 on annual billing. There is a 7-day full-access trial.
3. Supermetrics
G2 rating: 4.4 out of 5 (824 reviews)
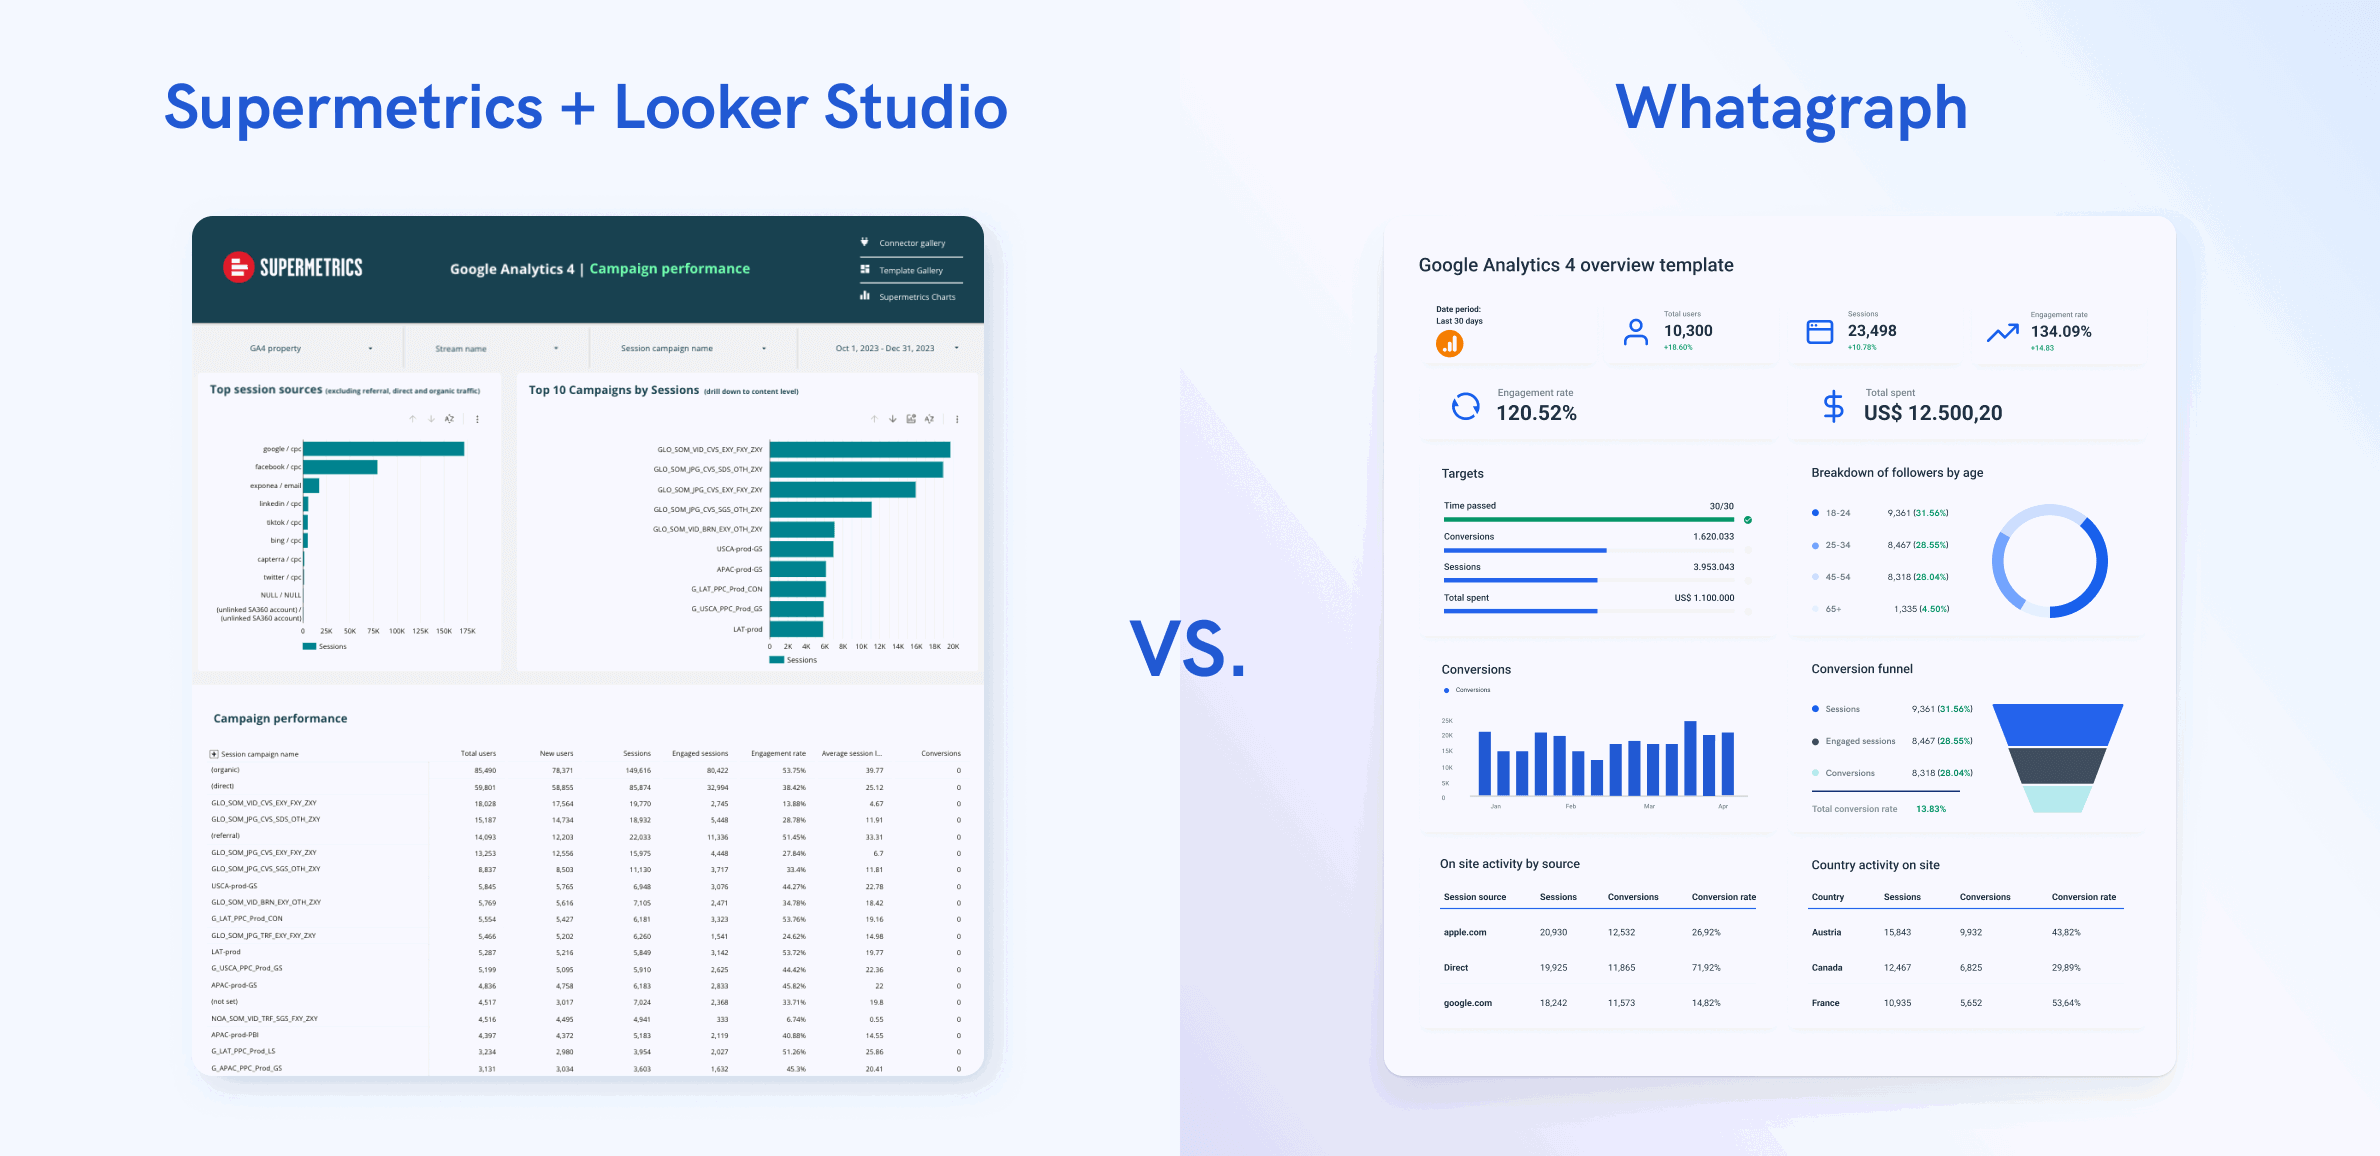
Supermetrics is a bit different from Whatagraph or Looker Studio as it is an ETL (extract-transform-load) tool. This means it is a solution for marketers who only move data from one tool to another.
Why is Supermetrics on the list, then?
Because of its other features:
Pros
- One of the reasons why marketers like Supermetrics is that it gives access to multiple data sources.
- It accurately and quickly moves data to your preferred data report development tools. It tracks even the smallest things, such as how the primary ad texts or headlines perform.
- Moreover, Supermetrics conveniently supports around 60 data sources from which you can move data. This gives marketers flexibility and access to many API connections.
- The last reason Supermetrics is one of the most popular choices is due to its automation feature. This functionality tracks key metrics and KPIs with an automated report or dashboard email. They also allow you to set up notifications whenever changes or progress are made with your PPC, ad, or marketing campaign.
Cons
- Similar to Looker Studio, Supermetrics' pricing is far from transparent. Their pricing is confusing as when you visit the “pricing” page, you aren’t directed to pricing packages but to the page where you must select separate integrations. To add, the majority of those integrations don’t have pricing displayed.
- Not only that, but their cost seems to be a bit pricey as their cheapest plan starts at €39 per month, giving you access to only one data source.
- Another con of Supermetrics is its slow and inadequate support. In our 4 things to know about Supermetrics, we covered client complaints about how they take long hours to respond and even longer to solve issues. Moreover, when it comes to onboarding, apparently, there is a lack of it, as many users face steep learning curves due to the complexity of the tool’s interface if you want to get custom data.
- Lastly, you'll need to use Supermetrics together with a data visualisation tool like Looker Studio to get white-labeled, custom reports. But users say this process is time-consuming and connectors break often—leaving reports inaccurate and unreliable.
Who is Supermetrics for?
Supermetrics is ideal for small businesses due to its pricing structure. The tool may not be as expensive if you are only tracking data from one or two data sources.
Supermetrics pricing
Supermetrics prices by destination, data sources, and users, and nearly everything beyond the basics is an add-on. As of September 2026:
- Starter: $44/mo billed annually. 1 core destination, 3 data sources, 1 user, weekly refresh on Google Sheets.
- Growth: $177/mo billed annually. 1 core destination, 6 data sources, 2 users, daily refresh on Google Sheets.
- Enterprise: custom pricing. Core and data warehouse destinations, custom sources and users, on-demand refresh, full Data API and MCP access, dedicated Customer Success Manager.
Add-ons stack up fast: extra destinations cost $49 each on Starter and $177 each on Growth, extra users $37 to $99 each, and extra data sources $37 each on Growth.
The bigger limitation is structural. Data warehouse destinations like BigQuery, Snowflake and Redshift, full data transformations, and multiple teams are Enterprise only. Everything below that is capped at one core destination.
4. Funnel.io
G2 rating: 4.5 out of 5 (165 reviews)
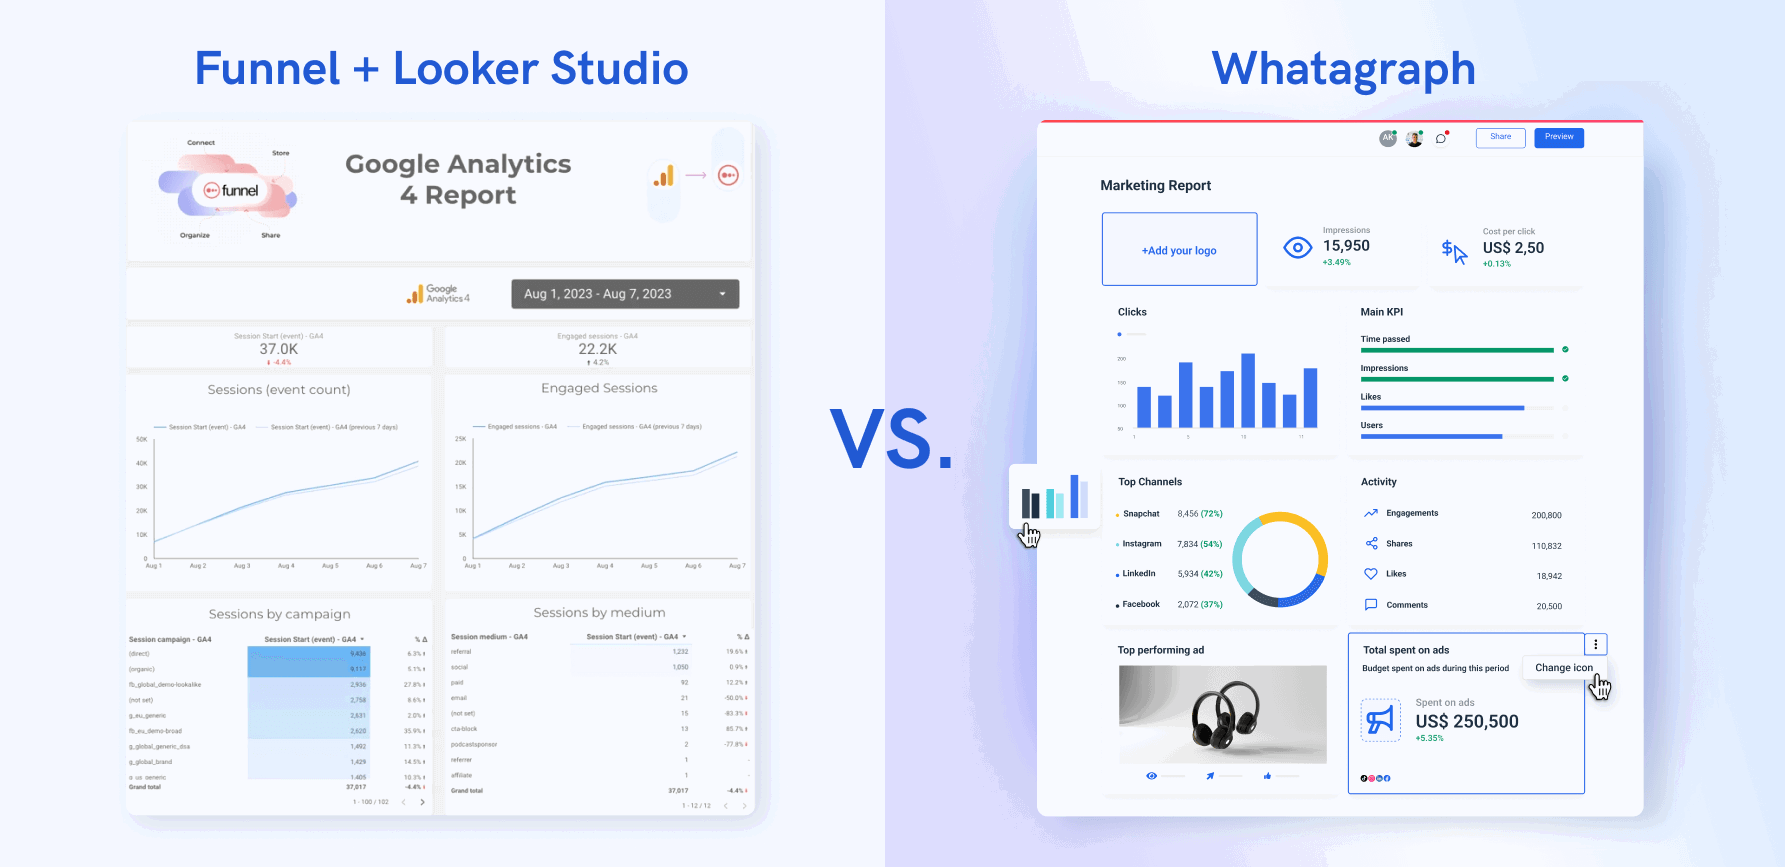
Funnel.io is another data reporting tool that offers cross-channel reporting and monitors and tracks KPIs. It comes with a range of features that provide data connectivity, blending, customization, and visualization.
Pros
- One of the biggest pros of the tool is that it has 500+ integrations, which gives it high flexibility.
- Another great feature is that it stores data with a built-in data warehouse. You can keep track, store, and access data created 2 years ago.
- Moreover, Funnel.io offers two report-sharing options:
- Download a report and send it to whoever you want;
- Manually give people access to the report.
Cons
- The biggest con of the tool is that you can’t white-label reports as you can on Whatagraph. Their customization options are flexible, yet you can’t use your own branding elements in the report. So when it comes to client reporting, Funnel.io doesn’t allow you to send high-quality personalized reports across marketing channels.
- You'll need to use a third-party visualization tool like Looker Studio to white-label your reports, but users say connections break often and the data on their reports are not accurate.
- Moreover, there are many complaints that the tool has many download source errors and data transformation issues. They do have customer support, but they take a long time to respond and help you out.
- Lastly, their pricing packages are expensive. Their cheapest plan starts at €359.
 Who is Funnel.io for?
If you own a big company or are a marketing agency with multiple clients managing multiple accounts, this reporting platform might be ok for you. Depending on what you can pay for a reporting tool and your expectations, you can take advantage of this solution.
Funnel.io pricing
Funnel.io prices on Flexpoints, usage credits consumed by connectors, platform accounts, dashboards, and warehouse destinations. Headline prices are annual only, and the free plan was removed in December 2025.
As of September 2026, there are three plans:
- Starter: from $200/mo billed annually. 121 connectors, Funnel Dashboards, and three reporting destinations (Looker Studio, Google Sheets, Excel). No warehouse export.
- Business: from $800/mo billed annually. 579 connectors, six reporting destinations, and 26 export destinations including BigQuery, Snowflake, Redshift and Azure.
- Enterprise: custom pricing. 590 connectors, 27 export destinations, enterprise governance and priority support.
Funnel Measure, the marketing mix and multi-touch attribution add-on, starts at $2,250/mo billed annually for $500K to $1M in monthly ad spend, and is only available on Business and Enterprise.
Treat the headline numbers as a floor. Every connector, account, dashboard and destination burns Flexpoints, warehouse export starts at the $800 tier, and Vendr transaction data puts the average enterprise contract near $73,000 a year. Funnel has also removed its public pricing calculator.
5. Databox
G2 rating: 4.4 out of 5 (194 reviews)
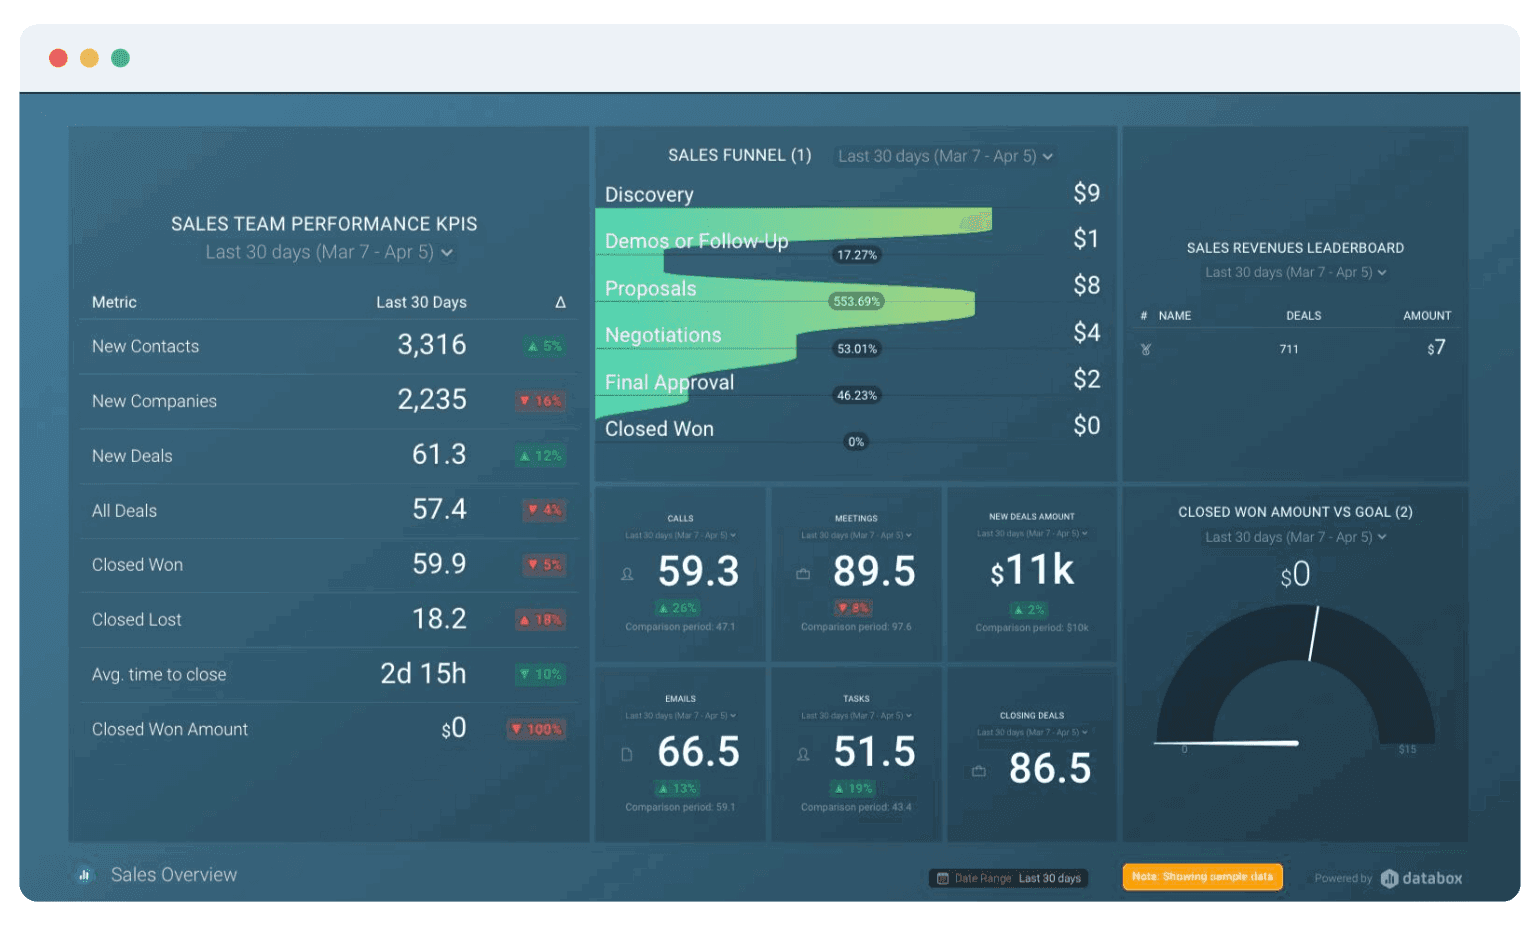
Databox is also a data reporting and visualization tool like Whatagraph. Their reports can also be customized and white-labeled.
They offer the same cross-channel reporting capabilities plus an automation feature. So, what’s the difference?
Pros
- Databox offers access to 100+ data integrations, making it one of the leaders in the market in this department. This gives slightly bigger flexibility to companies, marketing agencies, and marketing teams.
- Moreover, they offer 200 pre-built reports.
- The biggest advantage of Databox is their Benchmark Groups. You can browse industry benchmarks to gauge whether you’re doing well, better than others, or falling behind.
- Databox also offers AI summaries, insights notifications, and KPI scorecards.
Cons
- Even though Databox offers a white labeling and customization add-on, it costs an additional $250 (this is free on Whatagraph).
- If you’d like guided onboarding, you’ll need to pay an extra $500 or an extra $1000 for “Quick-start onboarding”. Again, this is already included in your pricing plan on Whatagraph.
- There is also a limit to the number of data sources you can connect to and pull data from simultaneously.
- Users also say Databox’s interface can be clunky and difficult to read.
- You’ll also need to create separate reports and dashboards on Databox, taking up more time.
Who is Databox for?
According to the reviews on G2, we can identify that the tool is the most commonly and appropriately used by small businesses needing data analytics software.
Databox pricing
Databox runs two pricing tracks, one for in-house teams and one for agencies. Agency plans are billed annually and include unlimited users. As of September 2026:
- Free: 3 data sources, 1 dashboard, 3 users, 10 custom metrics, daily sync.
- Agency Starter: $79/mo. 10 dashboards, 5 client accounts, 3 data sources included.
- Agency Pro: $159/mo. Unlimited dashboards and client accounts, AI Analyst, reports, goals, branding removal, 3 data sources included.
- Agency Growth: $399/mo. Everything in Agency Pro plus datasets, raw data export, data prep, anomaly detection and forecast modeling.
- Agency Premium: $799/mo. 50 data sources included, with white-labeling, OKRs, advanced security, 15-minute sync and priority support bundled in.
Additional data sources cost $2.40 per month each on agency plans. White-labeling, OKRs, advanced security and faster sync are paid add-ons on every tier below Premium, where Whatagraph includes white-labeled reports and a dedicated Customer Success Manager on the Max plan.
6. DashThis
G2 rating: 4.7 out of 5 (94 reviews)
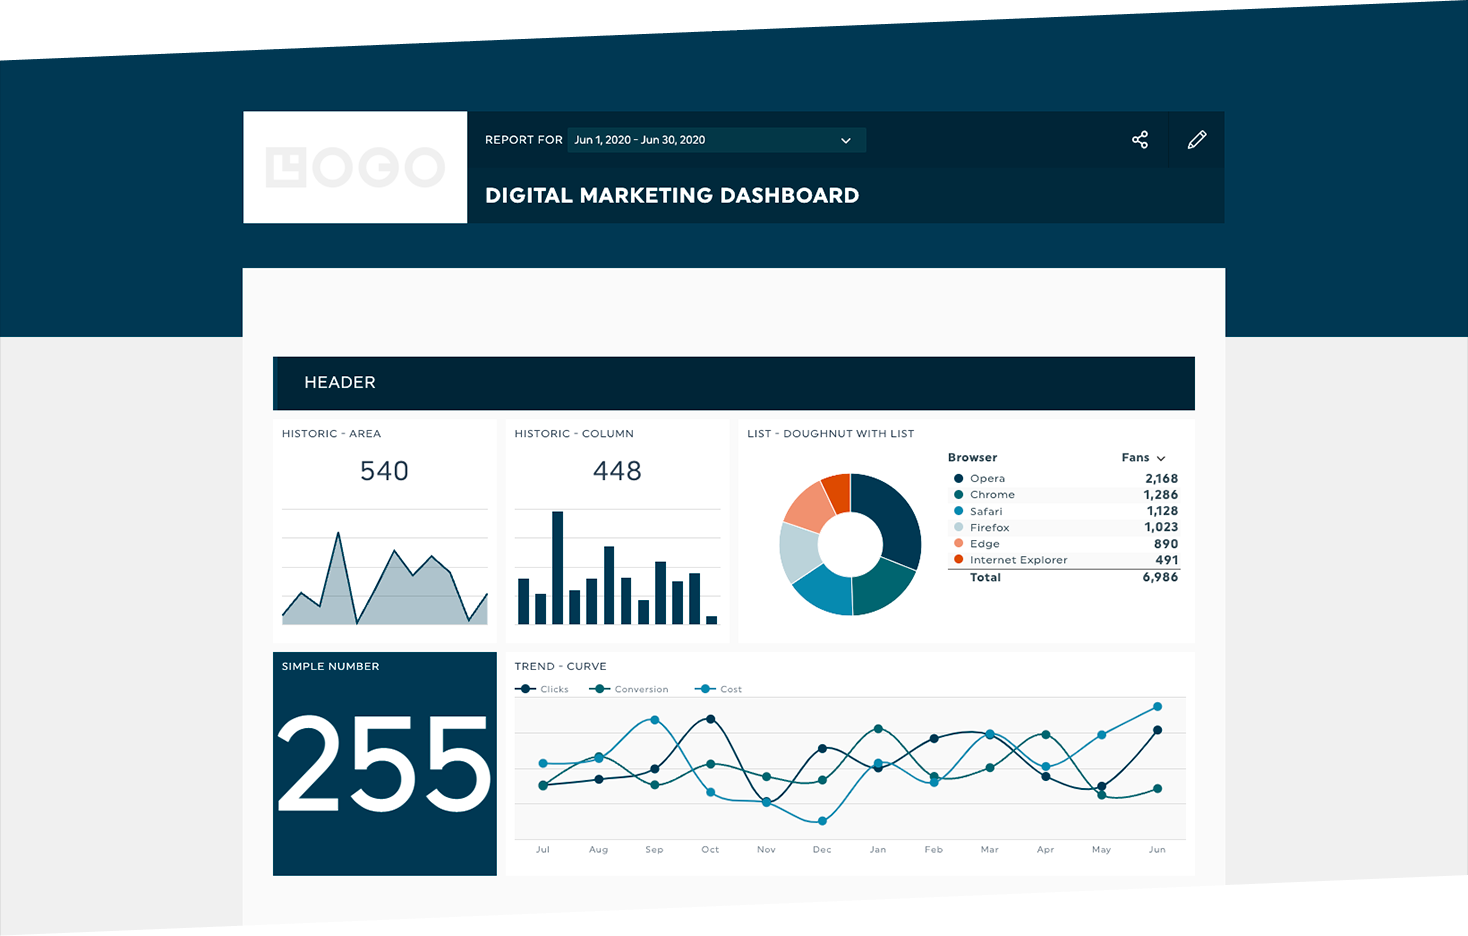
DashThis is a data reporting tool that you can use to visualize data and automate the sending of white-label reports.
They offer IT services and consulting. They also provide client reporting tools and marketing-related integrations to agencies and marketers.
Pros
When it comes to pros, DashThis offers standard features like Whatagraph:
- Customer support;
- Cross-channel reporting;
- Unlimited number of client accounts to include in a single report;
- White-label and customization;
- 34 data integrations;
- Automated sharing via email, through a link or PDF file.
Cons
- One of the biggest disadvantages of DashThis is that it doesn’t store data. You’d need to get a data warehouse or storage tool to take full advantage of the tool and do data discovery properly.
- Second, DashThis doesn’t offer advanced business insights or forecasting capabilities.
- Lastly, each report has customization limitations and the number of widgets and graphs you can include per report. You can’t drag-and-drop widgets either.
Who is DashThis for?
Marketing agencies could use DashThis due to its report customization and creation features. However, because it doesn’t store data and doesn’t provide advanced analytics, small businesses find the tool the best choice for their needs.
DashThis pricing
DashThis moved to source-based pricing on 30 March 2026. A source is one data account connected to at least one dashboard, so cost tracks the number of accounts you report on. As of September 2026:
- Individual: $54/mo, or $44/mo billed annually. 3 dashboards, 15 sources.
- Professional: $164/mo, or $139/mo billed annually. 10 dashboards, 40 sources, custom domain, custom email, white-labeled dashboards.
- Business: $324/mo, or $279/mo billed annually. 25 dashboards, 100 sources, personalized onboarding and priority support.
- Standard: $499/mo, or $429/mo billed annually. 50 dashboards, 200 sources.
All plans include unlimited users. AI Insights Pro is an add-on at $19/mo, or $15/mo billed annually.
7. Klipfolio
G2 rating: 4.5 out of 5 (258 reviews) for Klips. PowerMetrics is listed separately at 4.0 out of 5 (2 reviews).
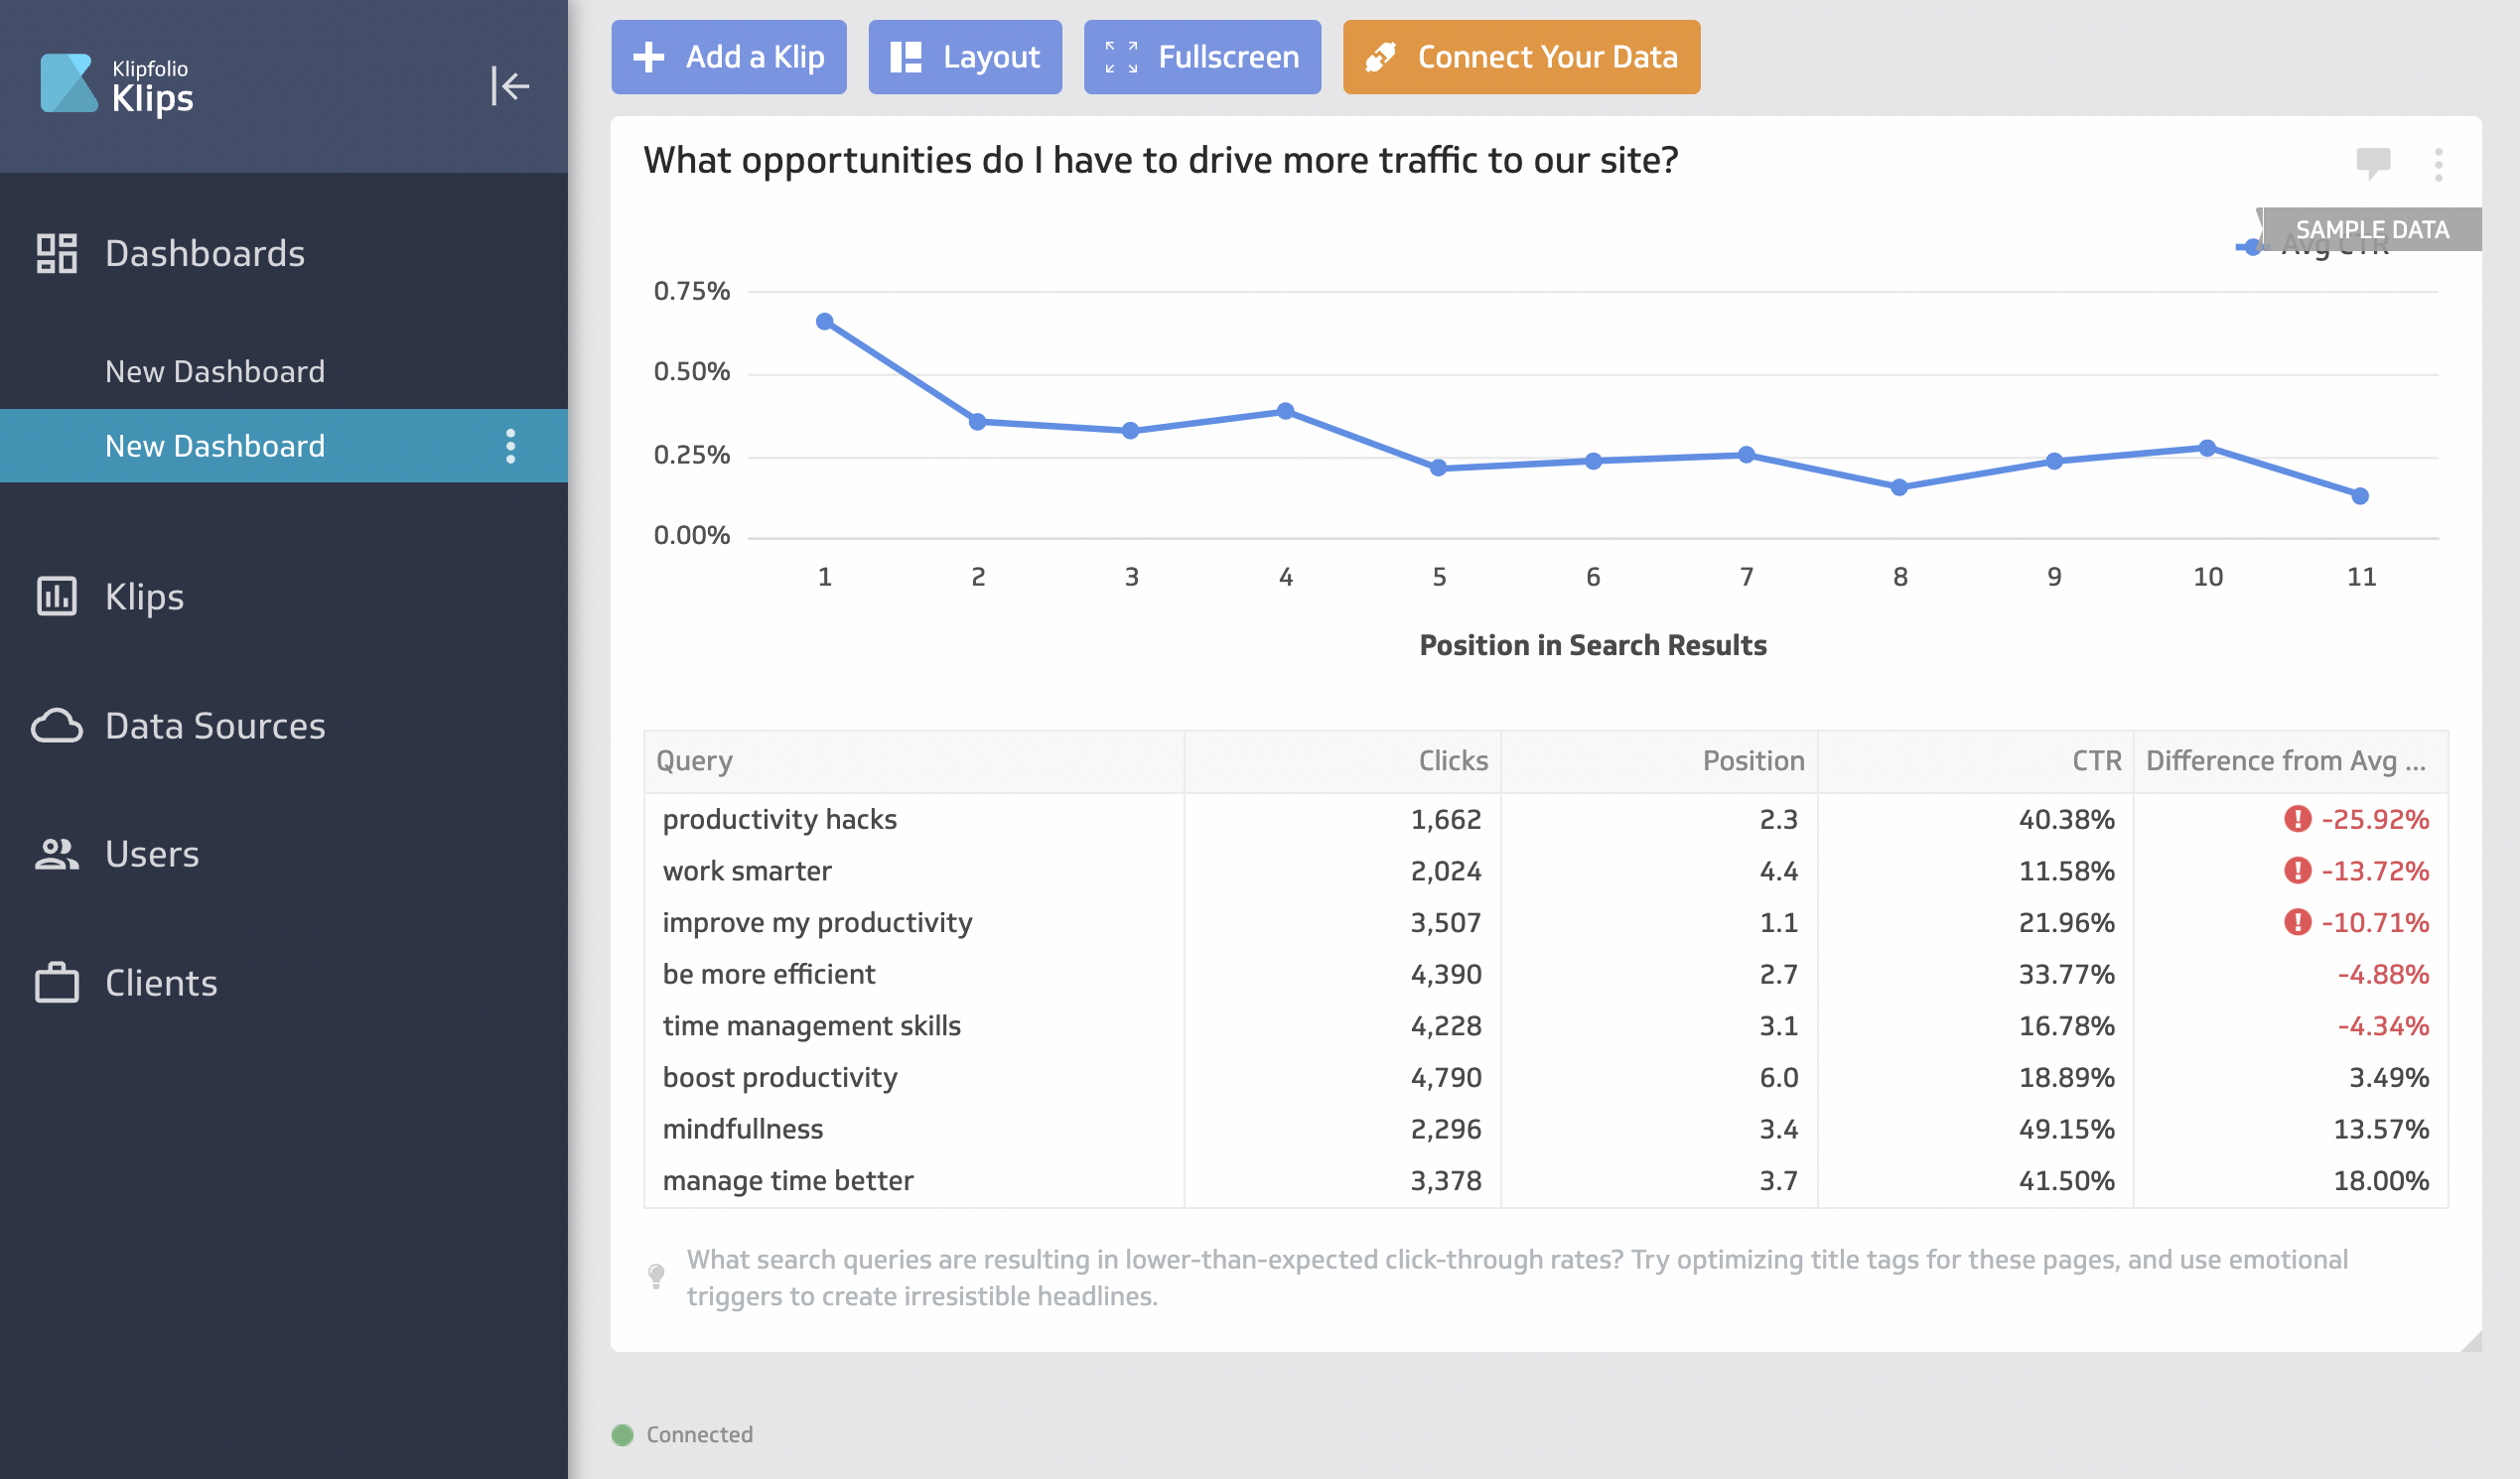
Klipfolio is a modern marketing data reporting tool with a user-friendly interface, data documentation, and visualization features.
You can create pixel-perfect real-time data visualizations and share tailored dashboards and reports. To transform and streamline your data, use advanced customization, formulas, and functions to bring your team together.
Pros
- Klipfolio offers cross-channel reporting by allowing you to integrate with over 300 data sources. These reports can then be customized and automated, with data pulled from them for convenient storage in the metric warehouse.
- Just like Whatagraph or Google Data Studio, Klipfolio offers data blending and filtering capabilities.
- Lastly, Klipfolio offers 90+ interactive live dashboard examples, 32 chart types to include, and customer support to get you started.
Cons
- First, depending on your pricing plan, you will receive different data refresh times. Obtaining real-time data could take an hour. By that point, it's no longer real-time;
- Second, a Data Source Limit of 10MB restricts most Klipfolio users who work with Excel and CSV files.
- Furthermore, the white-label option is only available on the higher-priced plans.
- Finally, although Klipfolio includes numerous solid integrations, it may be difficult to use without intermediate-level knowledge.
- There is also a steep learning curve, which means that understanding the platform and its features and setting up the platform takes time.
Who is Klipfolio for?
Due to Klipfolio’s features and capabilities, it may be a great platform for marketing agencies and businesses. It’s got a great number of integrations and convenient automation features.
However, it limits the number of visual elements you can upload per report. Moreover, you can’t personalize client reporting.
Even though marketing agencies may find some beneficial features, they’d be limited to others.
Klipfolio pricing
Klipfolio now sells Klips on its own site, while PowerMetrics has moved to a separate brand and site at powermetrics.app. The two are priced very differently.
As of September 2026, here are the Klips plans, all with unlimited users and 130+ integrations:
- Base: $140/mo, or $120/mo billed annually. 3 dashboards, data modelling, PDF reports, logo customization.
- Grow: $220/mo, or $190/mo billed annually. 10 dashboards, published links, scheduled reports.
- Team: $350/mo, or $310/mo billed annually. 20 dashboards, SSO, Warm Up Refresh.
- Team+: $690/mo, or $600/mo billed annually. 40 dashboards, custom onboarding, priority support.
The dedicated Klips agency plans are gone. Agencies are now served through add-ons, and those add up: extra dashboards $8/mo, SSO $63/mo, priority support $63/mo, custom theme $69/mo, custom domain $90/mo, white-label bundle $299/mo, dedicated server $699/mo.
PowerMetrics is priced per user, with a 30-day trial:
- Launch: $24 per user per month, minimum 2 users. 50 metrics, 4-hour refresh.
- Professional: $35 per user per month, minimum 3 users. 200 metrics, 1-hour refresh, data warehouse and semantic layer integration.
- Custom: contact sales, annual billing only. Flexible users, metrics and refresh rates.
PowerMetrics add-ons are priced separately too, including SSO at $69/mo, custom domain at $99/mo, and data warehouse or semantic layer integration at $180/mo each.
8. ReportGarden
G2 rating: 4.5 out of 5 (29 reviews)
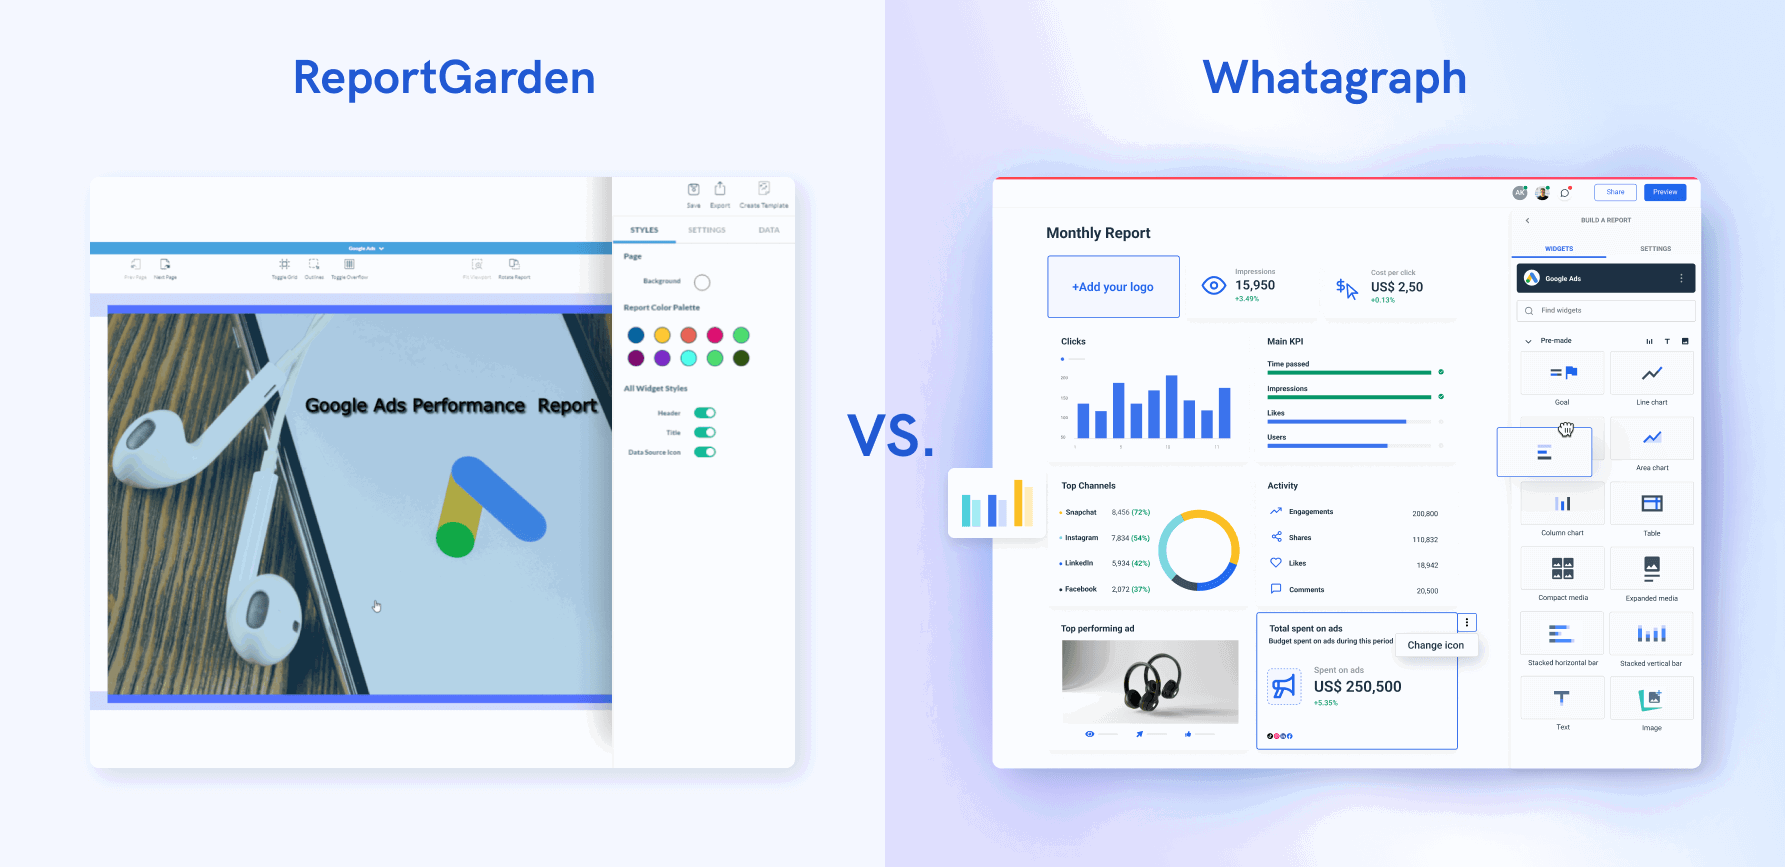
ReportGarden is a full-suite reporting and dashboarding software. The platform is well-structured, intuitive, and user-friendly, making it fairly straightforward.
It has many reporting and dashboarding features, including pre-set and custom report and dashboard templates, drag-and-drop widgets, customization, white labeling, and automated report scheduling.
ReportGarden has an SEO tool for website audits and backlink analysis, keyword tracking, automated invoice management for tracking ad spend, budget tracking, and alerts.
However, keep in mind that by switching to ReportGarden, you lose the ability to connect any source via a custom API and use BigQuery as a data source.
Pros
- Dashboards have options for clients to log in with their own accounts
- Budgeting tools that help keep track of your ad spend
- Easy to customize the report visuals to keep them on brand
- Reporting templates for quick starting off
- White-labeling options so you can remove the ReportGarden logo and use your own. Great for monetizing client reports.
Cons
- No email marketing integrations. At least Mailchimp and Campaign Monitor would be nice to have.
- Multi-channel reporting is not as easy as with Whatagraph.
- Reports lack details and granularity even with the top-tier pricing plan.
Who is ReportGarden for?
Due to its simplicity and lack of advanced visualization features, ReportGarden is a good choice for smaller agencies or businesses looking for a simple, affordable reporting tool. It’s easy to use and integrates well with most tools and platforms. However, the reporting part tends to be glitchy sometimes and lacks detailed insights.
ReportGarden pricing
ReportGarden repackaged around client counts rather than data sources, and the top published tier is now cheaper than it was. As of September 2026, there are three plans with a 14-day trial:
- Standard: $75/mo, discounted from a $89 list price. Up to 5 clients, unlimited reports and dashboards, custom metrics, all available integrations.
- Professional: $125/mo, discounted from a $149 list price. Up to 10 clients, unlimited premium templates, a dedicated onboarding contact.
- Custom: contact sales. Everything in Professional plus white-glove services and custom integrations.
Annual contracts are available, but ReportGarden does not publish annual rates.
9. Salesforce Marketing Cloud Intelligence (Datorama)
G2 rating: no standalone listing as of September 2026. The Marketing Cloud Intelligence and Datorama pages now redirect to the wider Salesforce marketing listing, so there is no Intelligence-specific score to quote.
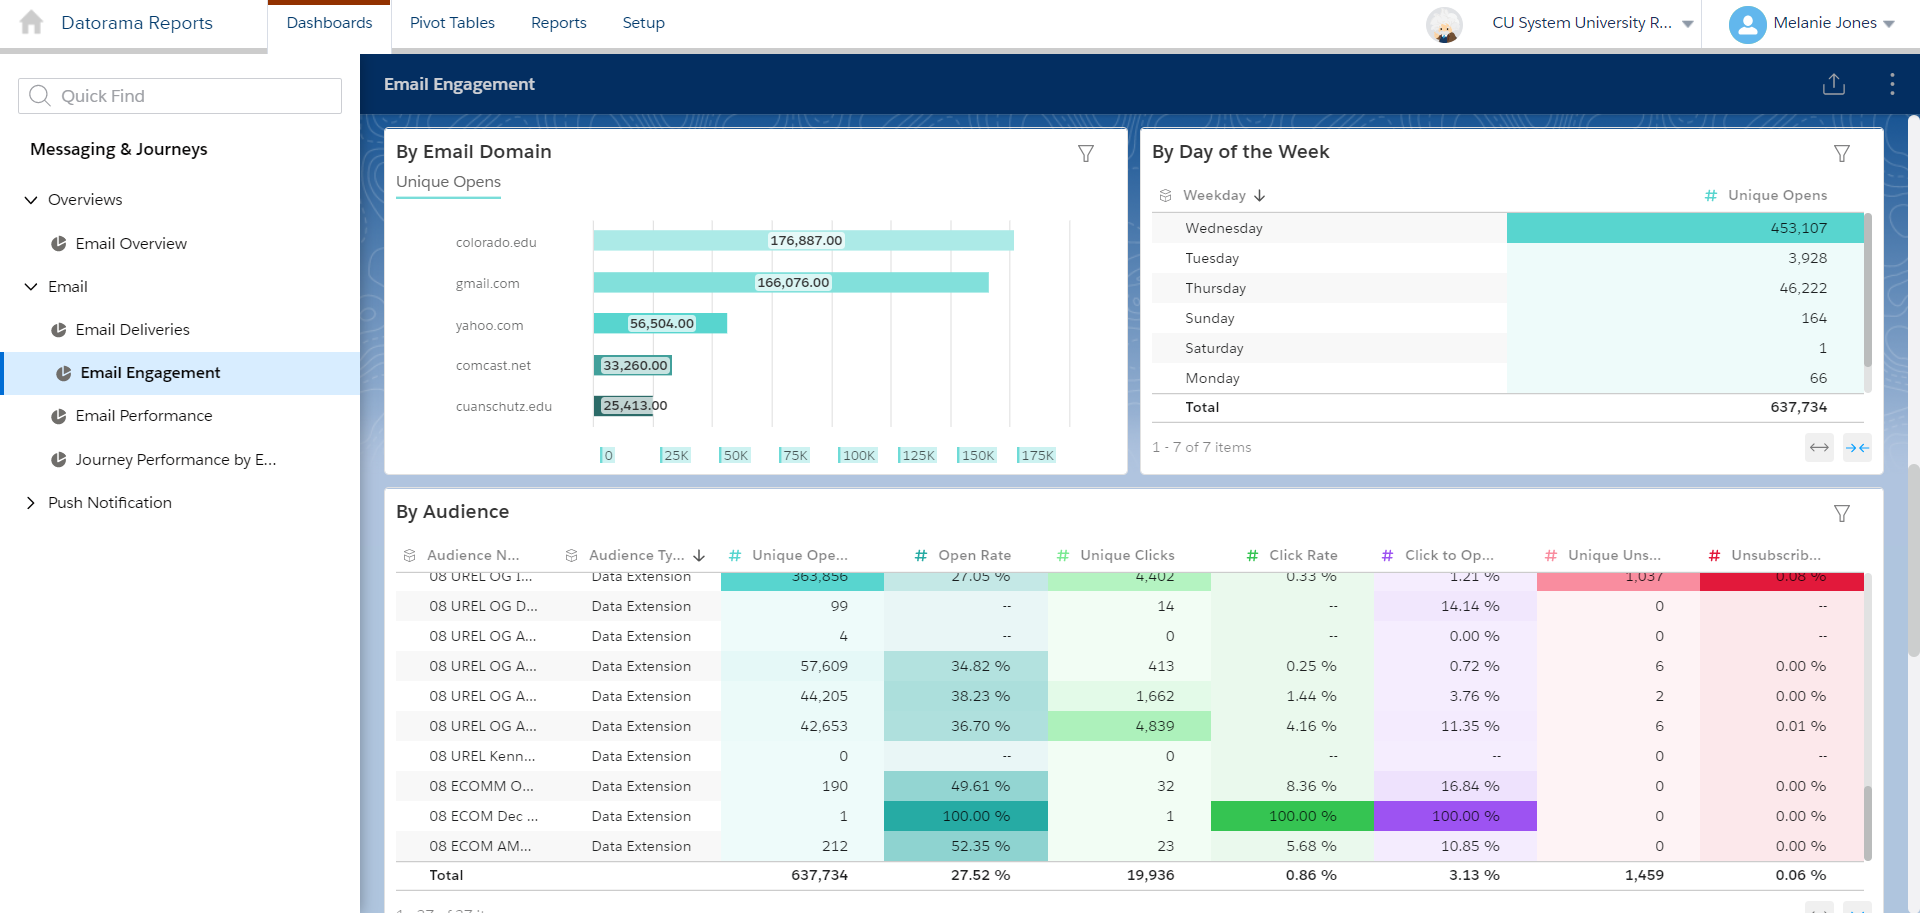
Formerly known as Datorama, Marketing Cloud Intelligence is a marketing analytics platform that allows companies and agencies to customize every aspect of their customer relationship, save time and money on data preparation and uncover forward-moving insights for stakeholders.
Teams can use Marketing Cloud Intelligence either as a standalone unit that supports data storage, data modeling, ETL, and visualization, or in conjunction with potentially competitive platforms such as Databricks, Azure, or Looker.
Pros
- Easy to use and navigate
- Large number of data sources and destinations
- Great customer support
Cons
- Expensive pricing plans
- Platform complexity can cause human errors
- Little flexibility for complex data manipulation and analysis
- Server can time out on long data journeys
Who is Marketing Cloud Intelligence for?
Marketing Cloud Intelligence was conceived as a platform for ad agencies, with some of the biggest media holding companies in the US using it for automated client- and agency-side reporting. Agencies especially use its premium feature called Media Cost Center, which they use to connect media plan data to delivered impressions. Its price is, unfortunately, out of reach for many marketing agencies and SMEs.
Marketing Cloud Intelligence pricing
Salesforce still sells Marketing Cloud Intelligence, now alongside a newer Marketing Intelligence edition. Both are priced per organization and billed annually. As of September 2026:
- Marketing Intelligence: $10,000 per org per month, billed annually.
- Marketing Cloud Intelligence+: $11,000 per org per month, billed annually. Media Planning and Media Pacing are add-ons.
The wider Marketing Cloud line sits well below that: Salesforce Starter at $25 per user per month, Salesforce Pro at $100 per user per month, Marketing Cloud Next Growth at $1,500 per org per month, and Marketing Cloud Next Advanced at $3,250 per org per month.
Premier Support is included in the Intelligence editions, while Data 360 usage credits are priced separately. For most agencies, this is enterprise territory rather than a client reporting budget.
10. NinjaCat
G2 rating: 4.2 out of 5 (316 reviews)
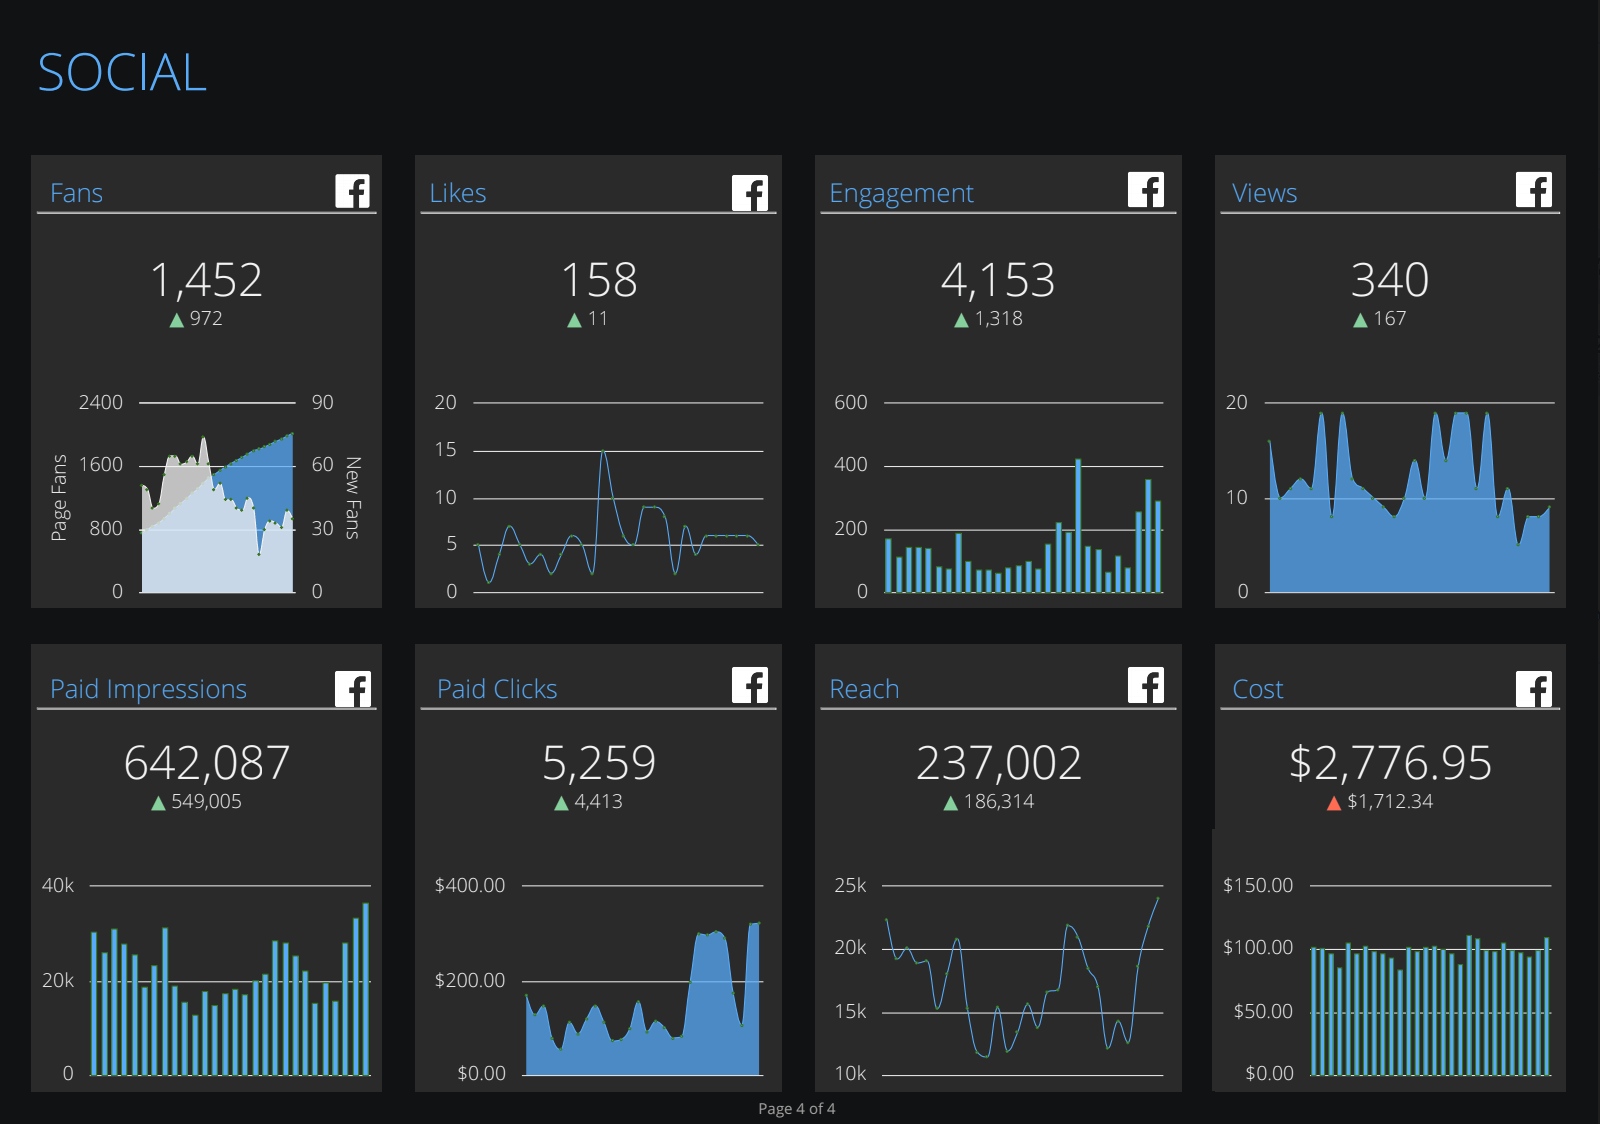
NinjaCat is a one-stop-shop marketing reporting tool for data management, performance analysis, and call tracking. It allows agencies and marketing teams to connect data from multiple platforms, create marketing reports and track their business performance via real-time data analysis.
NinjaCat integrates with over 150 marketing channels, so that users can pull metrics from multiple data sources into a single source of truth.
Pros
- One platform to connect, visualize, and share
- Large number of integrations
- Mobile-friendly reports
Cons
- Complex navigation by search queries
- A lot of manual work around each template
- Load speed issues
- Cross-channel reports are only available through workarounds
- PDF export only
Who is NinjaCat for?
NinjaCat is used by marketing agencies, media companies, and brands who need to keep their clients, partners, and decision-makers in the loop with the most recent and accurate data. However, the product is still being developed, with new features constantly added, which sometimes causes current sources to stop working.
NinjaCat pricing
NinjaCat does not publish pricing. Contracts are annual and quoted per account, based on data sources, reporting volume, and how many AI agent seats you need.
Third-party market data puts entry-level enterprise contracts at roughly $1,500 per month and up, but treat that as an estimate rather than a list price. There is no self-serve plan.
11. Adverity
G2 rating: 4.4 out of 5 (326 reviews)
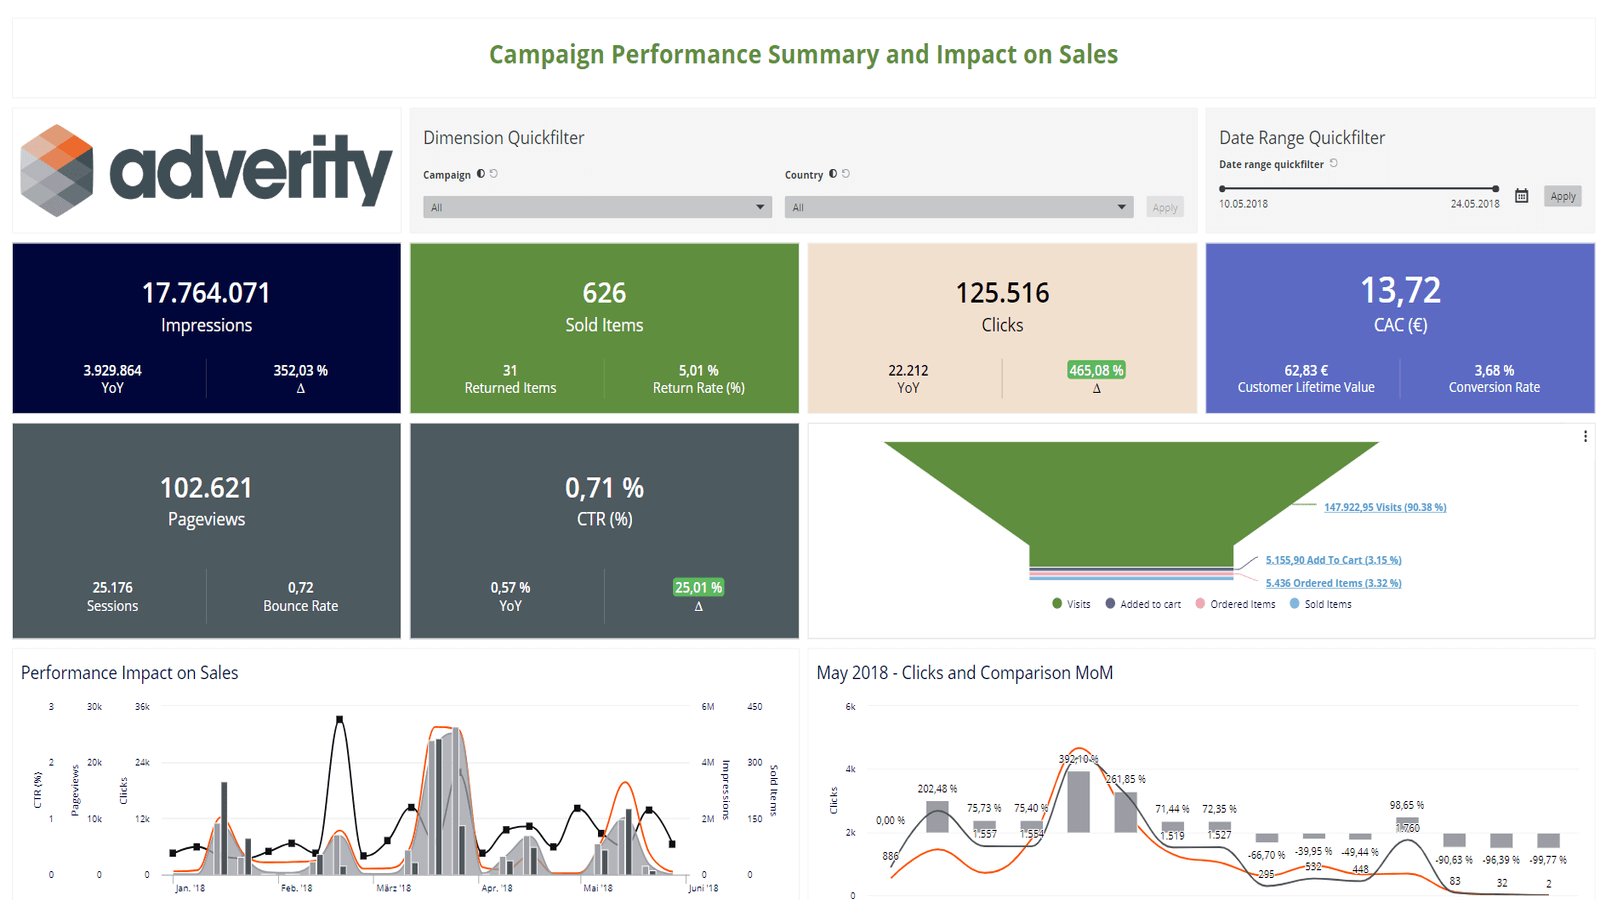
Adverity is positioned as a platform for next-generation marketers. It features an integrated data platform for connecting, managing, and using data at different levels.
This data solution helps businesses combine disparate data sources, such as sales, finance, marketing, and advertising platforms, to create business intelligence.
With automated connectivity to hundreds of data sources, Adverity is a serious choice for scaling and automating your data operations.
Pros
- Outstanding customer support
- Configuration mapping suitable for non-tech teams
- User-friendly data integration
Cons
- Native visualization is not available
- UI struggles when adding a lot of metrics
- Needs multiple tools to complete the data journey
- Data extraction takes time
- Steep learning curve
Who is Adverity for?
With a library of over 600 data connectors and a custom pricing model, Adverity is a reasonable marketing analytics choice for agencies and industries with a wide range of goals and budget sizes.
However, the lack of visualization options and the ability to share data only with other tools and platforms makes it a bad choice for agencies looking to reduce their tech stacks and get reports to their clients fast.
Adverity pricing
Adverity has a custom pricing model with no self-serve option. You fill out a form, book a demo, and get a quote based on connectors, ad accounts, and data volume.
The most reliable public number is the AWS Marketplace listing, which prices a 12-month contract at $200,000 for the base platform with an allowance of connectors, accounts and data volume. Third-party sources cite around $500 per month for core connectors and $2,000 per month for the full connector set, though neither figure is independently verifiable.
12. TapClicks
G2 rating: 4.3 out of 5 (337 reviews)
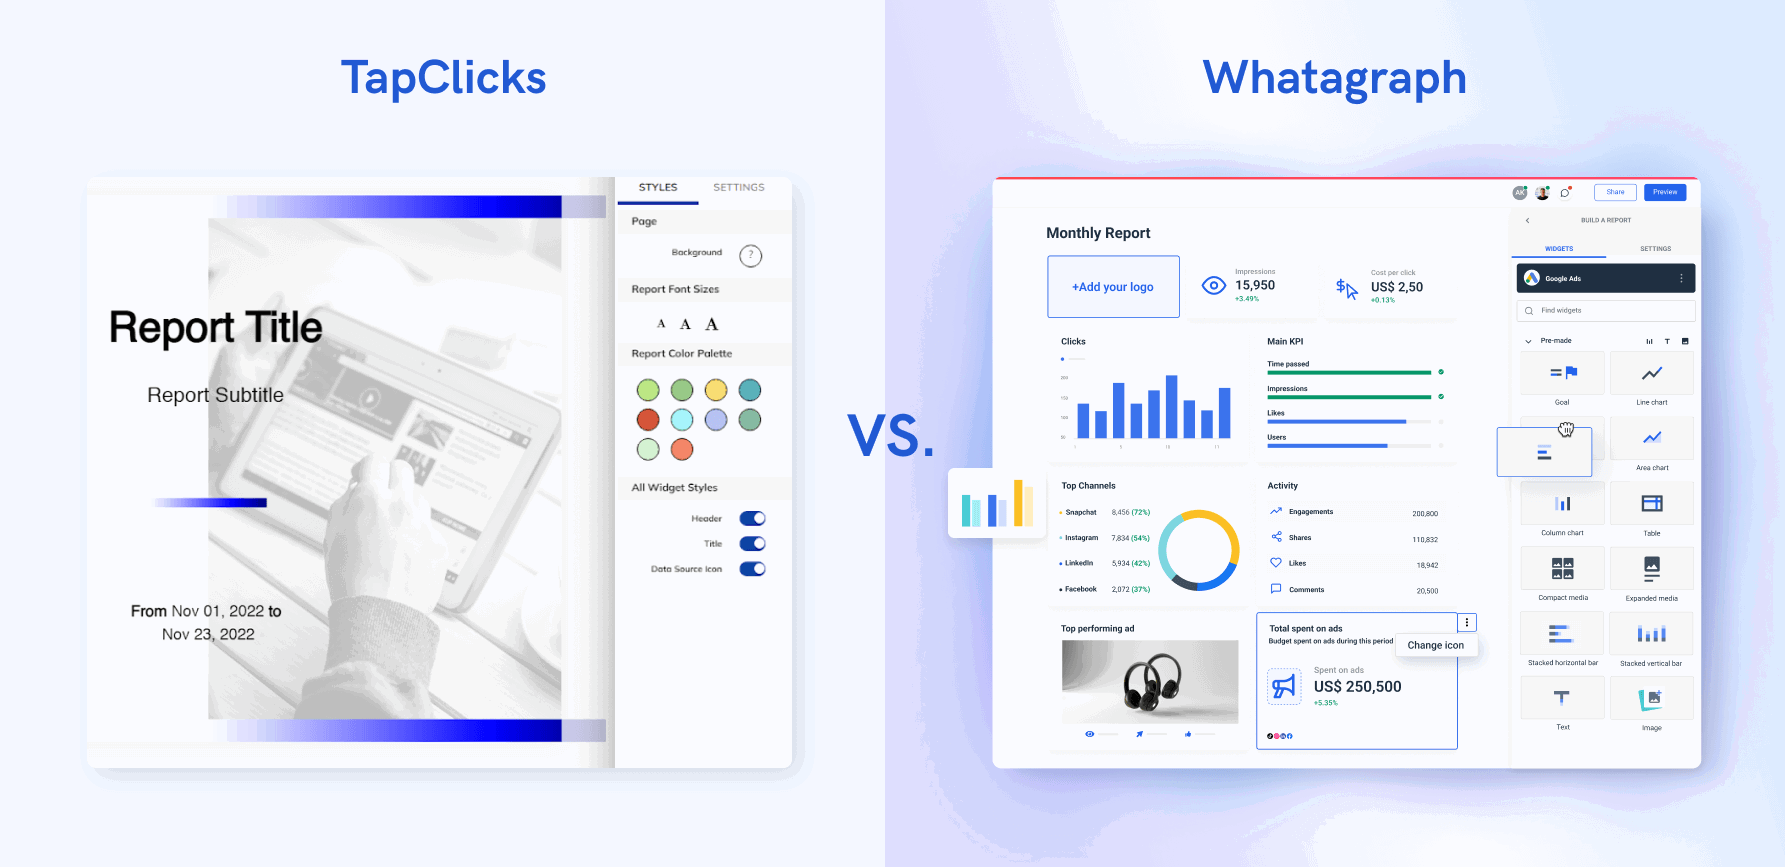
TapClicks is a marketing data platform that provides end-to-end business intelligence workflows, including social and PPC reporting, SEO, marketing performance analysis, automated order entry, and interactive visual reports.
This platform integrates with more than 250 data sources through its Connector Marketplace, allowing teams to analyze data from the most popular marketing tools in the industry.
TapClicks allows users to combine their marketing campaigns and performance results in a single digital dashboard. You can then share results via scheduled emails or export them as Word, Excel, or PDF files.
Pros
- All-inclusive data platform with connecting, visualization, and sharing capability.
- Large number of databases for data transfer
- Unlimited reports in all pricing plans
Cons
- Limited metrics for some integrations
- Separate environment for cross-channel metrics
- No custom folders to organize report storage
Who is TapClicks for?
TapClicks users vary from digital marketing individuals to big agencies and businesses that have a large number of data sources to report on. Companies of all sizes can reach out to TapClicks for customized pricing plans.
Still, due to the steep learning curve and the extra effort needed to create clean visualizations, it might not be the ideal choice for teams that need a solution they can implement quickly.
TapClicks pricing
TapClicks no longer publishes prices. The pricing page lists four tiers, SmartStory, SmartReports, SmartAnalytics and SmartSuite, and every one of them routes to a sales appointment.
The best verifiable third-party figures, listed on Capterra as of September 2026, are:
- Basic: $599/mo flat rate.
- Pro: $999 per user per month.
- Elite: custom quote.
Because you assemble data packages and destinations separately, a complete stack still lands in the thousands per month.
13. Swydo
G2 rating: 4.7 out of 5 (114 reviews)
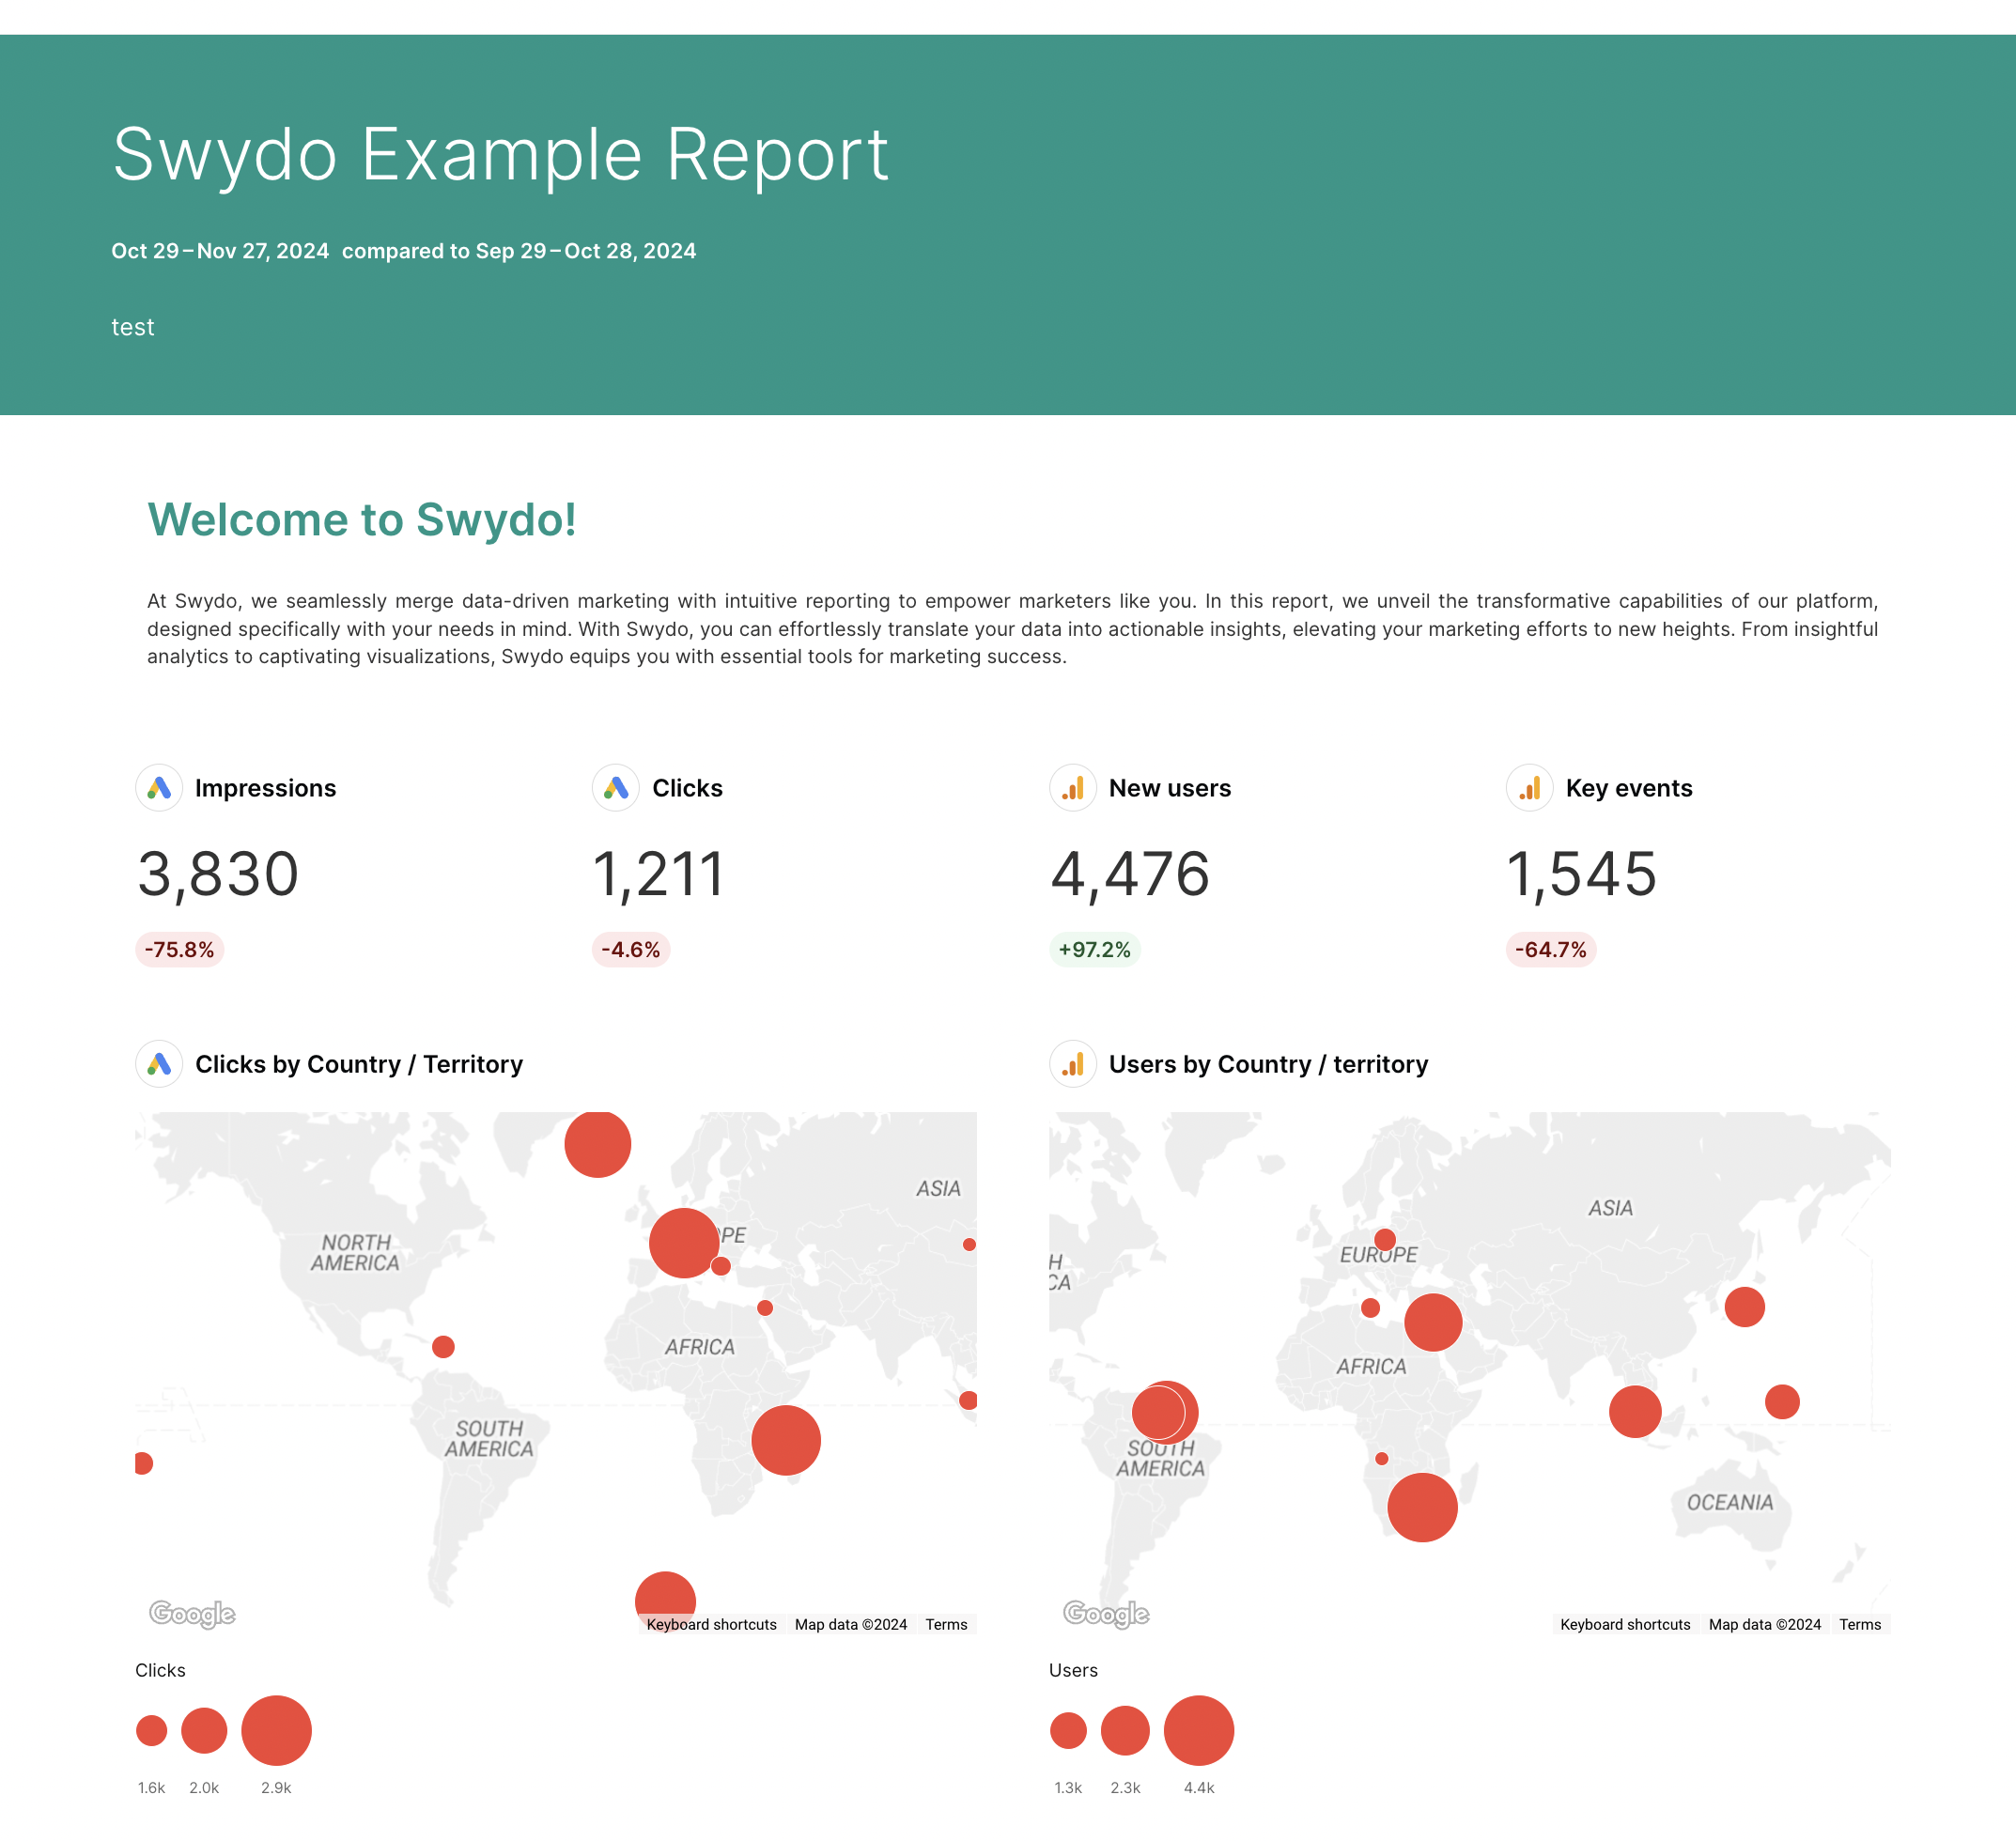
Swydo is a cloud-based marketing dashboard software that allows professional marketers to create interactive reporting dashboards that help teams and agencies visualize and share the impact of the essential KPIs in real-time.
Swydo operates has a data extraction step where you connect data from various channels and a data upload step that automatically transfers your data to a selected dashboard template.
Pros
- Multi-language dashboard optimization
- Custom API for connecting data sources such as CRMs
- White-labeling
Cons
- Reported changes in billing terms
- No paused campaign stats for some sources
- Difficult to share sources with team members
- Lacks cross-channel formulas
 Who is Swydo for?
With its flexible pricing model, Swydo is a great tool for freelancers serving a single client, or a small agency.
Swydo pricing
Swydo keeps one plan with every feature included, priced on the number of data sources. As of September 2026:
- Base fee of $49/mo, which covers the first 10 data sources.
- 11 to 100 data sources: $3.50 per source.
- 101 to 500 data sources: $2.50 per source.
- 501+ data sources: $1.50 per source.
Unlimited users, reports and dashboards are included, and there is a 14-day trial. At 100 data sources you would pay around $364 per month. Swydo does not publish an annual discount, and its pricing page does not say whether a Customer Success Manager is included.
14. Cyfe
G2 rating: 4.3 out of 5 (64 reviews)
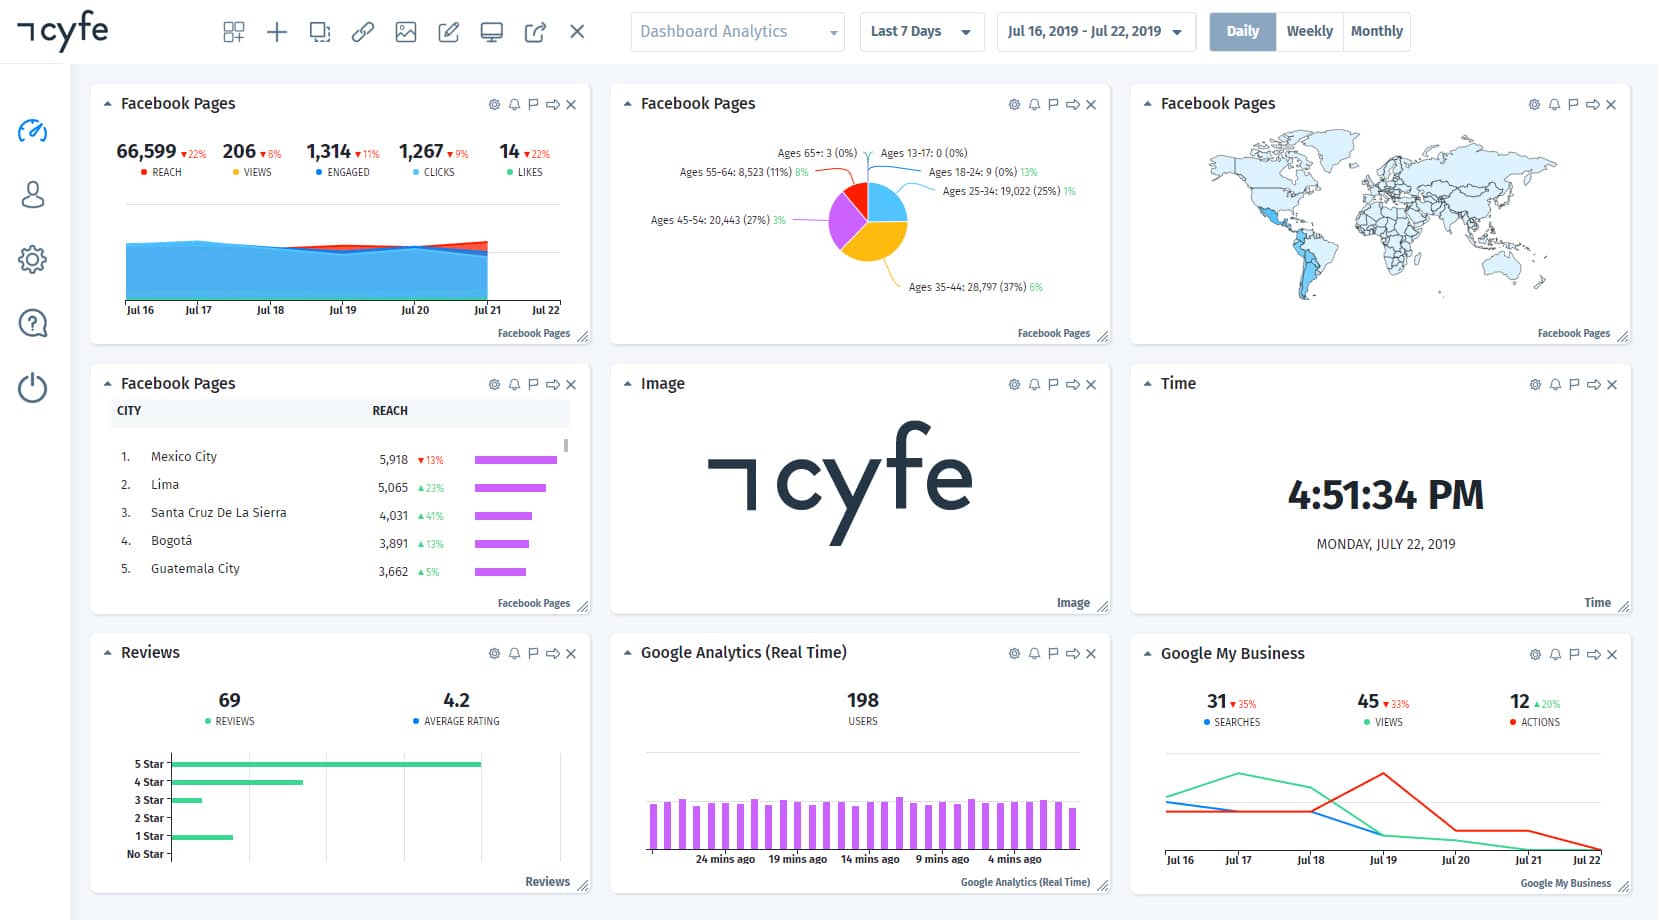
Cyfe is an all-inclusive data connecting and reporting platform that lets you collect all your client’s marketing data in one location and present it in interactive business dashboards.
A part of Traject now, Cyfe helps teams deliver data insights to decision-makers faster by eliminating the need to manually log into, analyze, and report data from multiple services each and every day. Sharing automated email reports is available in PNG, JPEG, PDF, and CSV formats.
Pros
- A large number of integrations
- Support for 15+ languages
- White-labeling
- Great customer service
Cons
- Limited choice of visualization widgets
- Difficult to set up first time
- No mobile support
- Real-time statistics can lag
Who is Cyfe for?
With its price/capability ratio, Cyfe is a good choice for mid-market businesses and small-sized agencies with less than 50 employees and up to 20 client accounts.
Cyfe pricing
As of September 2026, Cyfe offers five plans, all billed monthly:
- Starter: $29/mo, 2 dashboards, 1 user.
- Standard: $39/mo, 5 dashboards, 2 users.
- Pro: $65/mo, 10 dashboards, 5 users.
- Premier: $119/mo, 20 dashboards, unlimited users, plus $5 per additional dashboard.
- Agency: from $190/mo, 100 dashboards, 15 users, 10 clients, full white-labeling, plus $19 per additional client.
Every plan includes unlimited history, TV mode, public URLs, custom themes, a custom SSL domain and unlimited data exports.
Bottom line
All of the above-provided marketing data reporting tools are the alternatives to Whatagraph we suggest you consider. They all have their own pros and cons and reasons why each product is the best at what they offer.
But in one category, Whatagraph wins hands down—we are the best at streamlining client reporting (even at scale) and ensuring data accuracy for all your reports.
Book a call to see what Whatagraph can do to make your client report even more engaging and easy to share. Your clients will appreciate the clean, sleek look and accurate, real-time data.
Which Whatagraph alternative is right for you?
Most of these tools are a good answer to a specific question and a poor answer to the rest. Here is the shortest path to a shortlist:
| If you are | Start with | Why |
|---|---|---|
| A freelancer or solo marketer | DashThis Individual or Cyfe Starter | A handful of dashboards, no white-label requirement, and the lowest monthly commitment. Looker Studio is free if all your data is already in Google. |
| A small agency under 10 clients | ReportGarden or Swydo | Both price around the thing you actually add: clients for ReportGarden, data sources for Swydo. Cheap to start and enough for straightforward monthly reports. |
| A mid-size agency, 30 to 100 staff | Whatagraph, or Databox for dashboards only | At this size reporting is a headcount problem. You need one governed data layer, linked templates that update every client report at once, and unlimited users. Databox is the pick if you need KPI dashboards and benchmarks more than client-ready reports. |
| A multi-location operator, 50 to 200 locations | Whatagraph | Location marketing teams can self-serve from the same governed foundation the analyst uses, so cross-location numbers match everywhere. TapClicks and NinjaCat are worth a look at very high report volumes. |
| An enterprise with its own data team | Funnel.io or Adverity, with Tableau, Power BI or Looker Studio on top | If you already have analysts and a warehouse, buy the pipe and keep the visualization layer you have. Salesforce Marketing Cloud Intelligence makes sense if your stack is already deep in Salesforce. |
| An SEO or content-led agency | NinjaCat or ReportGarden | Both bundle rank tracking and site audit reporting, so SEO deliverables live next to paid and analytics data instead of in a separate tool. |
If you land on Whatagraph, you can see it on your own data with a 14-day free trial, or book a call and we will map your current stack against it first.
Published on Oct 10 2022
WRITTEN BY
YamonYamon is a Senior Content Marketing Manager at Whatagraph. With an eye for detail and a knack for always considering context, audience, and business goals to guide the narrative, she's on a mission to create genuinely helpful content for marketers. When she’s not working, she’s hiking, meditating, or practicing yoga.