6 Best PPC Reporting Tools | Top Paid Ads Reporting Software in 2026
Looking for the best reporting tool to bring actionable insights from all your PPC platforms to one place? But don’t have time to read the fine print?
We've got you covered.
To make your search easier, we highlight key differences between the 6 best PPC reporting tools marketers are raving about in 2026.

Jan 02 2026●10 min read

We talked to marketing experts from agencies and big in-house teams. They told us what they’re looking for in a PPC reporting tool:
✅ Ease of use — Create, tweak, and replicate reports quickly without long tutorials or training.
✅ Accuracy — Present data that is 100% true to data on the connected PPC platforms.
✅ Stability — Pull data with stable data integrations, with no connectors breaking off, and no downtimes.
✅ Cross-channel insight — Present metrics from all PPC channels.
✅ White labelling — Remove the vendor’s logo and use your agency’s or client’s branding.
✅ Customer support — Have a responsive customer success team and in-house engineers that can solve any issues quickly.
6 Best PPC Reporting Tools in 2026
Here are the best PPC reporting tools and software solutions we'll review in this article:
- Whatagraph
- Looker Studio (Google Data Studio)
- DashThis
- ReportGarden
- AgencyAnalytics
- Swydo
Already using PPC reporting software and want to compare how it stands against the competitors’ features? Here's a table:
| Features |
|

|

|

|

|

|
|---|---|---|---|---|---|---|
| Ease of use | Easy | Hard | Easy | Easy | Easy | Easy |
| No. of Out-of-the-box Data Connectors | 55+ | 21 | 34+ | 55+ | 80+ | 32 |
| Custom API Access |
|
|
|
|
|
|
| Data Blending |
|
|
|
|
|
|
| Custom Metrics and Dimensions |
|
|
|
|
|
|
| Custom Reports and Dashboards |
|
|
|
|
|
|
| Campaign Overview and Monitoring |
|
|
|
|
|
|
| White-labeling |
|
|
|
|
|
|
| Data Update Frequency | Every 30 mins across all integrations and pricing plans | Depends on APIs, from 15 mins to 4 hours | Once a day or on-demand update | Once a day | Depends on APIs, but SEO rankings update every 24 hours | ? |
| Data Segmentation and Filtering |
|
|
Only for select data sources |
|
|
|
| Alerts and Notifications |
|
|
|
|
|
|
| Multi-Client Management |
|
|
|
|
|
|
| User Management | Admin, Manager, or Editor roles | Viewer, Editor, or Owner roles | Every user of the same account are considered "Admins" | Admin and Editor roles | Staff User or Client User | Admin, Editor, or Contributor roles |
| Automated Report Sharing |
|
|
|
|
|
|
| Data Export | PDF, XLS, CSV | Google Sheets, CSV, Excel | PDF only | PDF, Excel | PDF, CSV | |
| AI Insights |
|
|
|
|
|
|
| Customer Support | Live chat, email, Help Center for all pricing plans | Help center, community forums | Email, Help Center for all pricing plans | Live chat, email, Help Center | Live chat, Email, Help center | Live chat, Email, Help center |
| Dedicated Customer Success Manager |
|
|
|
|
|
? |
| Data Security and Compliance | ISO 27001, Enterprise SSO, GDPR compliant, AES-256 encryption, Two-factor authentication, AWS hosted servers | ? | Encrypted URLs, Password protection, Restrict IP addresses, GDPR compliant | Comodo SSL Certificates,Web Application Firewall (WAF), DDoS protection, and SSL | MFA, Enterprise SSO | ? |
|
Pricing
(with $$$ being the highest)
|
$$ | Free for native connectors | $$ | $$ | $$ | $ |
Do you like this table? Feel free to download it and check it on the go!
1. Whatagraph
Best for: PPC-focused performance marketers at SMB and mid-market companies (11–500 employees) + marketing agencies that want fast, accurate, no-stress PPC reporting
Whatagraph isn’t “another PPC reporting tool.”
It’s the easiest AI-powered marketing intelligence platform you’ll ever use, built for performance marketers running Google Ads, Meta Ads, LinkedIn Ads, and more.
Here’s what you’ll get:
- 55+ integrations: Connect your PPC platforms and downstream data (GA4, CRM, ecommerce, call tracking) through native, stable connections you don’t need to babysit.
- Whatagraph IQ: Create, style, and analyze full PPC reports with accurate AI—generate reports, summaries, and answers without hallucinations or data-leak risks.
- Templates: Ready-made PPC report templates you can plug your accounts into and instantly share with clients or execs.
- Custom metrics, dimensions, and blends: Unify naming, calculate blended ROAS/CAC, and combine PPC + CRM metrics with no-code workflows that take seconds.
- Automation and sharing: Schedule PPC reports to specific emails on a set cadence—or share a live, password-protected link.
Thanks to these smart features, Netherlands’ #1 PPC agency, Maatwerk Online, is saving 100 hours a month on reporting. Hear it straight from co-founder Lars Maat:
Whatagraph saves time and energy for our marketing specialists—and the hours we’re saving is just pure profit. We now have the time to focus on more strategic things that help both our agency and our clients grow.
Okay, but how does Whatagraph solve your pains with PPC reporting? Here are 4 ways how:
1. All Your PPC Data, Connected, Cleaned, and Ready to Use
Most PPC reporting headaches don’t start in the dashboard—they start before the dashboard.
Google Ads here. Meta Ads there. LinkedIn Ads somewhere else.
Then GA4, CRM, ecommerce, or call tracking data living in another tool entirely.
Whatagraph fixes this at the source.
With 55+ native, fully managed integrations, you can pull all your PPC data and the revenue context around it into one place—without third-party connectors, spreadsheets, or manual cleanup.
That means:
- Google Ads, Meta Ads, Microsoft Ads, LinkedIn Ads, Amazon Ads—connected out of the box
- GA4, CRM, ecommerce, and call tracking data alongside PPC spend and conversions
- No Supermetrics or Funnel layer to configure, pay for, or troubleshoot
- No broken connectors, delayed metrics, or “why doesn’t this match the platform?” moments
If something breaks, Whatagraph fixes it, not your PPC team.
This holistic approach is what Tanja Keglic, Performance Marketing Manager at Achtzehn Grad agency, loves about Whatagraph. She says:
The biggest reason we chose Whatagraph was because of its holistic approach to reporting. We can blend data from different channels and see in one view what's the performance and what needs to be changed.
Once your data is connected, Whatagraph automatically cleans and standardizes it so you can:
- Blend PPC data across channels into one view
- Create cross-channel ROAS, CAC, and spend metrics
- Unify naming across campaigns and accounts
- Keep historical PPC data consistent and reliable over time
This is especially valuable for:
- Agencies managing dozens of PPC accounts with inconsistent naming
- In-house teams trying to tie ad spend to pipeline or revenue
- Account managers who need one source of truth before client calls
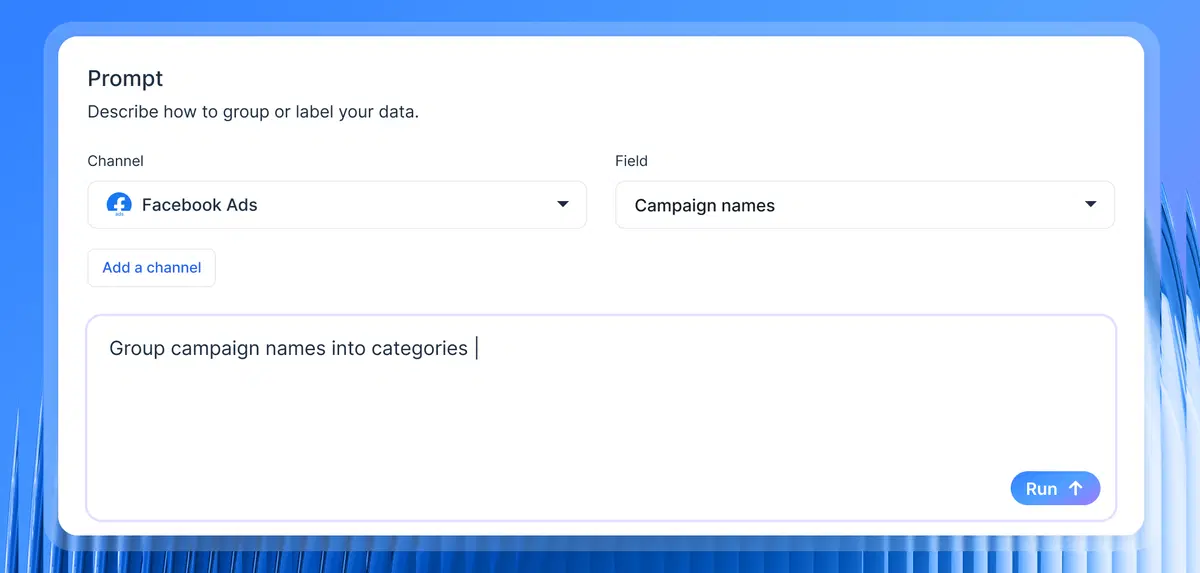
And with Whatagraph IQ, you don’t even need to model everything by hand. You can prompt AI to help create custom dimensions or structure your data correctly, without touching SQL or spreadsheets.
2. The Fastest Way to Build PPC Reports
This is where Whatagraph really separates itself from every other PPC reporting tool.
There are three key options to build your first PPC report, all of which are fast, easy, and accurate.
Option 1: Use Whatagraph IQ
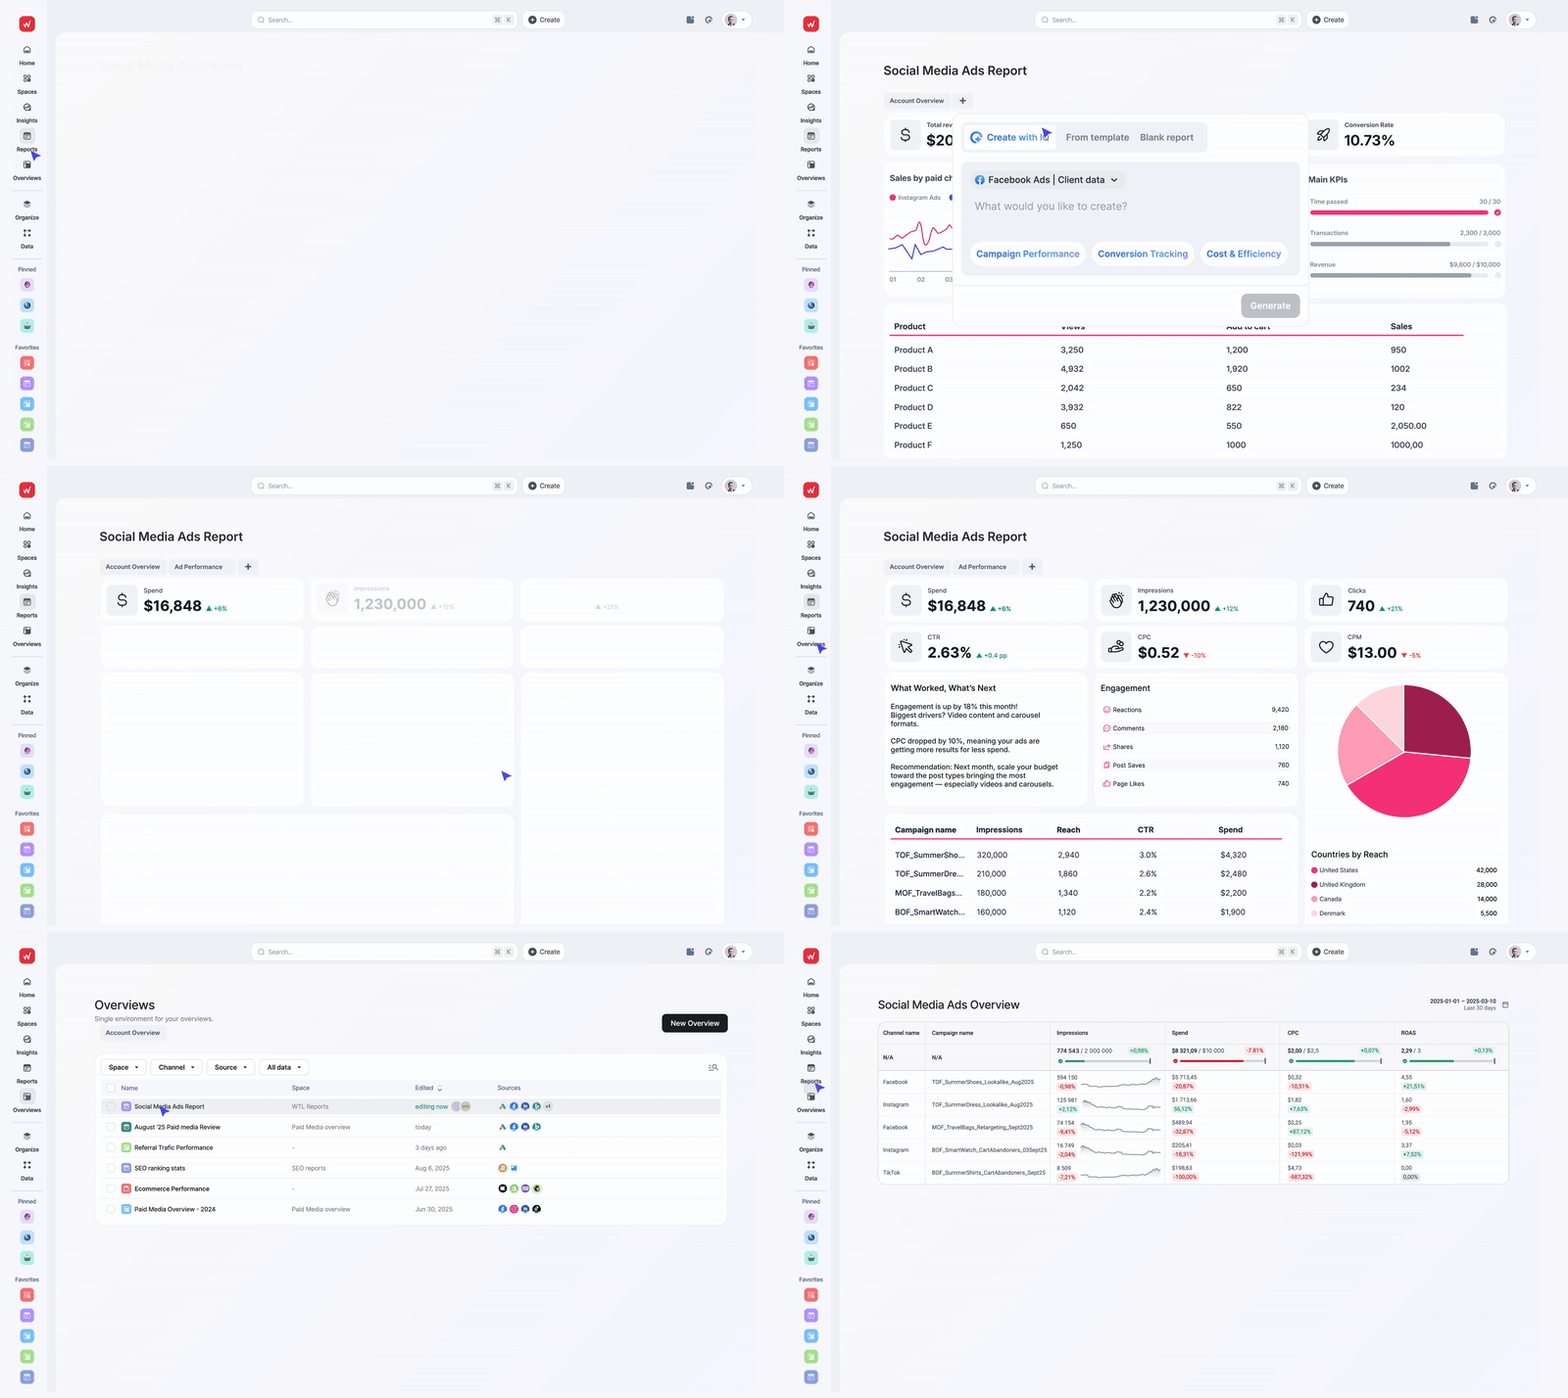
With Whatagraph IQ, you don’t start with a blank canvas or rebuild the same PPC report layout every month. You start with a prompt—and get a client-ready PPC report in seconds.
Using IQ Report Creation, you can simply type what you need, for example:
- “Create a cross-channel PPC report for Client X”
- “Show Google Ads, Meta, and LinkedIn performance for the last 30 days”
- “Build a monthly PPC report with spend, conversions, and ROAS”
Whatagraph IQ automatically generates:
- A full PPC report
- The right charts and breakdowns
- Clean, accurate visuals based on your connected data
Because IQ works only on your connected PPC and revenue data, the outputs are accurate, secure, and safe for client-facing reporting.
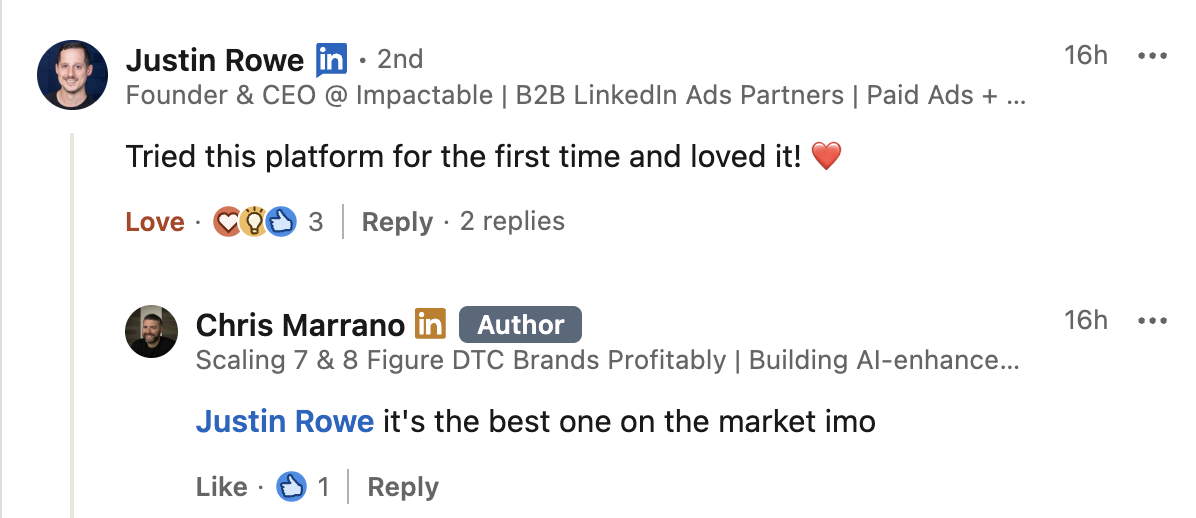
Marketers on LinkedIn are buzzing about how much they love Whatagraph’s AI reporting tool:
Want to give Whatagraph a spin? Start free and upgrade later (if you want to).
Option 2: Use ready-made PPC report templates
AI is the fastest path, but it’s not the only one.
If you’d rather start with a proven structure, Whatagraph offers pre-built PPC report templates with stunning, ready-made branding themes. Just plug in your Google Ads, Meta, or LinkedIn accounts and you’ll have a polished PPC report instantly.
This is especially useful for:
- Agencies standardizing PPC reporting across clients
- Teams that want inspiration without designing from scratch
- Faster onboarding of new clients or accounts
Here are our cult-favorite report templates among performance marketers:
- PPC report template
- Paid ads report template
- Facebook Ads report template
- Google Ads report template
- LinkedIn Ads report template
- TikTok Ads report template
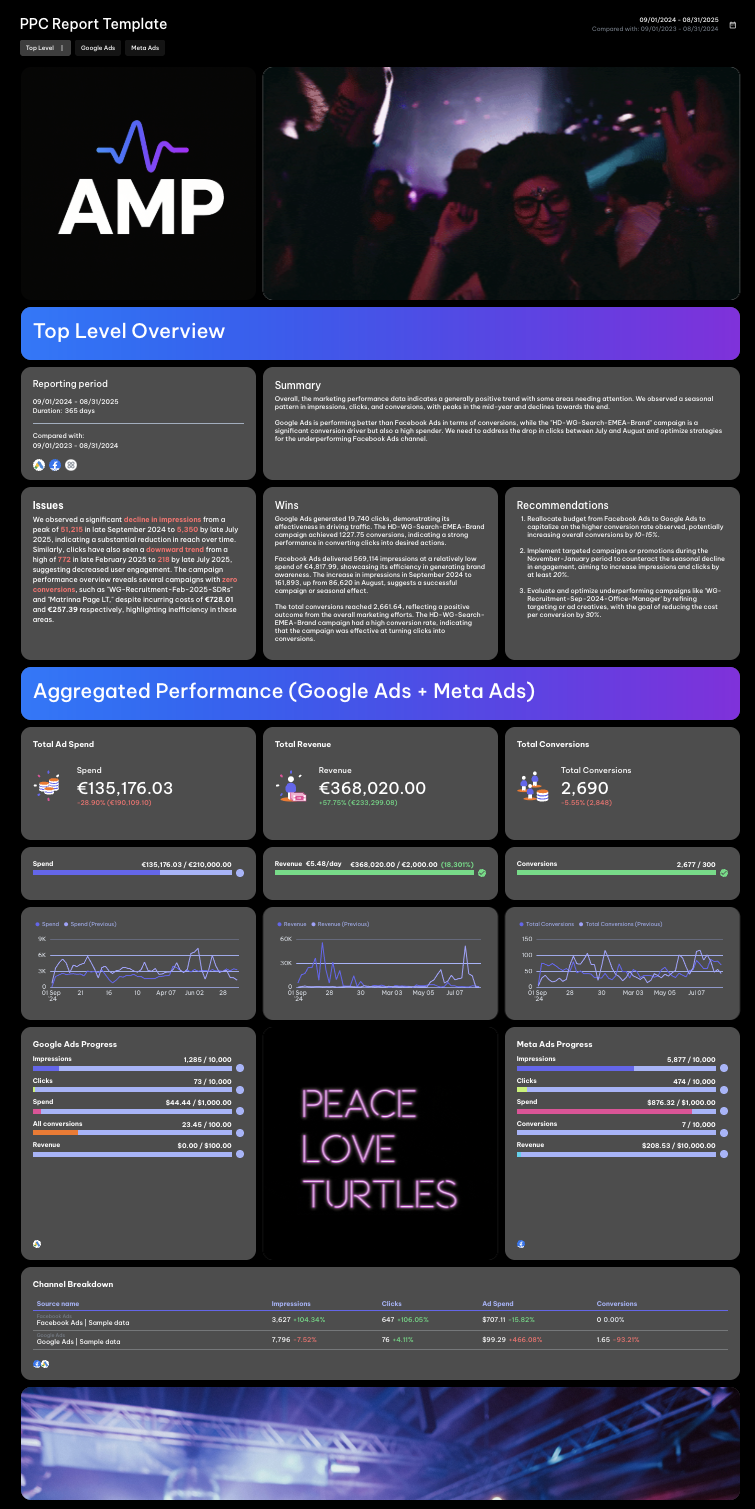
From there, you can:
- Customize the report with Whatagraph IQ
- Tweak layouts manually
- Or keep it as-is and automate delivery
Option 3: Build from scratch
If you’re the kind of marketer who prefers full control, you can still build PPC reports from scratch using drag-and-drop widgets.
The difference? You’re not forced to.
Whether you:
- Prompt your way to a report with AI
- Start from a PPC template
- Or fine-tune everything manually
Whatagraph gives you the fastest route to a client-ready PPC report, without locking you into one way of working.
That flexibility is exactly why teams replace hours of reporting work with minutes—and get back to delivering results.
3. Clear PPC Insights and Instant Answers
Building PPC reports is one thing.
Explaining them—clearly and confidently—is where most tools fall apart.
CPC, CTR, ROAS, spend, conversions… these numbers don’t explain themselves. And every report eventually leads to the same questions:
- “So… are we doing well?”
- “Why did performance change?”
- “What should we do next?”
This is where Whatagraph goes beyond dashboards.
Plain-Language PPC Insights With IQ Summary
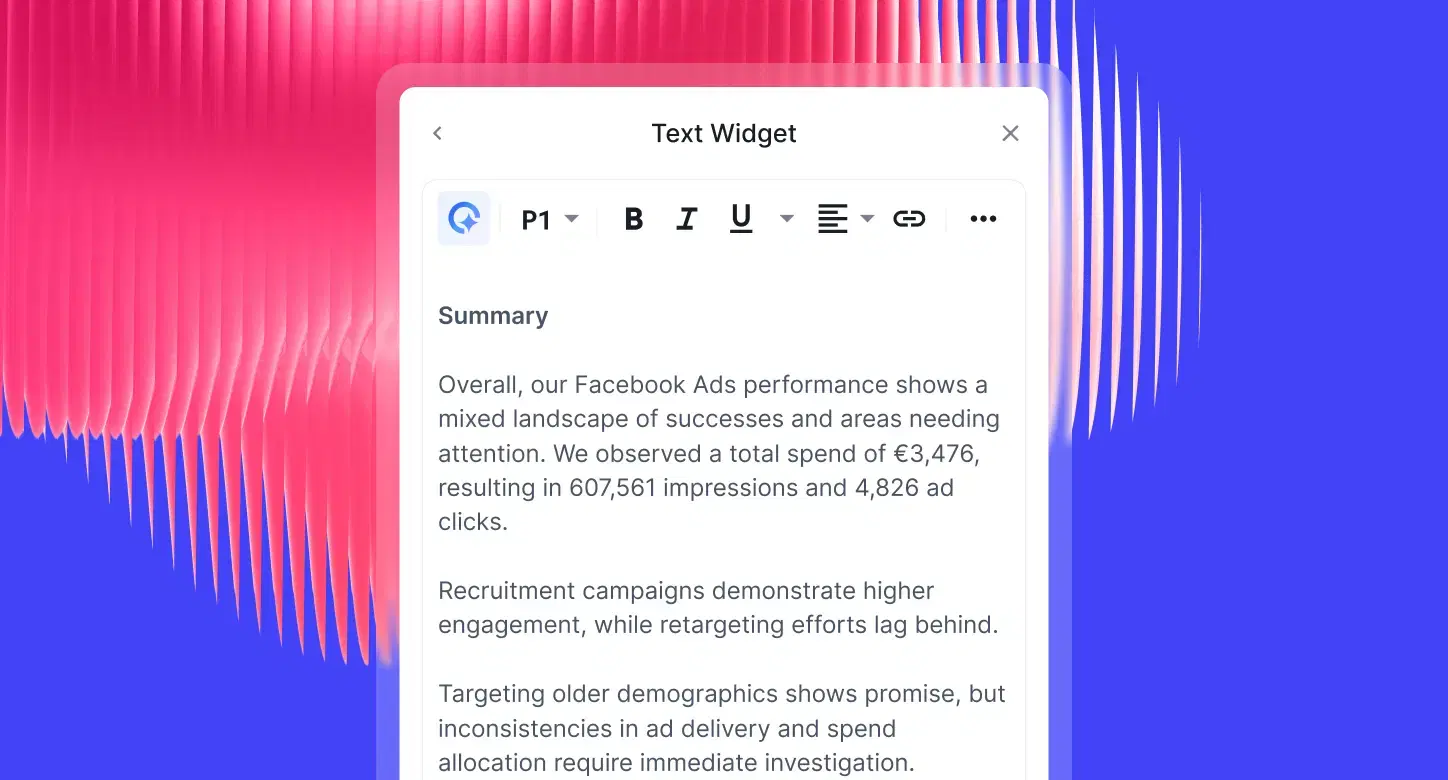
IQ Summary automatically turns your PPC data into clear, accurate explanations—written in plain language and grounded in your actual numbers.
Instead of manually writing performance updates, IQ Summary explains:
- What changed in PPC performance
- Why it likely changed (based on the data)
- Which campaigns, channels, or KPIs need attention
- What’s worth investigating or optimizing next
The summaries respect:
- Your selected date range
- Filters and segments
- The exact PPC accounts and channels in the report
That means you can confidently use them in:
- Client emails
- Monthly executive summaries
- Slides and board decks
- Internal Slack or Notion updates
Instant Answers to PPC Questions With IQ Chat
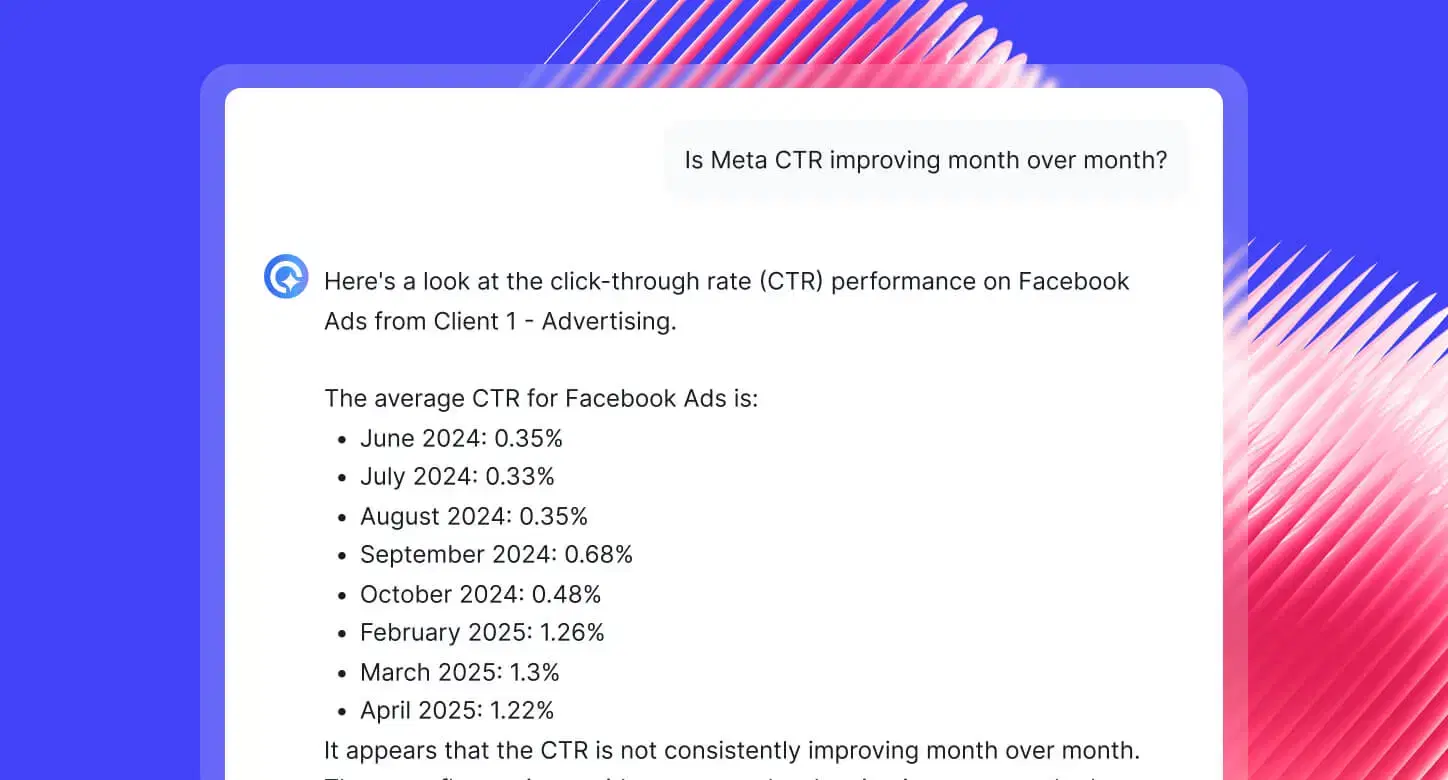
Then there’s IQ Chat—your fastest way to answer PPC questions without digging through dashboards.
Instead of clicking through filters and charts, you just ask:
- “Why did conversions drop last week?”
- “Which campaigns are wasting budget?”
- “What drove the ROAS change yesterday?”
- “How did Meta CPM trend in the last 30 days?”
IQ Chat understands the context of your report—the client, date range, channels, and filters—and responds with:
- Clear, direct explanations
- The exact metrics driving the change
- Suggested breakdowns to explore next
- Optional charts you can add to the report with one click
This is a game-changer for:
- Account managers minutes before a client call
- In-house PPC leads under pressure from leadership
- Teams without a data analyst on standby
Together, IQ Summary and IQ Chat remove the most painful part of PPC reporting: constant explaining, defending, and scrambling for answers.
You spend less time:
❌ Writing performance commentary
❌ Justifying numbers
❌ Answering the same questions over and over
And more time:
✅ Strategizing and optimizing campaigns
✅ Making budget decisions
✅ Acting on insights instead of reacting to reports
And marketers are loving it. Here's what Lars Maat says about the IQ Summary and Chat:
4. Your Entire PPC Reporting Stack in One Place
Most PPC teams don’t just struggle with reporting—they struggle with keeping everyone aligned.
One dashboard for clients.
Another for internal checks.
Alerts somewhere else.
Different numbers, different versions, constant confusion.
Whatagraph replaces all of that with one source of truth for PPC performance.
Performance marketers use Whatagraph not only to send reports, but to:
- Monitor PPC performance day to day
- Review accounts before client or exec calls
- Align teams on what’s working and what’s not
Everyone—account managers, specialists, and leadership—looks at the same data, in the same place.
No more “which report is correct?” conversations.
Cross-Account PPC Visibility With Performance Overviews
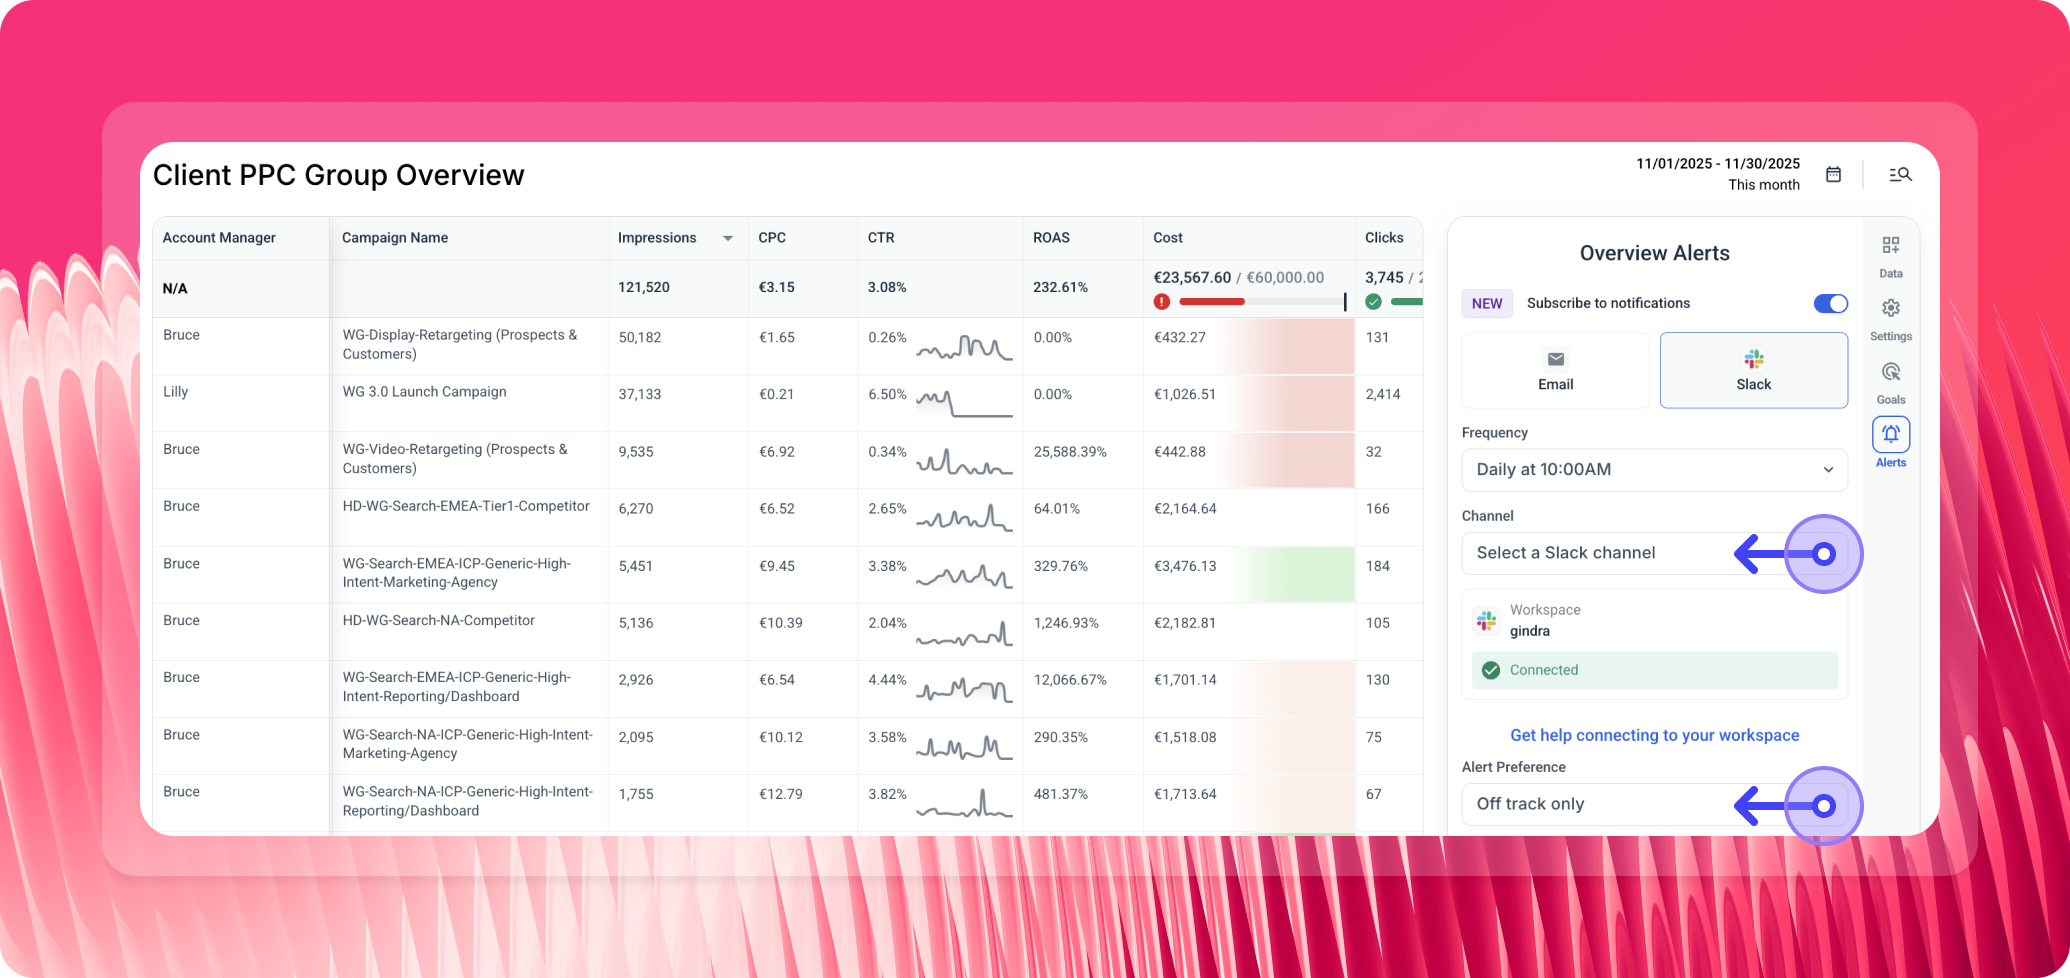 With Performance Overviews, you can see all your PPC activity at a glance:
- All clients, brands, or accounts in one view
- Spend, conversions, ROAS, and key KPIs side by side
- Quick filters by client, channel, region, or owner
This is especially powerful for:
- Agency owners overseeing multiple accounts
- Heads of performance spotting risks and wins early
- In-house teams managing several brands or markets
Goals and Alerts That Help You Act Faster
Instead of finding problems after the month ends, you can:
- Set goals for PPC KPIs like ROAS, CPA, spend, or conversions
- Get notified when performance goes off-track—or hits targets
- Catch issues early and reallocate budget with confidence
Reporting becomes proactive, not reactive.
That’s why teams like Peak Seven use it as their single source of truth—keeping clients informed, teams aligned, and reporting overhead low.
Kim Strickland, Digital Marketing Specialist at Peak Seven, says:
Whatagraph took us to the next level with our clients and within our team. With Looker Studio, everything was muddled. But Whatagraph has opened up transparency and communication. It’s now our Bible—both for our clients and our team.
At this point, Whatagraph isn’t just helping you report on PPC performance. It’s helping you run it better.
Start free today and make your life easier.
Whatagraph reviews from real users
Apart from all the valuable things the tool has in itself, throughout the years we've chatted with their support for minor issues multiple times, and they were very quick to fix everything of even make improvements based on our feedback. Stellar group of people, these.” (Source)
“The dashboards are clean, easy to build, and perfect for client reporting…I love how I can set up automated reports that look great and are client-ready. No more fiddling with spreadsheets or wasting time building slides.” (Source)
“If I was starting a digital agency today, signing up with Whatagraph would be one of my first moves.” (Source)
Pros
- Easiest marketing intelligence platform on the market
- Clean, accurate, unified data
- AI-generated reports, tabs, widgets, and summaries
- Fully branded reports in seconds
- 55+ stable, fully managed integrations
- Unlimited users on every plan
- Fast customer support that replies within 4 minutes
Cons
- Not a BI tool for deep SQL modeling
- Requires source credits (plans scale with data needs)
Pricing
Whatagraph’s pricing is designed around one idea: you shouldn’t pay for seats, you should pay for the data you actually use.
Every plan includes unlimited users and unlimited reports, so your whole team can collaborate without worrying about licenses.
Plan | Price | Source Credits | Includes |
| Free | $0 | Limited | Basic reporting, limited credits, forever-free access |
| Start | $229/month (billed annually) | 20 | Essential integrations, pre-made templates, data transformations, full Whatagraph IQ, live chat support |
| Boost | $579/month (billed annually) | 60 | Everything in Start + advanced integrations, custom data transformations, full white-labeling, performance overview dashboards, dedicated Customer Success Manager |
| Max | Custom pricing | 100+ | Everything in Boost + premium integrations, custom data aggregations, Whatagraph IQ+, SSO, tailored onboarding, priority support |
2. Looker Studio (Google Data Studio)
Most suitable for: Freelancers and boutique agencies.
Looker Studio is Google’s free reporting tool, which is popular among freelancers and even smaller agencies.
Also known as Google Data Studio, it comes with 21 native integrations with Google-based platforms like Google Ads, YouTube, Google Sheets, and Google Analytics.
You can also report data fromBigQuery, MySQL, and Microsoft SQL servers.
And we’re not afraid to say it—Looker has a huge fan base.
Not only does it come free (sort of), but it’s very flexible and straightforward.
Once you connect your sources, you can use its drag-and-drop editor to add all sorts of graphs and charts, filters and date ranges, custom text, and even apply custom styles and themes.
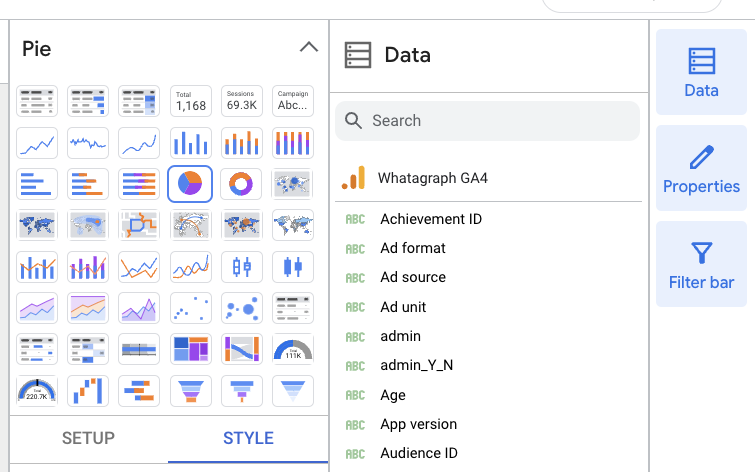
When you complete a report, you can send it to your clients via a link in scheduled emails or invite them to edit it.
However, Looker Studio is only “free” with Google Ads, Search Ads 360, Display & Video 360, and other Google-based PPC platforms.
For example, if you want to report the ROAS from Facebook Ads, Bing Ads, or LinkedIn Ads, you’ll have to use a data pipeline tool like Funnel or Supermetrics to bring this data to Looker.
In that case, your PPC reporting solution is not free anymore, as you need to buy a data pipeline tool as well.
But cost is not the only problem here.
It also means you need to become familiar with two tools, which take some time to master.
The third problem is that you’re forced to use third-party data connectors, which often break or deliver inaccurate data.
For example, at any given time, the data you bring from non-Google sources may not be up to date.
Why?
Because third-party connectors have different refresh rates than Google’s native connectors.
This can cause all sorts of problems or misunderstandings down the road, especially if you use Looker to report on clients' PPC campaigns.
As we mentioned already, Looker Studio has a high learning curve.
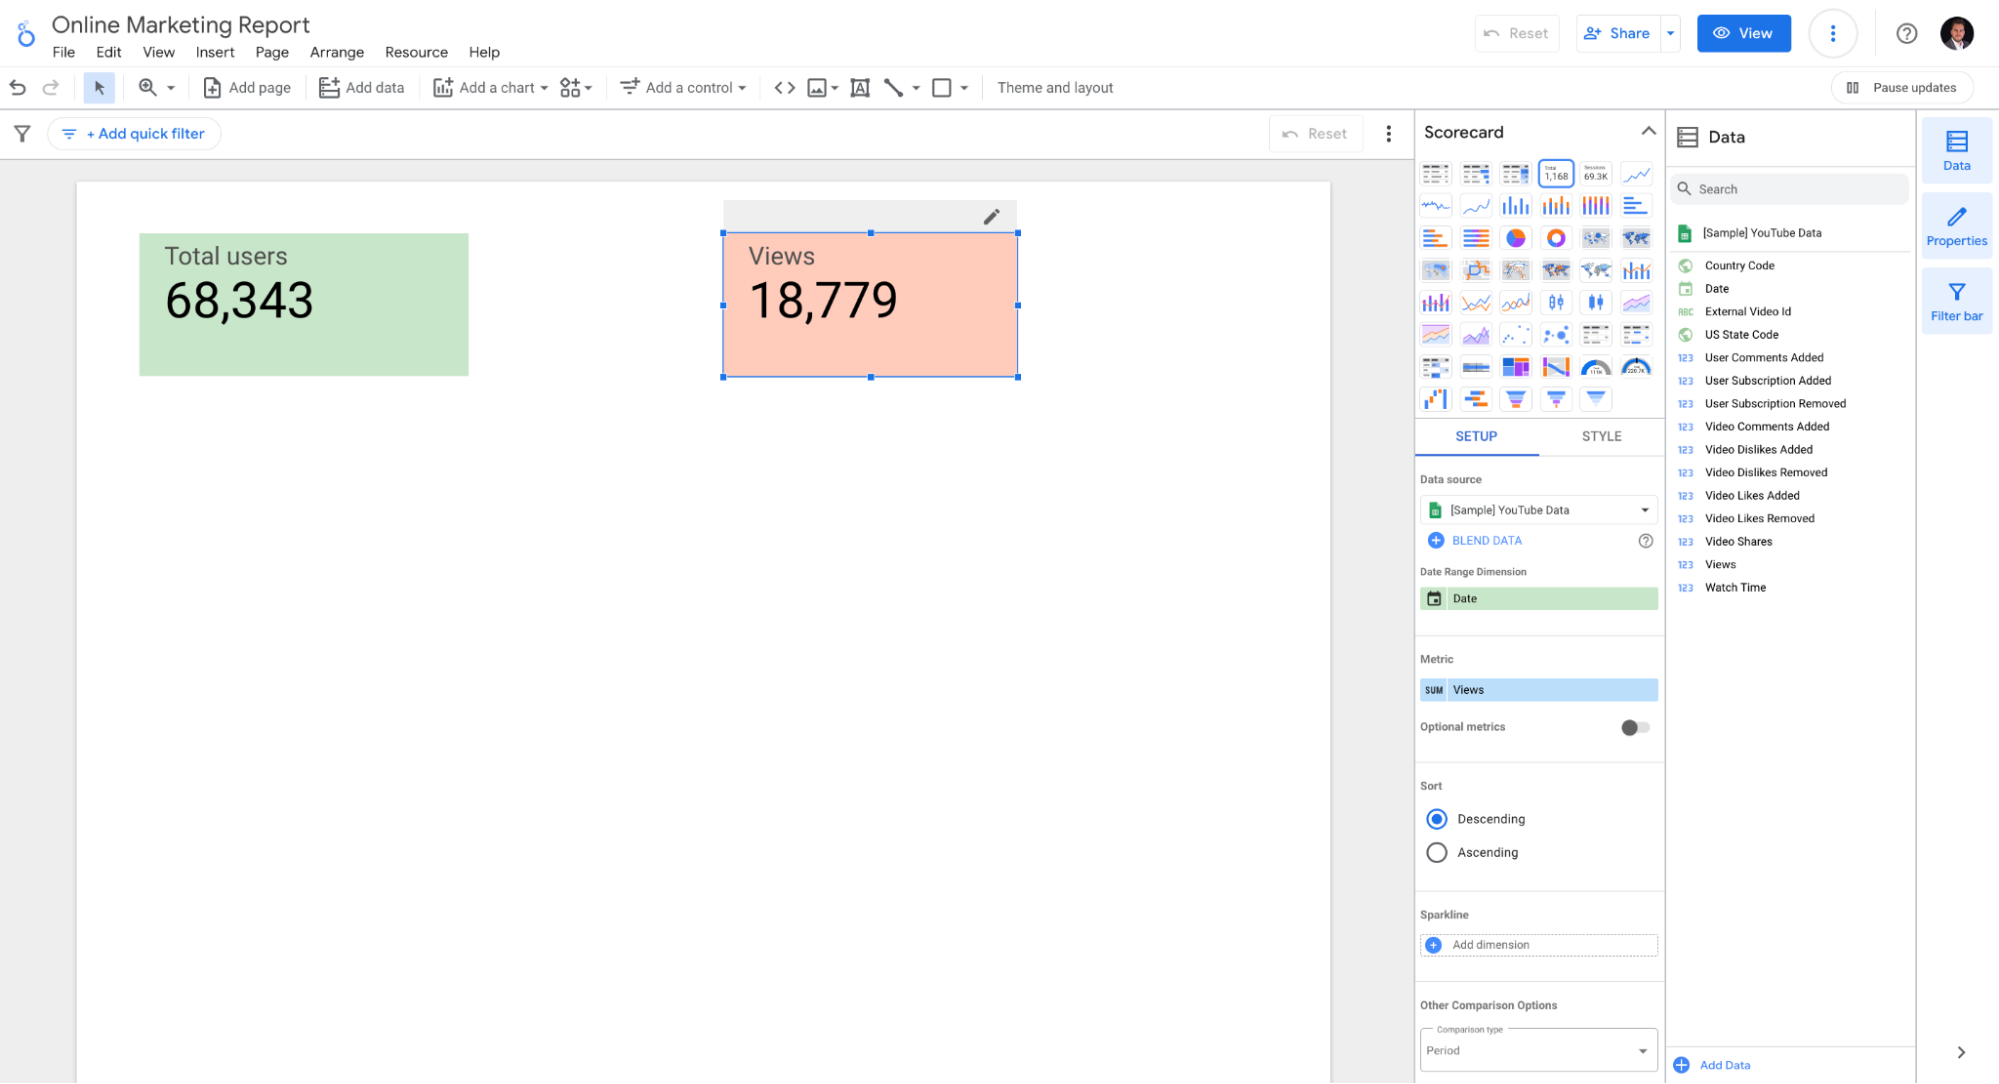
It’s relatively easy to create basic reports, but building anything more complex and presentable to clients takes a lot of time.
Why?
Because You need to customize each widget, graph, and chart manually.
For example, when you try to create a calculation or blend, you need to go back and forth between steps and views to make sure you're doing everything correctly.
Also, Looker Studio can be slow, clunky, and doesn’t have customer support (unless you buy the Pro plan).
It also limits you in the number of sources you can blend together — even with two sources in the blend reports load visibly slower.
Key features:
- 21 native connectors (free)
- 1000+ “partner” connectors (paid)
- Drag-and-drop report builder
- Data blends
- Custom images and text
- Custom styles and color schemes
- Mobile app
Reviews from real users
“Looker is really powerful and very effective at presenting complex data - included blended metrics - in a very clean and visually appealing way. Unfortunately, connectors break quite regularly and reports containing a lot of data can take a lengthy time to load.” (Source)
“Some of our dashboards take a really long time to fully load. This especially causes problems when we're presenting or trying to show others our marketing KPIs.” (Source)
“Sometimes I need to be more knowledgeable to use this tool. Dashboard takes time to update. It takes more time to load large sized data. When I create more complex reports, the tool gets slow and emerge with glitches also.” (Source)
Pros:
- Free (up to a point)
- A wide choice of data visualization formats and options
- Easy to create simple reports
Cons:
- Slow-loading reports (the more data the slower it gets)
- Connection breakages and inaccurate data
- Limited refresh rates for non-Google APIs
- Limited report-sharing options (no Word, Sheets, or PDFs)
Pricing
Looker Studio is free for connections with 21 native integrations, which are mostly Google-based platforms.
3. DashThis
Most suitable for: Small businesses and freelancers.
DashThis is a simple marketing reporting tool that connects to 34+ marketing platforms and uses dashboards to visualise KPIs.
The good news is that all the “big” advertising platforms are there—Meta Ads, Google Ads, LinkedIn Ads, TikTok Ads, and more.
If you need to connect PPC data from a source they don’t support yet, you can use a CSV file or Google Sheets.
To create a report, pick one of the suggested templates or start from a blank report. 
If you start from a template, first, you need to fill in things like the region, currency, and reporting period.
If you start from scratch, you need to populate the report page with widgets.
However, these are not drag-and-drop widgets.
Instead, when you select a widget, the tool fits it on the report at the most optimal place. This depends on its size and the number of widgets already there.
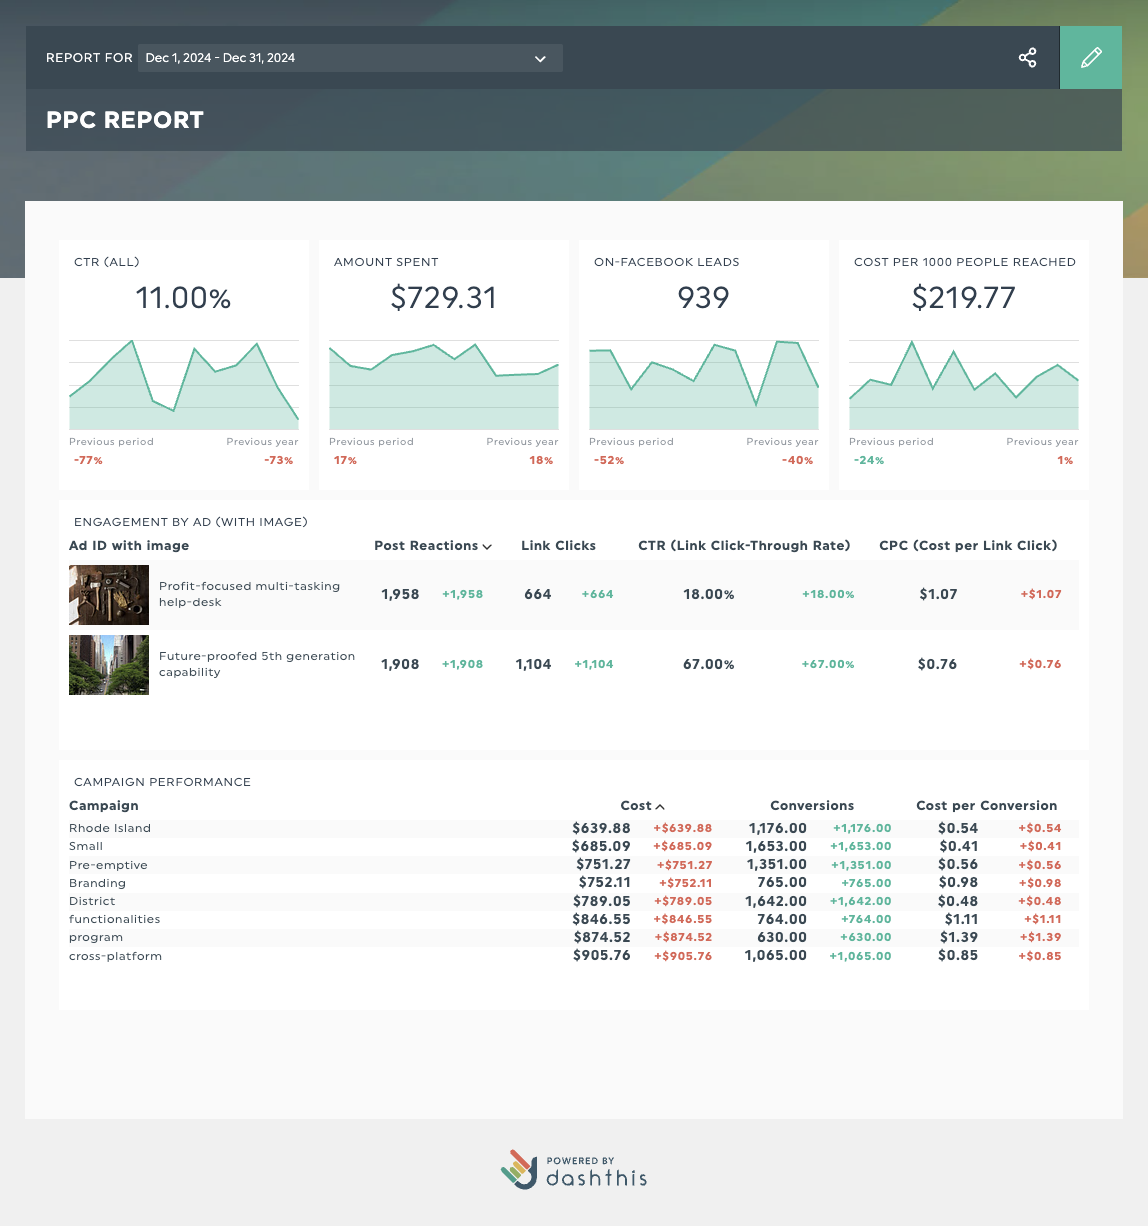
When it comes to white labelling, You can:
- Create custom domains
- Replace the “DashThis” logo with your own
- Customize color themes
However, with few options to organize or customize your marketing data, DashThis is more suitable as a PPC report generator for freelancers or small businesses.
The lack of AI insights is also a downside, especially for agency users, as many clients are non-marketing types who go straight for comments and summaries.
Key features:
- 34+ integrations
- Custom data upload via CSV file or Google Sheets
- Visualization dashboards
- Automatic data refreshes
- Upload client or brand logos
- Create custom widgets, domains, color schemes, and email addresses
- Library of report templates
- Report sharing via email, URL, or PDF
Reviews from real users
“I like that it is caters to different target audiences who might have marketing needs that are different e.g. small business owners and freelancers.” (Source)
“We've always seemed to have a few issues with exporting as PDF's, particularly with the formatting of our comments in reports. The ability for more custom designs without paying more for custom design / white label means we probably would have been retained further.” (Source)
“Unable to be flexible with the types of reports we're doing dates wise. It'd be nice to be able to change the dates to weeks or years within our dashboards without having to build an entire report. Especially when your reports are already full, there isn't much flexibility.” (Source)
Pros:
- Pick up and use
- Many templates and dashboard examples available
- Relatively inexpensive
Cons:
- Limited data organization and customization features
- Limited data integrations
- Basic-looking reports
- Visuals lack customization
Pricing
As of January 2025, DashThis offers four pricing plans:
- Individual: $49/mo or $42/mo, paid yearly. Includes 3 dashboards. No white-labelling features, personalized onboarding, or priority support.
- Professional: $159/mo or $135/mo, paid yearly. Includes 10 dashboards. No personalized onboarding or priority support.
- Business: $309/mo or $264/mo, paid yearly. Includes 25 dashboards, white labelling, personalized onboarding, and priority support.
- Standard: $479/mo or $409/mo, paid yearly. Includes 50 dashboards, white labelling, personalized onboarding, and priority support.
4. ReportGarden
Most suitable for: Small businesses and advertising agencies.
ReportGarden is a dashboard and reporting tool for small businesses or PPC agencies. You can use it to automate cross-channel reporting, manage campaign budgets, and create invoices.
It comes with pre-built integrations with ad platforms like Google Ads, Facebook Ads, and Bing Ads.
There’s a handy client management view where you can see all your clients, their connected accounts (sources), the active reports you have for each, and the contacts and invoices.
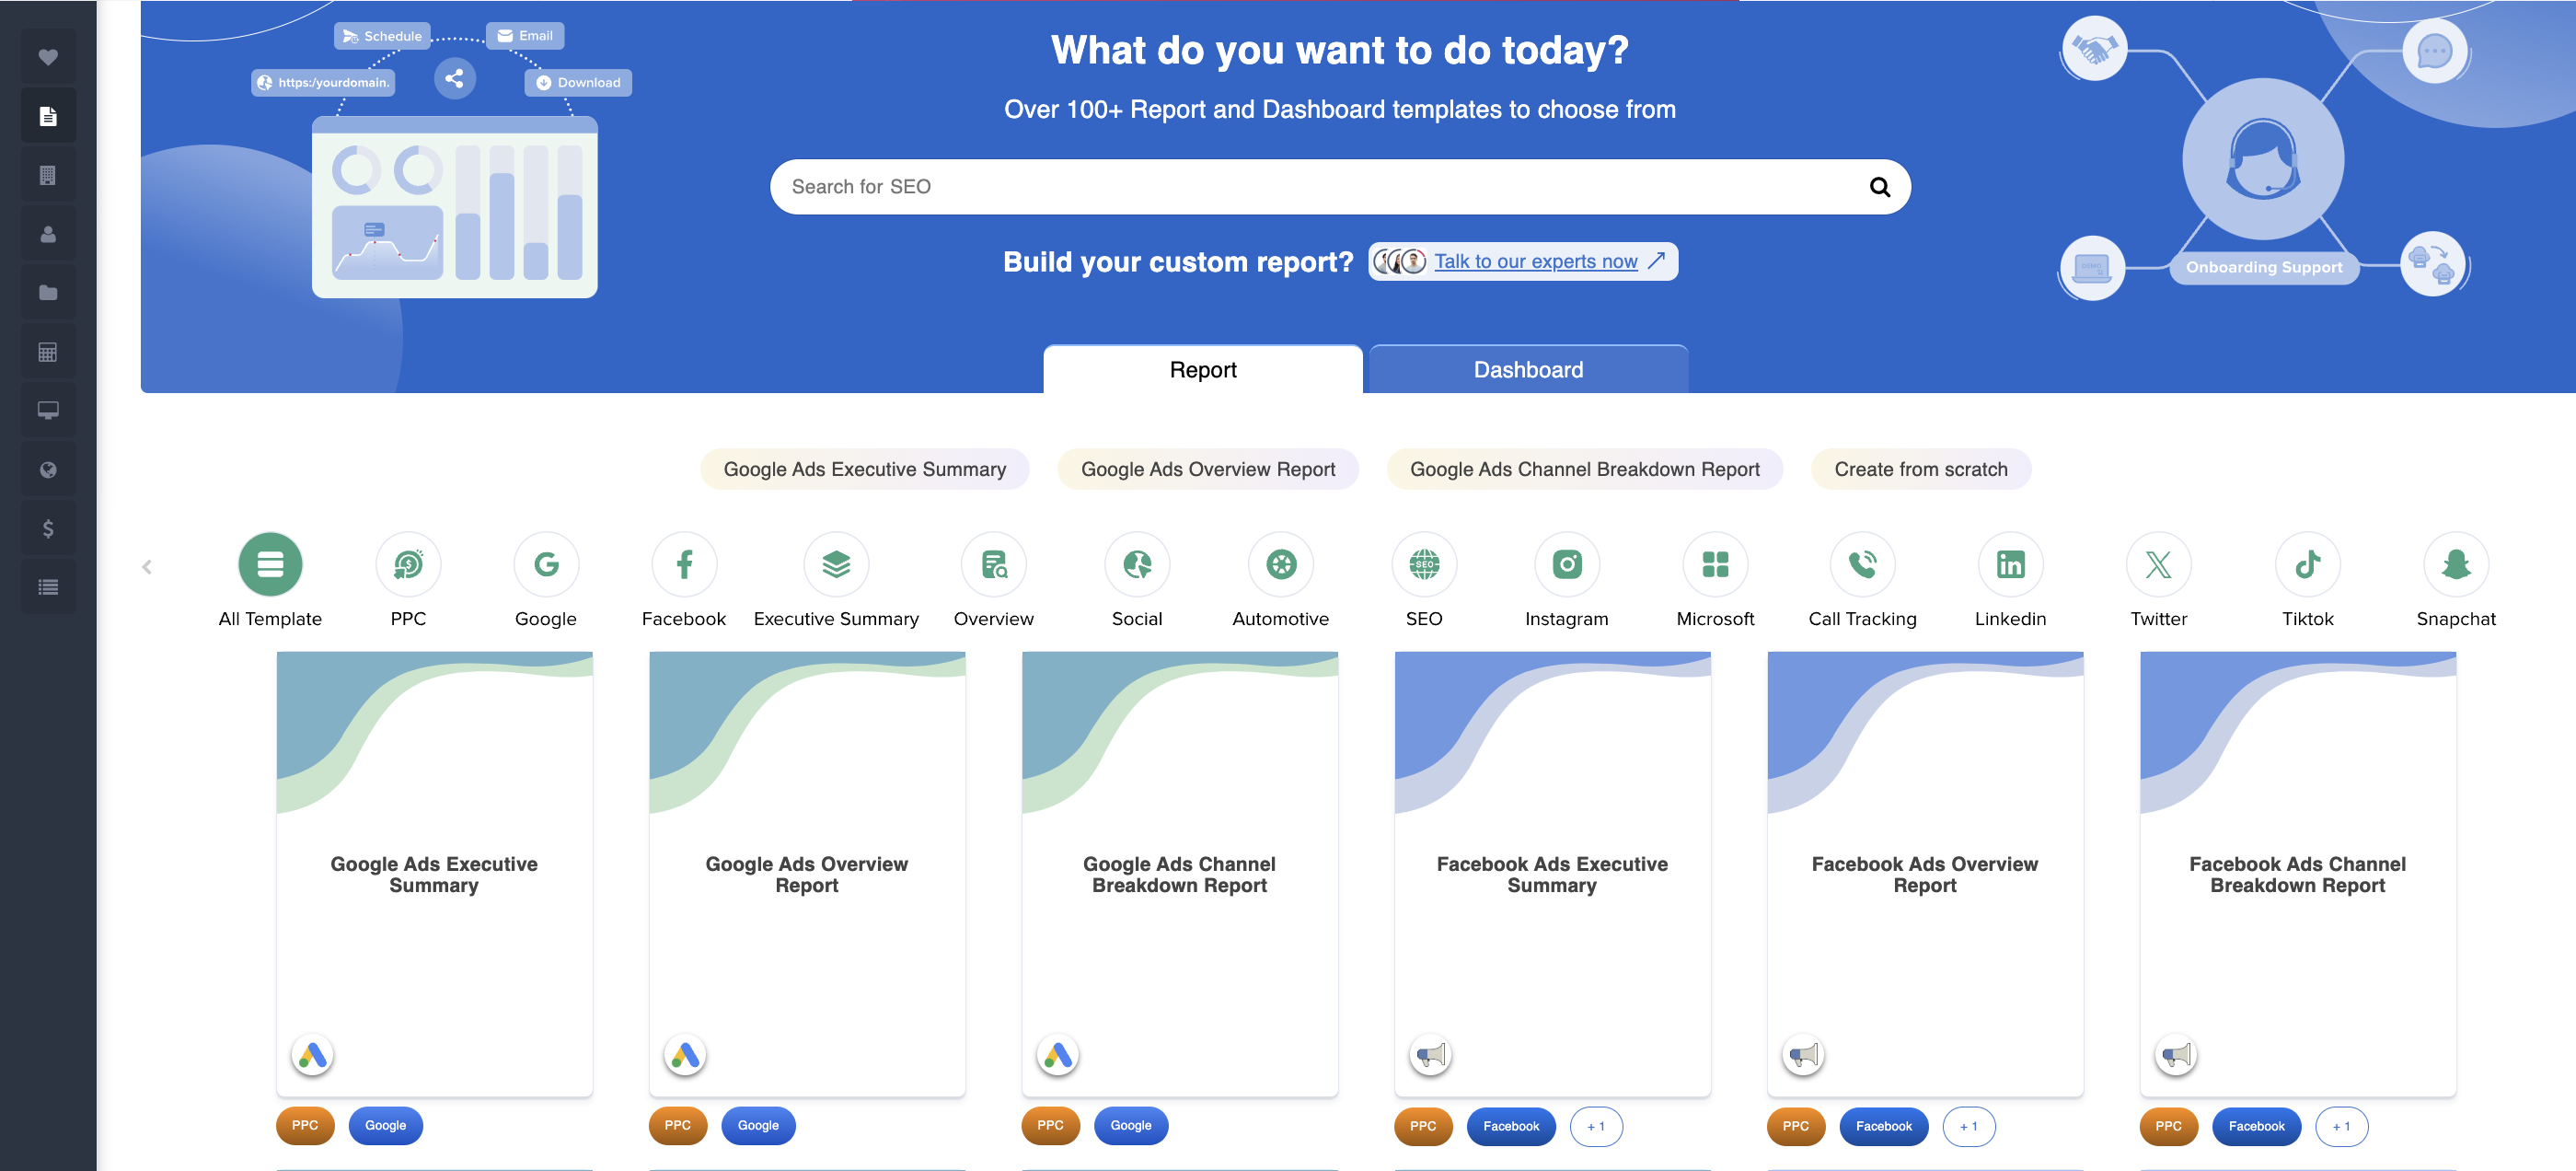 When creating a report from scratch, first, you must select the client for which the report is intended.
All the sources connected to that client will be available in the report.
You have three widget groups to choose from:
- Static widgets: Text, Image, Calendar
- Data widgets: Different types of charts such as KPI (single value), table, pie, line, map, etc.
- Ad-preview widgets: A new type of widget that visualizes the best-performing social media post or ad creative.
(Psst. Whatagraph has had a similar media widget for a long time.)
The widgets stick to the grid but it’d be easier if we could see the actual grid in the report building phase.
There are pop-up margins that help you center each widget onto the report page, which reminds of Looker Studio’s report builder.
You can customize the color of the report page and add a background image as an option. You can also change the style and theme of every widget.
However, there are so many options here that you’ll probably need to ask your team’s graphic designer to help you out.
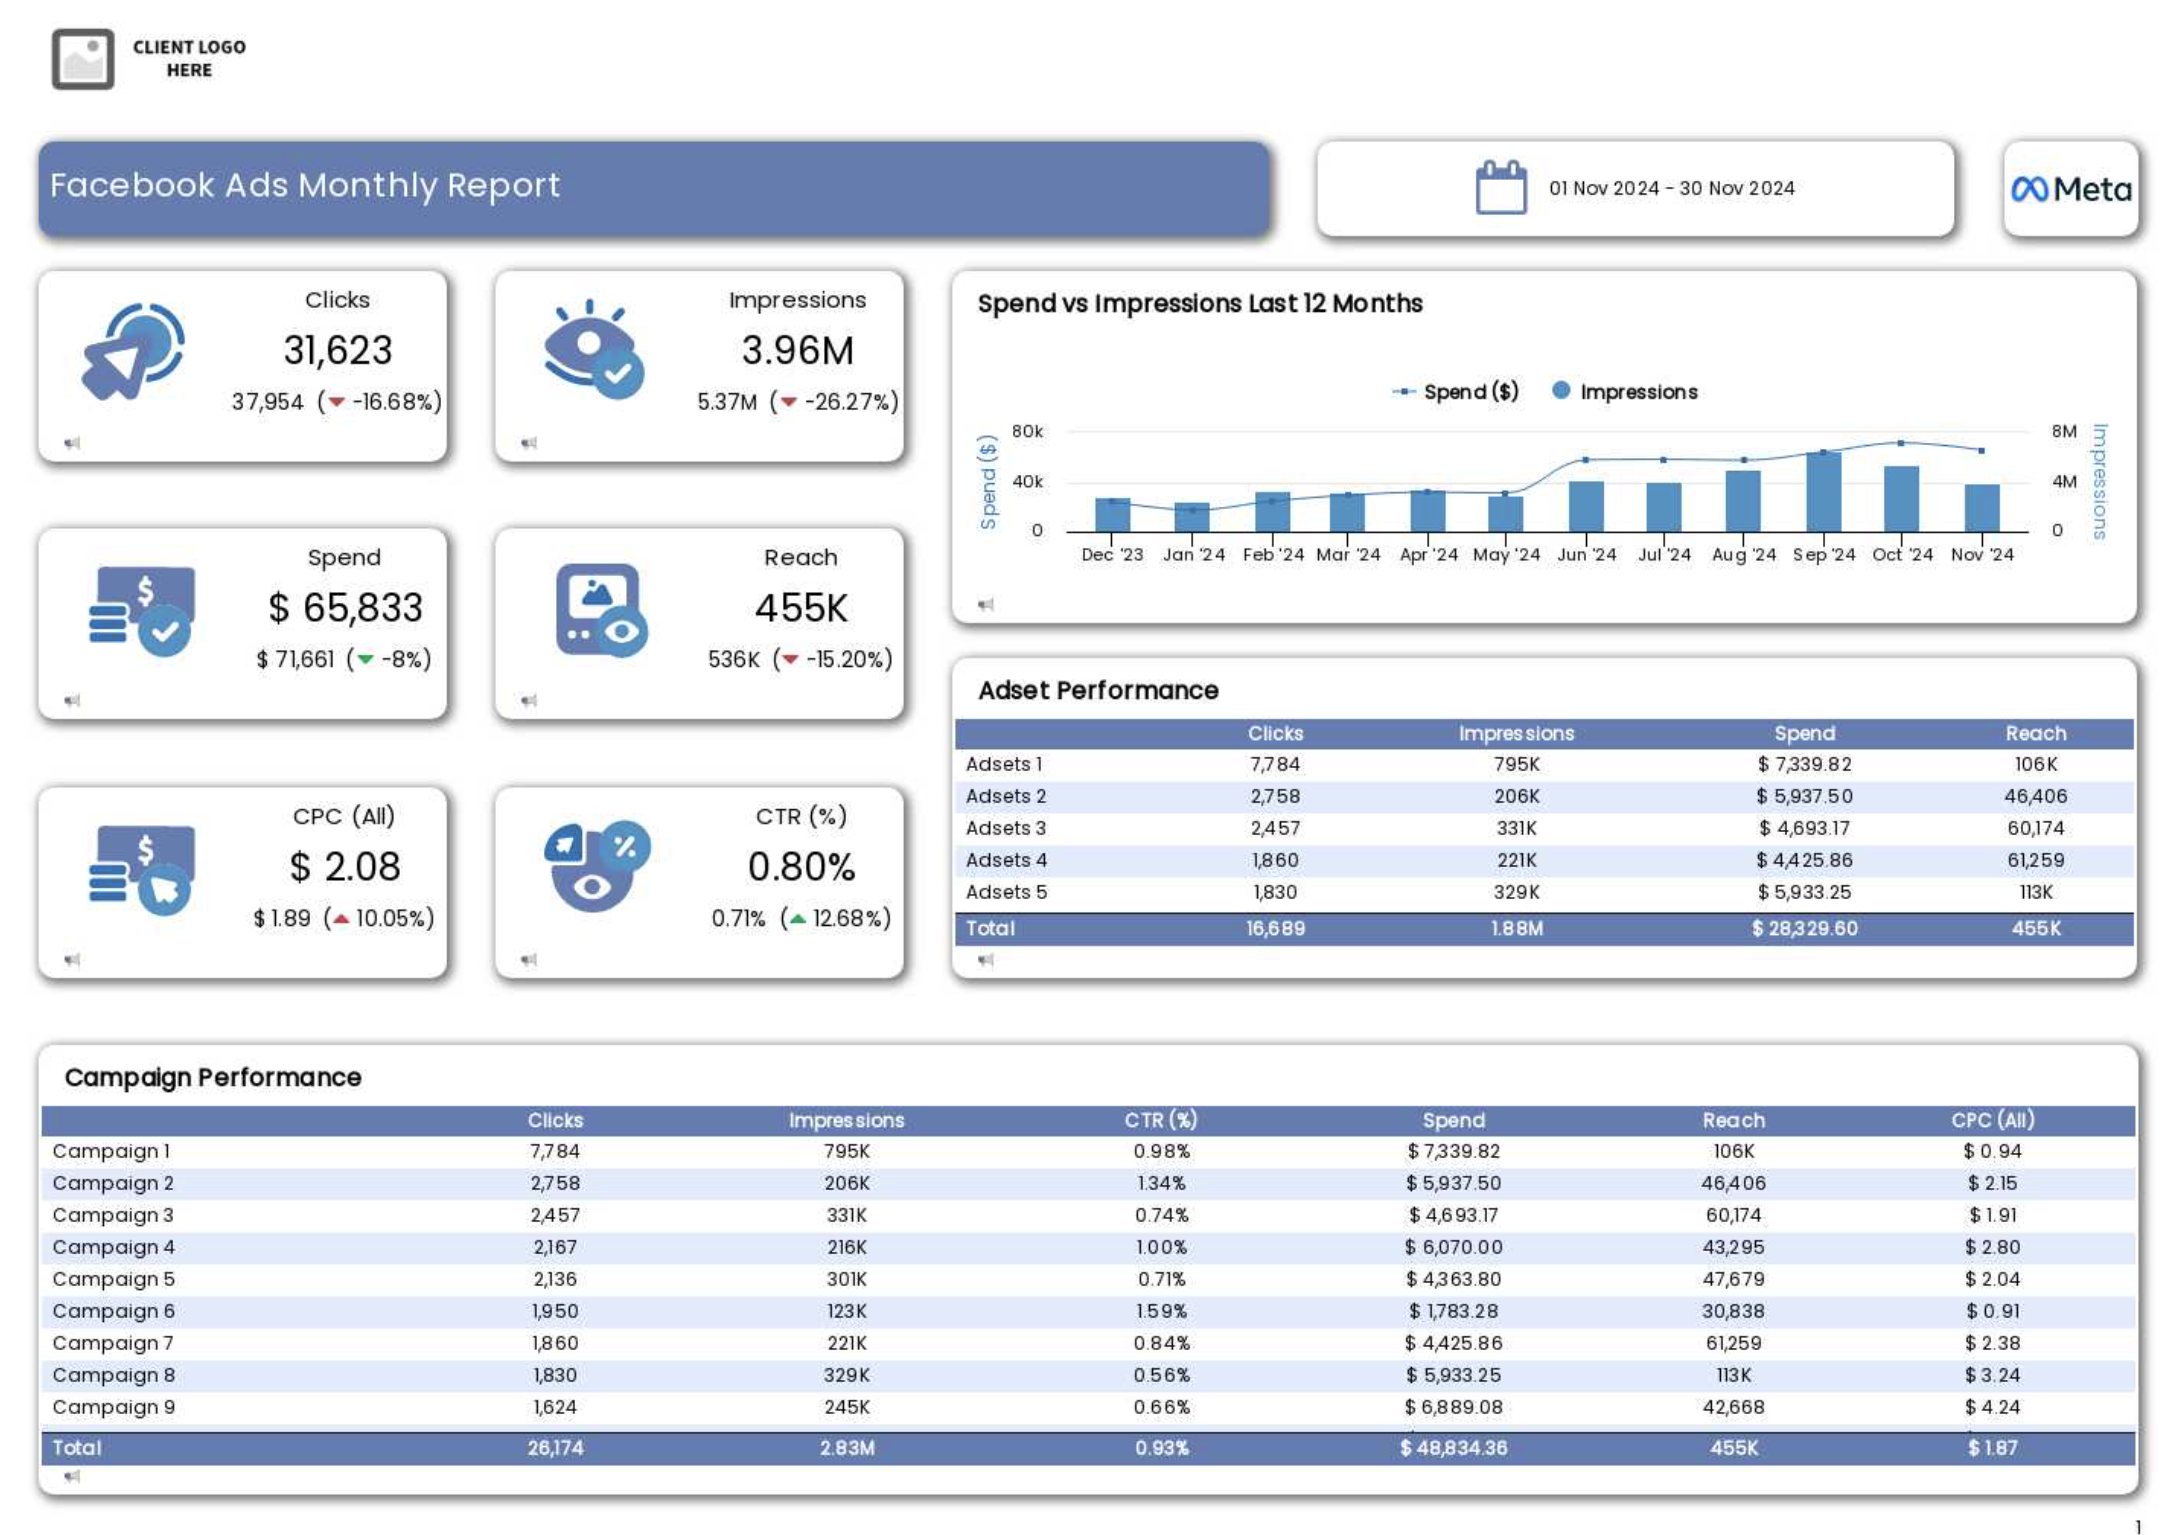
So, how does ReportGarden stand against the tools we’ve reviewed so far?
The report-building environment is very similar to DashThis. Before you start, you need to choose whether you’re building a report or a dashboard.
DashThis has a more polished user experience, and it’s easier to use overall.
ReportGarden has more advanced PPC-specific options, like budget tracking, plus drag-and-drop widgets.
Looker Studio is more flexible and customizable (with technical expertise), but ReportGarden has many direct connectors for non-Google PPC platforms.
ReportGarden comes with multi-client management and PPC-focused integrations but lacks advanced data organization and customization features that full-service digital marketing agencies or big organizations need.
Even more common ones, like data blending and custom metrics, are not available.
Also, there’s no way to edit multiple reports at once, as you can do in Whatagraph.
Next, ReportGarden doesn’t have an agency-level performance dashboard, such as Whatagraph’s Overview.
That makes tracking campaign performance across all clients difficult and time-consuming.
We’ve also heard cases where a report pulled data for the wrong client or account, which resulted in inaccurate insights.
Finally, if you want to use all the available integrations, you’d have to go for the most expensive Custom plan, while in Whatagraph, you have access to all channels even with the lowest pricing plan.
All things considered, ReportGarden would be a good PPC reporting platform for startup businesses with moderate data and reporting needs.
Key features:
- Plenty of pre-built PPC integrations
- Budget tracking to monitor ad spend and campaign budgets directly in reports
- White-label and customize branding for reports
- Streamlines account handling
- Scheduled reports for daily, weekly, or monthly delivery
Reviews from real users
“The one thing we dislike is the fact we are unable to filter the report per ad without creating a filter on every widget you have in your report. It is a little time consuming doing it on all widgets but if you could be able to select ad account, select ad and then generate a report for just that ad, it would be phenomenal.” (Source)
(Pro tip: Source filtering up to the ad level is possible in Whatagraph.)
“Sometimes my scheduled reports won't run or pull in the wrong Information.” (Source)
“Reports are easy to automate and very visual. Can we very fiddly until you get the hang of the software. Great customer service team that are happy to help in many ways.” (Source)
Pros:
- Minimal learning curve
- Strong multi-client management and white-labeling options.
- Automated reporting
- Pricing tiers for different usage needs
Cons:
- Time-consuming report-building and maintenance
- Lacks advanced data manipulation features like custom metrics and blending
- Limited scalability and time-saving features for bigger agencies
- Data refresh rates are not real-time and depend on pre-set schedules
- Very simple visualizations
Pricing
As of January 2025, ReportGarden offers four pricing plans:
- Basic: $89/mo or $74/mo, paid yearly. Only basic Google integrations and up to 5 users.
- Standard: $149/mo or $124/mo, paid yearly. Everything in Basic + Custom domain, Facebook Ads and Bing integrations, up to 20 users.
- Professional: $299/mo or $249/mo, paid yearly. Everything in Standard + nearly all PPC integrations and free onboarding.
- Enterprise: Custom pricing plan. Everything in Professional + access to all integrations, unlimited users, and monthly training sessions.
5. AgencyAnalytics
Most suitable for: PPC and SEO marketing agencies.
AgencyAnalytics is a user-friendly reporting software for PPC, designed for small to mid-sized marketing agencies that need streamlined monitoring and reporting for their ad campaigns.
You can connect to 80+ data sources, including major PPC platforms like Google Ads, Facebook Ads, Bing Ads, and a score of other advertising tools.
This makes AgencyAnalytics a strong choice for marketers focused on PPC.
AgencyAnalytics’ biggest advantage over LookerStudio, DashThis and ReportGarden is their AI insights.
You can ask AI questions about your data, and it will give you summarized insights (although readability is not the best).
You can also use this AI bot to discover hidden trends and opportunities.

Compared to DashThis, AgencyAnalytics has more capable multi-client management and team collaboration tools but has a steeper learning curve if you try to customize your reports.
While Looker Studio offers more flexibility in report customization, plus advanced data transformation options, AgencyAnalytics is easier to use and faster to set up for PPC reporting.
You don’t need technical expertise to create decent-looking reports in AgencyAnalytics.
Unlike ReportGarden’s daily refresh rates and complicated custom design, AgencyAnalytics brings near real-time reports and intuitive white-labelling options.
This makes it especially appealing for agencies that value client transparency and quick insights.
However, users say the platform can be unstable, as sources can disconnect frequently due to “service bandwidth” issues.
AgencyAnalytics also lacks advanced data calculations, and its dashboards are limited and not very flexible.
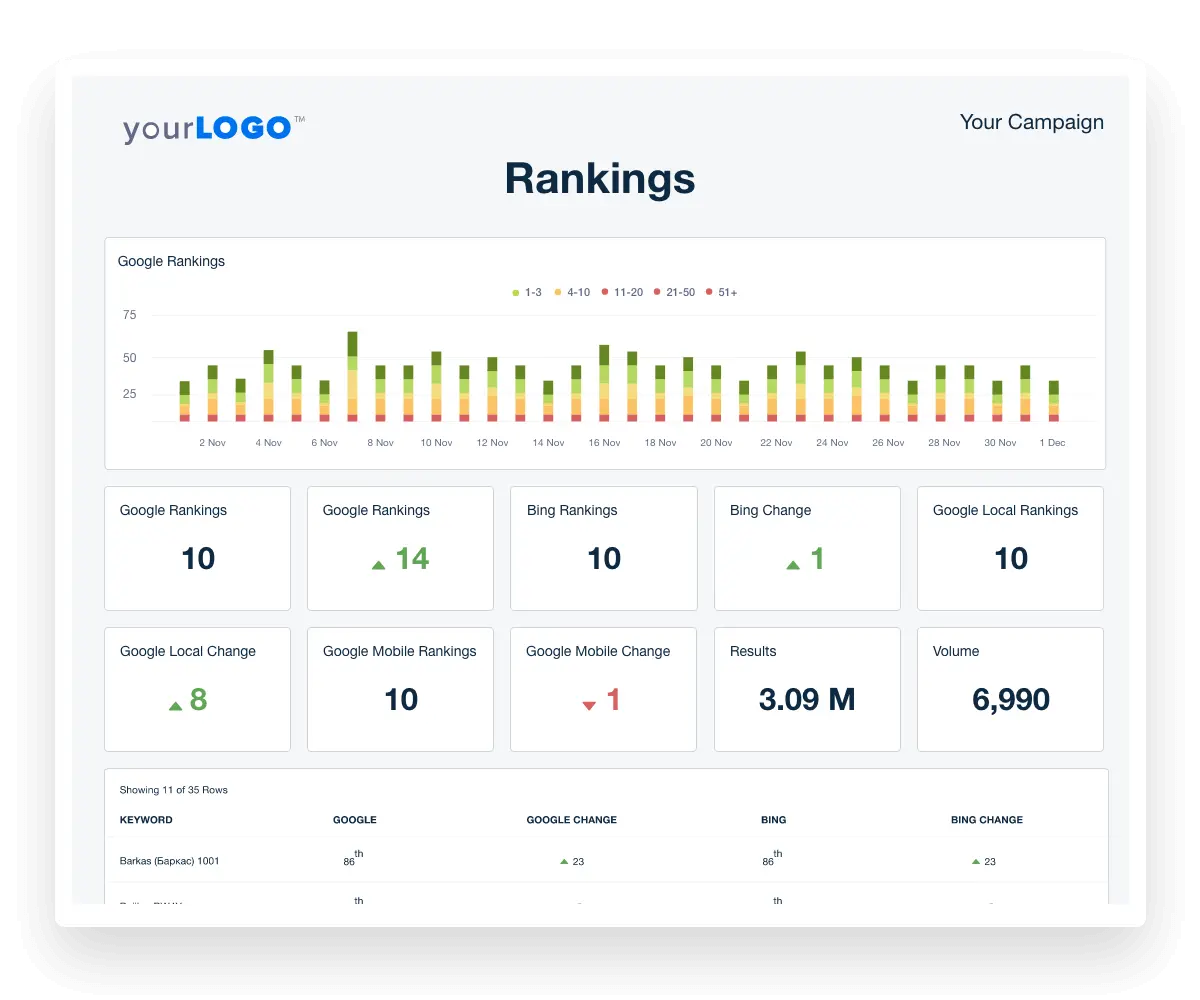
Key features:
- Direct integrations to PPC platforms
- Ready-made templates
- White-label reports and branding
- User roles and collaboration
- AI features
Reviews from real users
“There are lots of integrations to pick from, however I feel that it could include more. Sometimes I have also found that the data pulled in does not match that inside the business centres across the source platforms.” (Source)
“It can sometimes be a little buggy and take time to load. Adding new integrations can sometimes be challenging because of this.” (Source)
“There are limitations on how you design the reports. It's also not clear if you have a scheduled report going out that requires approval before it goes out.” (Source)
Pros:
- Easy to use with minimal technical expertise
- Large library of templates
- Cost-effective
Cons:
- Glitchy
- No advanced data calculations and organization features
- Limited integrations
Pricing
As of January 2025, AgencyAnalytics offers three plans:
- Launch: $79 or $59/month, paid yearly for 5 client campaigns and basic branding.
- Grow: $239 or $179/month, paid yearly for 10 client campaigns, AI features, metric alert, and full branding.
- Perform: $479 or $349/month, for 15 client campaigns, trend forecasting, and data aggregation.
6. Swydo
Most suitable for: Small PPC or digital marketing agencies.
Swydo is an automated monitoring and reporting platform tailored to small to medium-sized marketing agencies and freelancers who want to simplify the monitoring and reporting process.
The platform has 3 functionalities:
- Connect data: You can pull data from 32+ integrations and combine it into one multi-channel report. This includes popular PPC platforms like Google Ads, Facebook Ads, and TikTok Ads.
- Report: Create reports easily from templates or from scratch using pre-set widgets and available metrics for each channel. You can share the reports as PDFs, dashboards, or live presentations. There’s also a handy email scheduler where you can quickly set up automated sending.
- Monitor: You can use this view to track your clients’ KPIs to quickly spot and address issues and opportunities. Swydo also comes with KPI boards, client KPI overviews and alert notifications.
Compared to ReportGarden or DashThis, Swydo has a much more polished UI. Once you sign up, you instantly know what’s what and where to start.
Compared to AgencyAnalytics, Swydo has smoother report automation and better pre-built templates.
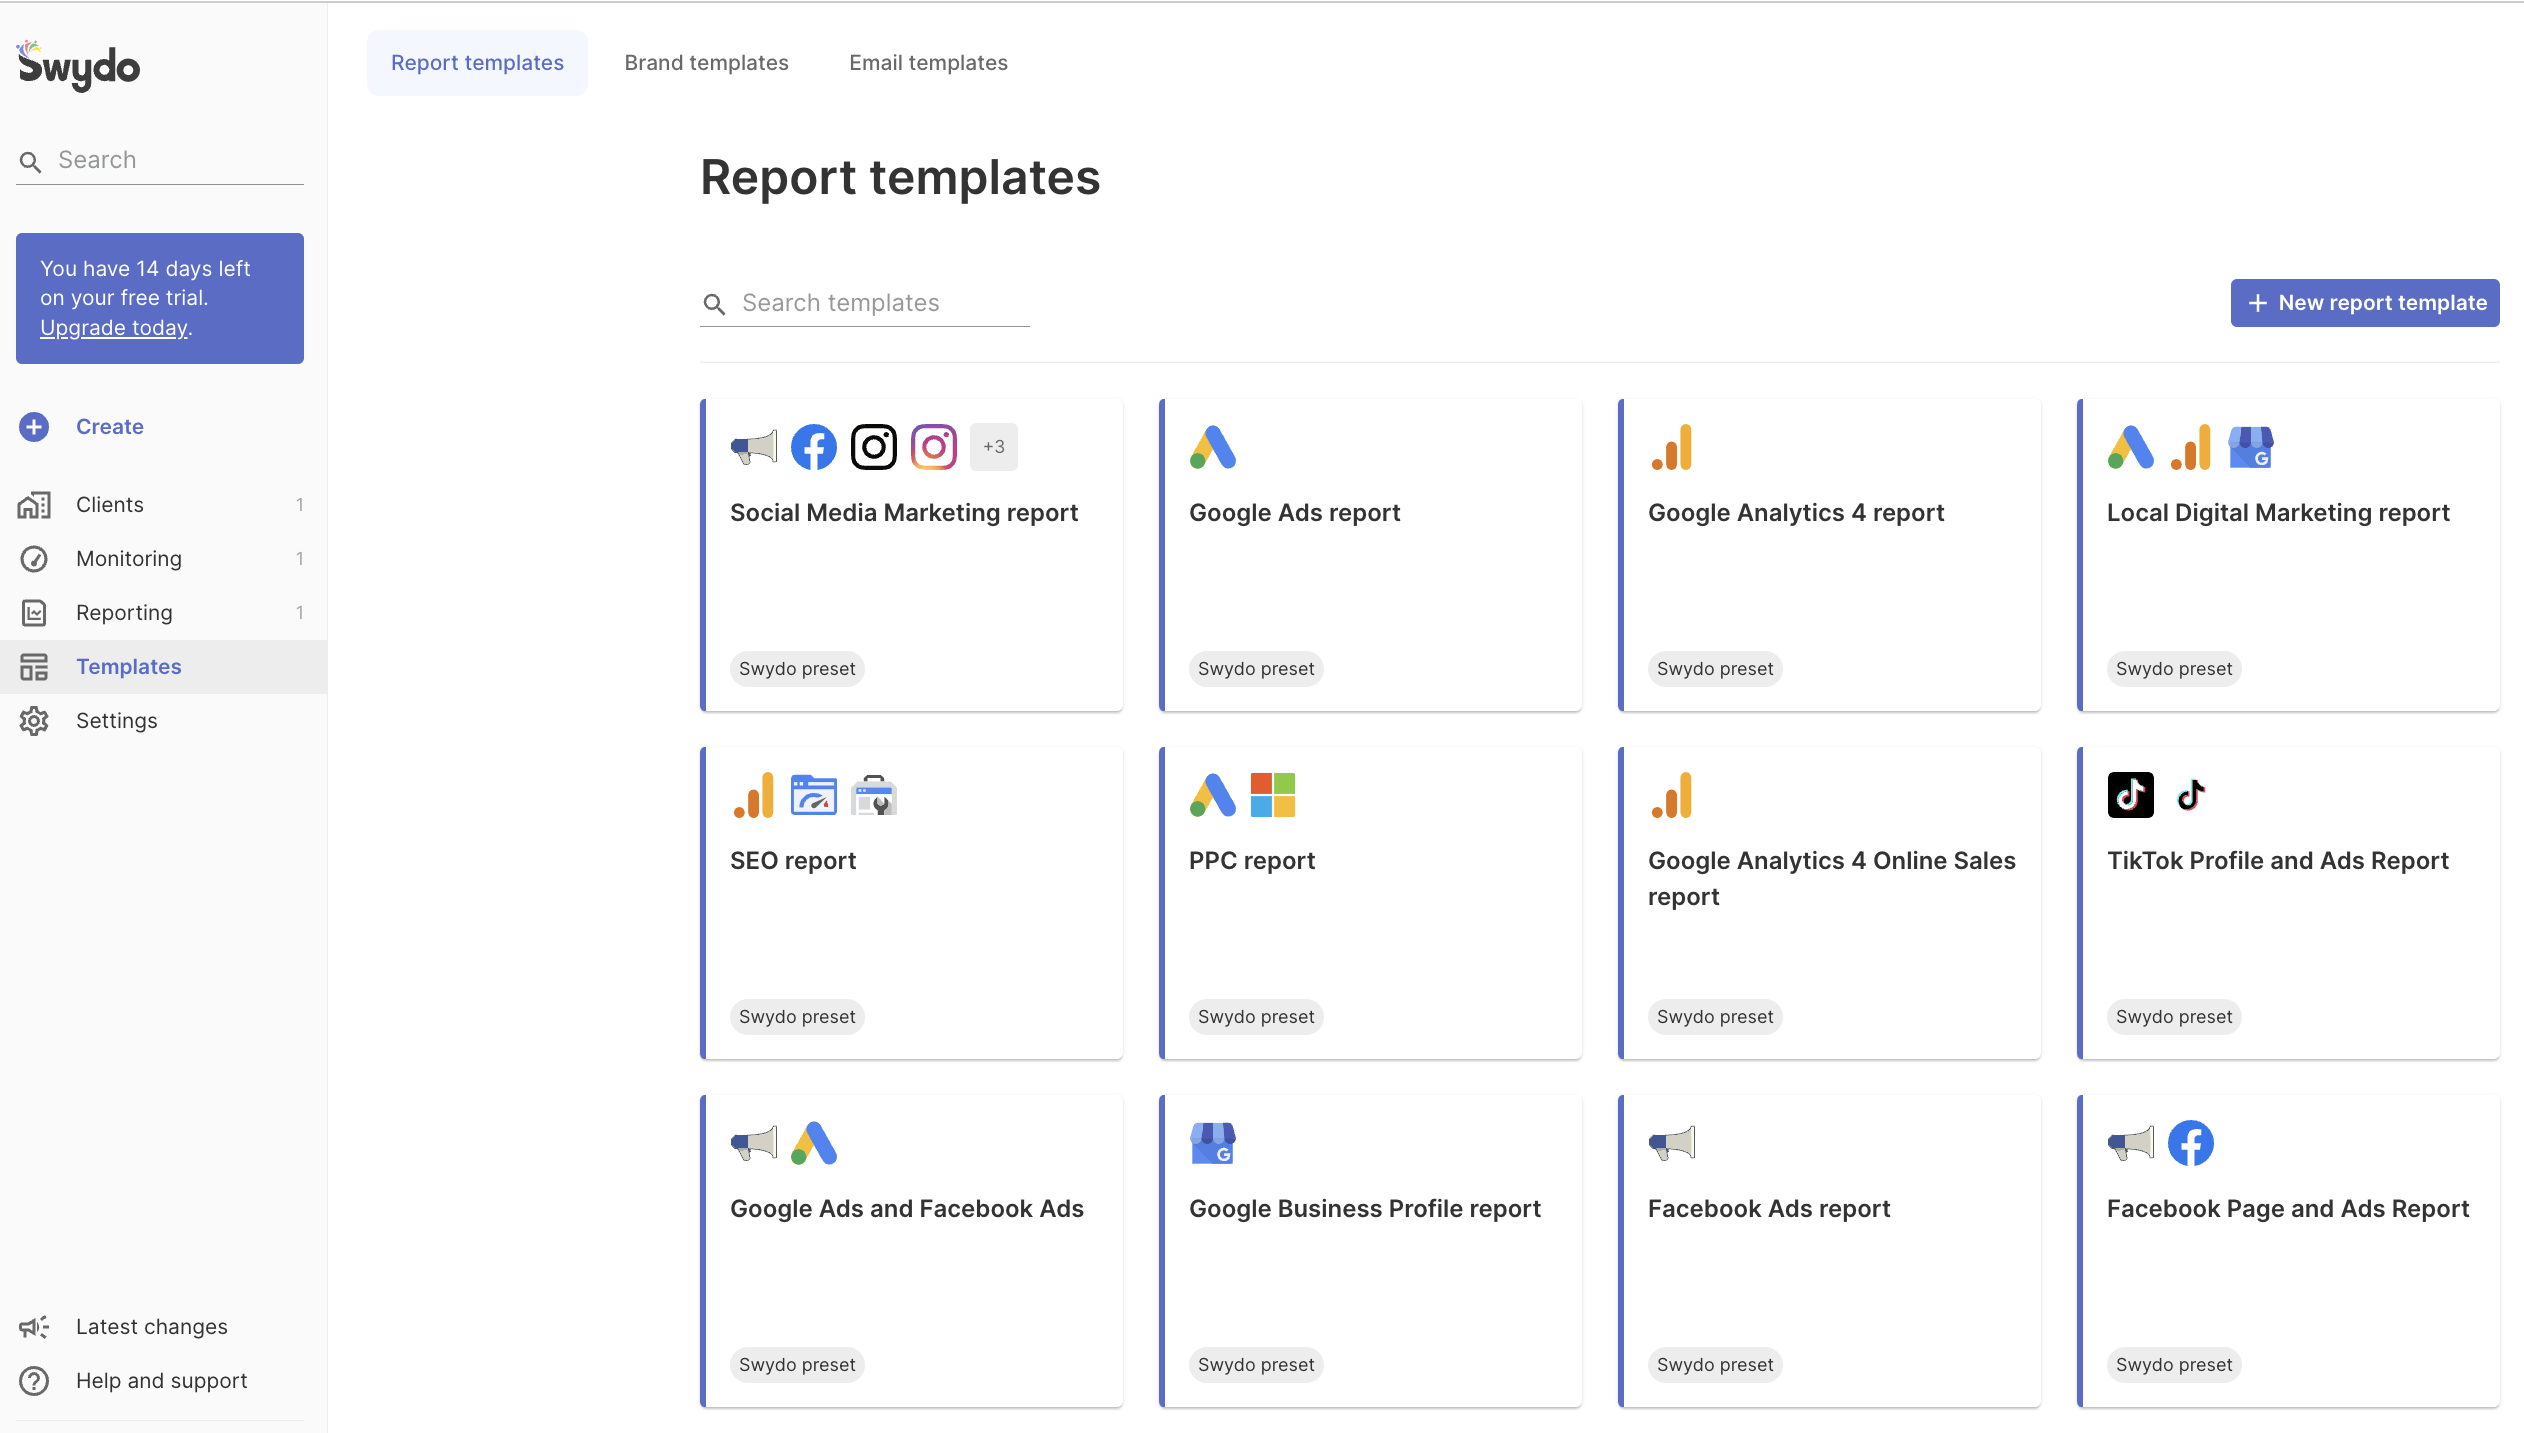
There’s a variety of report templates to choose from, but for now, let’s focus on the report builder.
Once you open the builder, you immediately know what you should do—populate the report with widgets.
On the other hand, you need to select the channel for every widget every time, which makes you go through several steps for every widget you want to use. That can get a bit annoying.
Adding widgets to a report is much faster on Whatagraph:
- You select a source.
- Drag and drop all the widgets you need for that source.
On Whatagraph, you can also change the source for each widget later without having to delete the widget and create it again under another source.
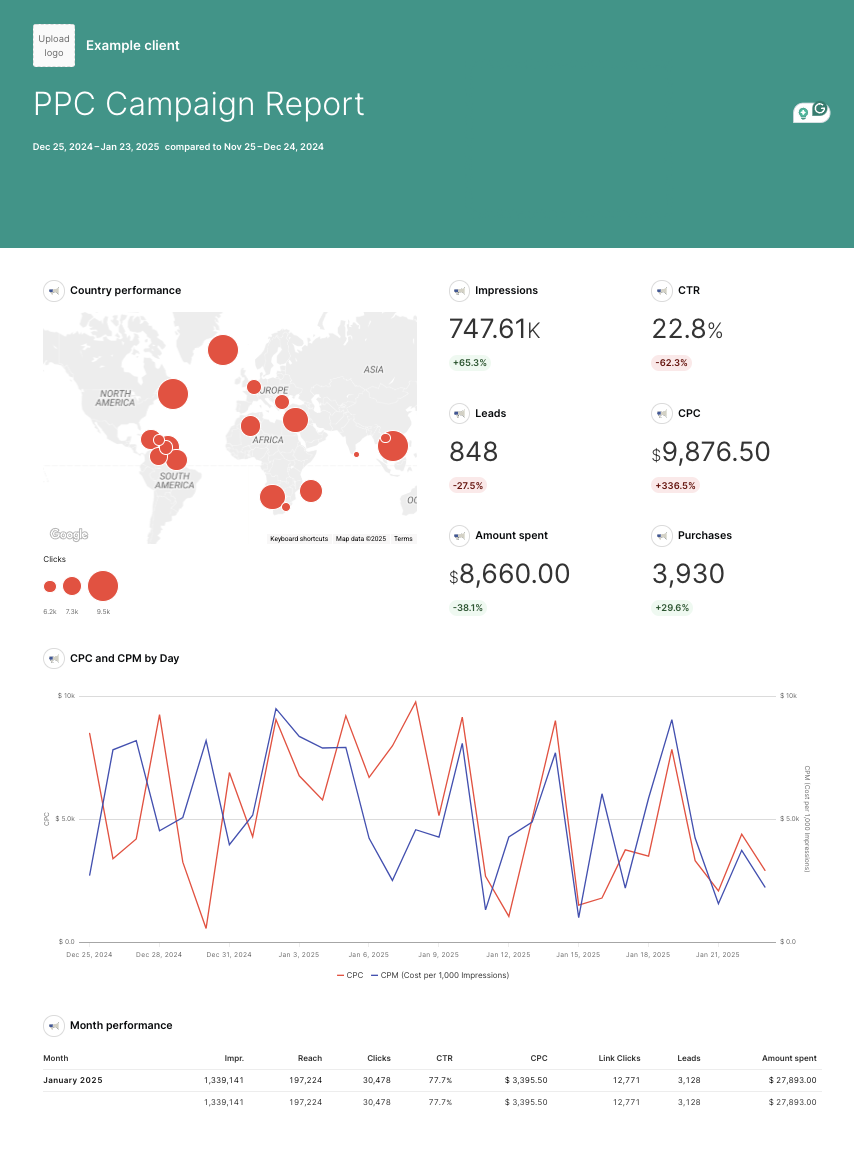
Another thing is that you can’t resize the widgets by just clicking and dragging on their borders, as in Whatagraph.
Instead, you need to manually set each widget’s size by selecting how many blocks each takes.
In other words, it can take some time before you create a report the way you want it.
If you have to create many reports, all these manual actions drain time you could use elsewhere.
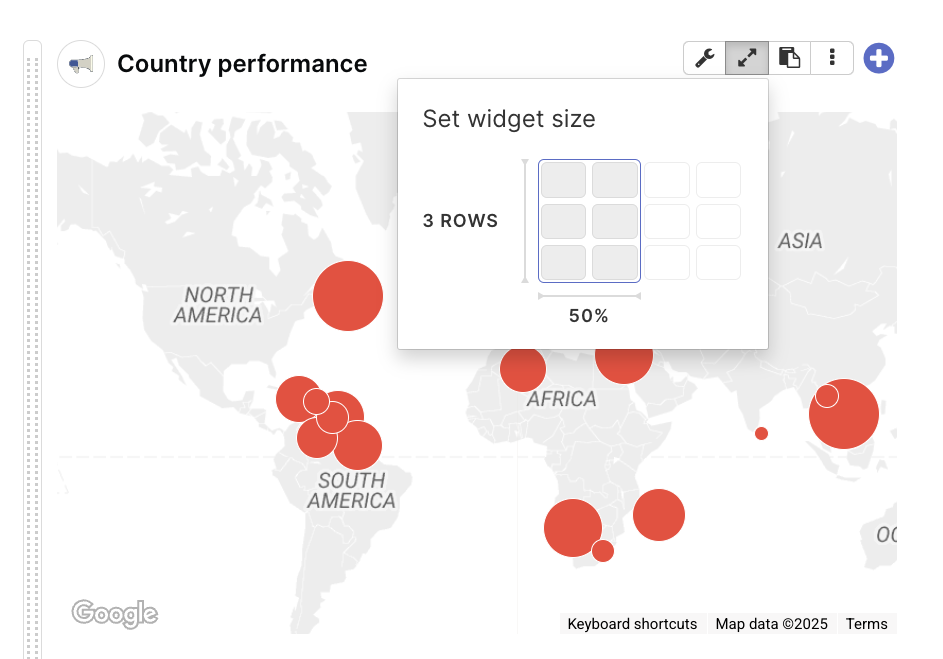
The good thing is that you can link reports together and edit them as a group, similar to Whatagraph’s linked template.
Swydo’s reports look different from all the tools we’ve reviewed so far.
There are no pages and borders, so the whole report looks like a Google document scrolling endlessly.
It’s a very clean and professional look, but not everyone might like it.
You can customize Swydo’s reports in several different ways.
The easiest option is to use the “Brand templates”.
You can save as many brand templates for different clients as you want and just dress up the report once it’s done.
The report cover is also very customizable, and you can pick what you want to show there:
- Author
- Client logo and name
- Date range
- Subtitle and title
- Team logo and name
The next feature I like about Swydo is its Monitoring tab.
You can see an overview of key metrics for each client and whether they’re trending up or down.
This is similar to Whatagraph’s Overview.
Such an overview dashboard is not available on Looker Studio, DashThis, or ReportGarden.
On the other hand, Swydo can be very limiting when it comes to data organization.
Apart from a basic “Custom metric” builder, you can’t blend data sources or create custom dimensions on Swydo.
This can lead to messy reports with inaccurate data and inconsistent dimensions.
Swydo is easy to set up and suitable for agencies needing quick, straightforward PPC reports.
But because it’s missing data manipulation options, it might not be a best choice for full-service agencies with advanced data needs.
Key features:
- 32+ native integrations
- Custom Google Sheets integration
- Custom metric builder
- KPI Monitoring dashboard
- Data filters and targets
- Alerts when KPIs trend up or down
Reviews from real users
“While it has a solid range of integrations, it would be even better if there were more options for connecting to different platforms.” (Source)
“You need to invest time in playing with the reports to have all the variables you need. Sometimes certain variables or views are unavailable, so you need to use what is available from their menu.” (Source)
“I use Swydo for my quarterly social media reports, and it's extremely easy to connect my social accounts and Google Analytics accounts to generate clear and concise reports for my higher-ups and product teams.” (Source)
Pros:
- Easy to use with minimal set-up
- A wide range of reporting templates for quick-start
- Built-in task and workflow management
- Responsive customer support
Cons:
- Limited data integrations
- Unstable data connections
- No advanced data transformations available
Pricing
Swydo’s pricing is based on the number of data sources. As of January 2025, the pricing looks like this:
- First 10 data sources: included in initial monthly base fee $49
- 11 - 100 data sources: $3.50 per data source
- 101 - 500 data sources: $2.50 per data source
- 501+ data sources: $1.50 per data source
For example, if you need 100 data sources, expect to pay around $364/month. It’s unclear, however, whether this pricing includes Customer Support and a Customer Success Manager, or if these are extra.

WRITTEN BY
Nikola GemesNikola is a content marketer at Whatagraph with extensive writing experience in SaaS and tech niches. With a background in content management apps and composable architectures, it's his job to educate readers about the latest developments in the world of marketing data, data warehousing, headless architectures, and federated content platforms.