Instagram Analytics: The Top 7 Reporting Tools for your Instagram Campaigns
There are many effective ways to track the progress of your clients’ Instagram business accounts. You can use Instagram Insights - a tool provided within the platform- the easiest solution. Alternatively, there are various Instagram analytics reporting tools.

Feb 03 2020●7 min read


If you’re looking to analyze your Instagram account performance, here are some of the best analytics reporting tools available on the market today. But first…
Is Instagram Relevant For Businesses?
Most definitely so. According to Instagram:
- 90% of people follow at least one business
- 1 in 2 people have used Instagram to discover new brands
- 44% of people use Instagram to shop weekly
One of the primary reasons marketing agencies use Instagram to promote their client’s business is that it has 1 billion monthly active users. This means that there is a very high chance that your customers are on Instagram already, no matter what you sell and to whom.
You can reach a large audience with your Instagram posts and use them to promote your products, services, events, and more. If you want to increase your sales via Instagram, optimize your posts and use templates for Instagram posts to help you create posts that will attract your ideal customers and increase sales.
In terms of the business, the stats provided by Instagram clearly shows that any business could thrive on this platform. Not only that, but they can make money directly from Instagram and easily connect with their audiences.
So yes, Instagram is, in fact, very relevant for businesses and marketing agencies should continue using the platform to advertise their client’s brands.
How to See Instagram Analytics
To achieve the best results when marketing on Instagram, your gut feeling won’t help. Instead, benchmarks, data and specific KPIs should be your main guidance.
When it comes to organic Instagram KPIs, here are the most common ones:
- Comments;
- Likes;
- Shares;
- Saved posts;
- Reach;
- Interactions
- Top locations
- Followers.
Alternatively, there are some Instagram KPIs that are a bit more complex, such as:
- Engagement rate;
- Follower distribution;
- Reach vs Impressions;
- Website clicks;
- Profile clicks;
- Follower growth;
- Top performing posts.
These KPIs are needed when reaching goals. Some good examples of Instagram goals could be:
- Improving customer satisfaction;
- Increasing sales;
- Increasing brand awareness;
- Increasing engagement;
- Increasing traffic to client’s website;
- Establishing customer and client business relationships.
So, how does Instagram analytics play its role? With Instagram analytics:
- You identify relevant KPIs that would be appropriate for the goal;
- You get historical data to find trends and patterns;
- You get real-time data to find out how this specific KPI is performing now;
- You dive deep, trying to understand what influences that specific KPI.
For that, you can’t simply rely on spreadsheets. You need modern, powerful reporting tools that would not only answer all your questions but also save you time and send reports to clients (preferably automatically).
Here are 7 of the best Instagram analytics reporting apps you should consider.
1. Instagram Insights
Instagram Insights is a tool available for Instagram business users who want to manage Instagram accounts within the platform.
You can now find Insights on Instagram on the main profile feed. The Insights button is next to the ‘Ad Tools’ and ‘Add Shop’.
Best Features
- It’s conveniently displayed within the app, and you can easily get key performance metric status.
- It provides a quick Insights overview of the Instagram profile for the last 7, 14 or 30 days, the previous month or even 90 days. This means that Instagram stores your data for around three months.
- Insights filters three Instagram metrics you can analyse more in-depth: reach, engaged and total followers. You can see each metric’s trends and overall performance and get general information.
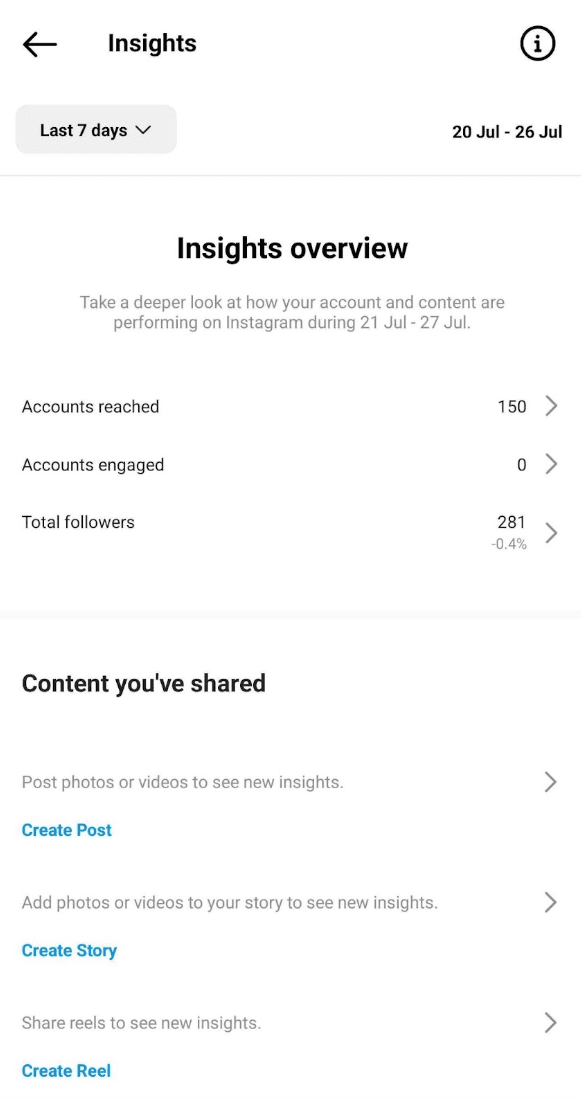
For example, if you press Accounts Reached, you’d get audience demographics data on top towns, countries, age ranges, gender, etc. This information is beneficial when trying to understand the demographics of the current followers, where they are located (info needed for ads), and the generation of the audience.
- You can track different types of content separately. This includes photos, stories, reels, videos, live videos, and boosted content.
- You can also track Instagram follower growth.
To sum up, the best feature of Instagram Insights is that it provides quick data that allows marketers to understand their audiences better.
Downsides
- Demographics are limited to only 5 countries;
- The feature is only available on the phone;
- No possibility of establishing a broader view of your metrics and performance;
- Marketing agencies can’t analyze other profiles. If you have multiple clients, you need to sign into each account separately;
- Analysis has to be performed manually.
- No possibility of comparing month-to-month data;
- The tool doesn’t create reports. Instead, it provides table and pie chart widgets scattered around the Insights feature;
- Marketing agencies wouldn't be able to send data reports to clients;
- No automation feature.
Pricing
It’s free. Once you set up a business profile for your client, you get Insights Overview by default.
Who Is It Best For?
Instagram analytics is best for freelancers and business owners.
If a business owner works with a marketing agency, they can access quick performance data and see how their business account is progressing.
2. Whatagraph
Whatagraph is a reporting tool marketing agencies use to create Instagram dashboards and reports.
Best Features
- Provides all data in-depth without limitations. If the audience is concluded from 30+ countries, Whatagraph will report on that. This goes for all metrics.
- Reports are customizable. This means you can drag & drop relevant widgets, see the data you want, and remove any irrelevant distractions.
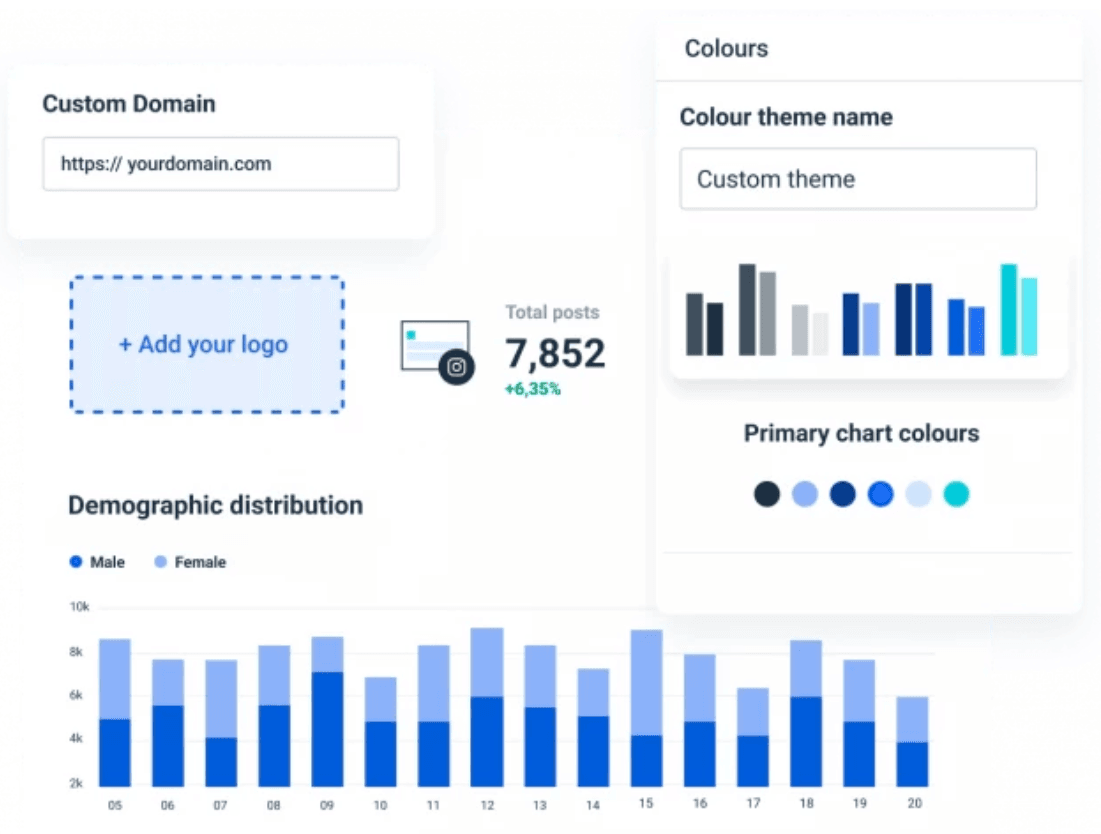
- You can white-label reports. This means that marketing agencies can alter logos, colours, fonts or any other detail to match their branding and style. Essentially, reports look like they’re coming from your agency and not Whatagraph.
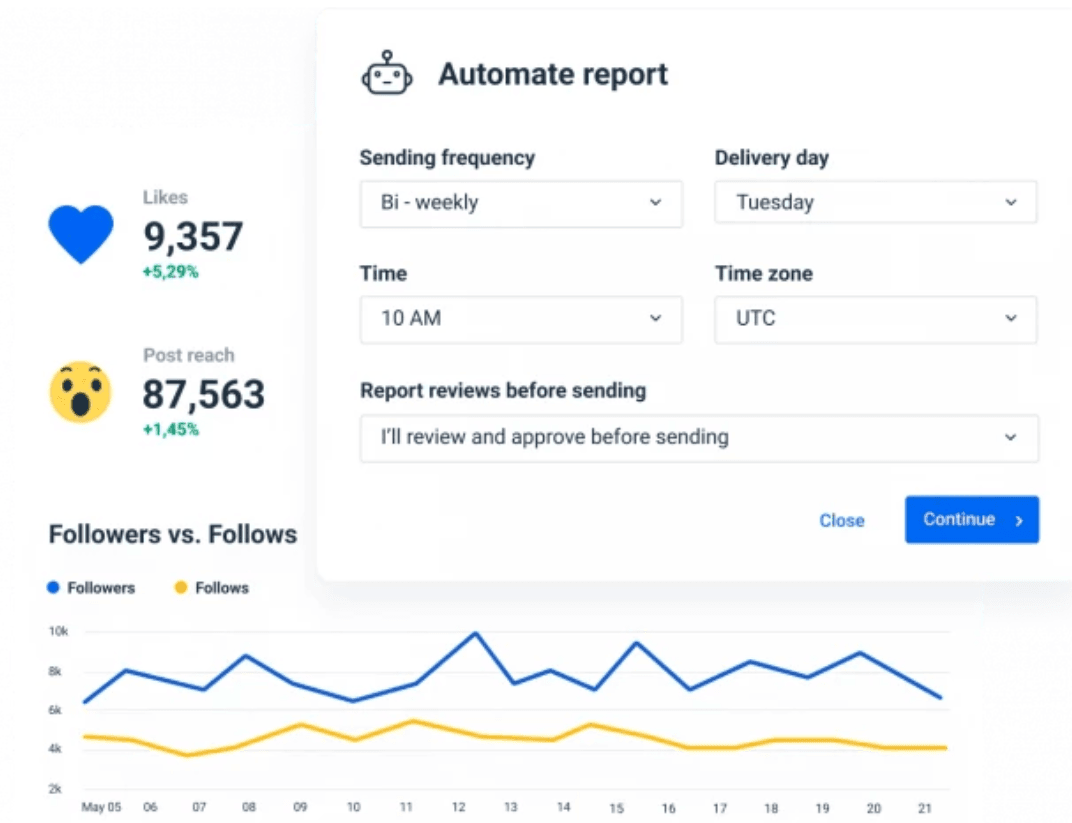
- You can send automated Instagram reports to clients at required frequencies. Once a week, once a month or whatever interval you set them to.
- You can create a cross-channel report and compare Instagram's performance to other channels, such as Facebook, Twitter, YouTube, Pinterest, etc. Whatagraph integrates with 40+ platforms, so you’ll find what’s relevant to you and your clients.
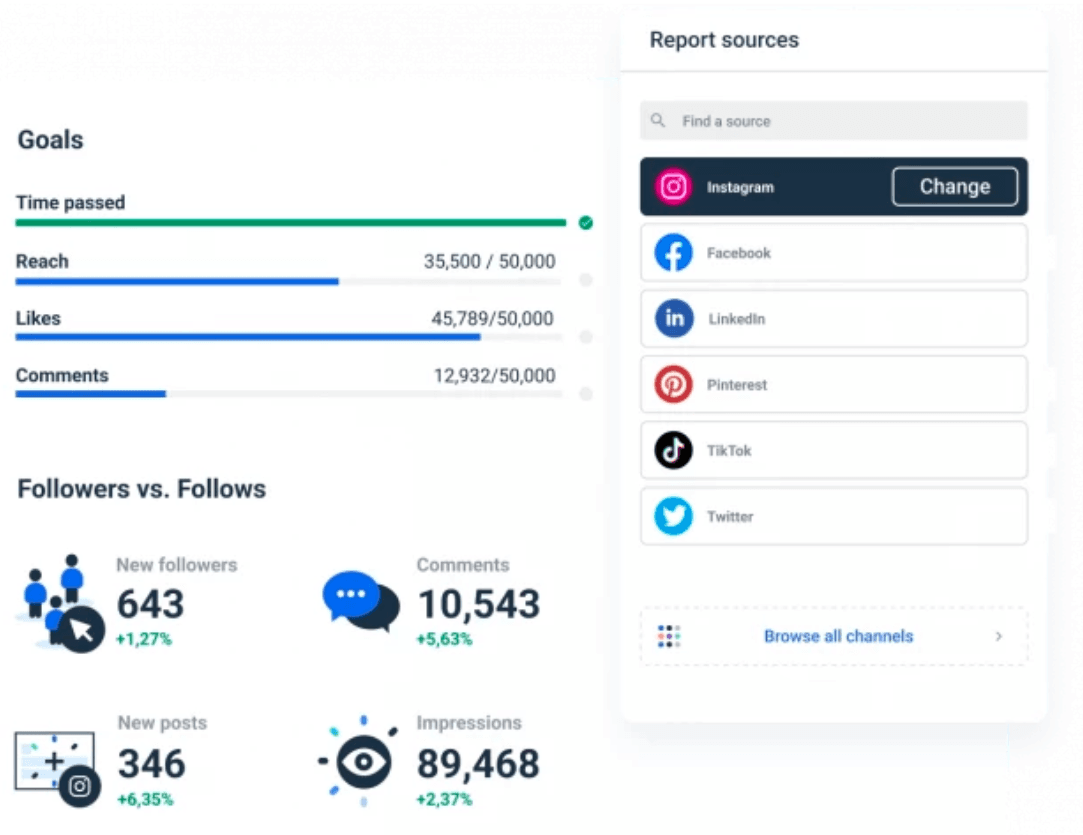
- You can access real-time data by creating a dashboard and historical data by creating a report.
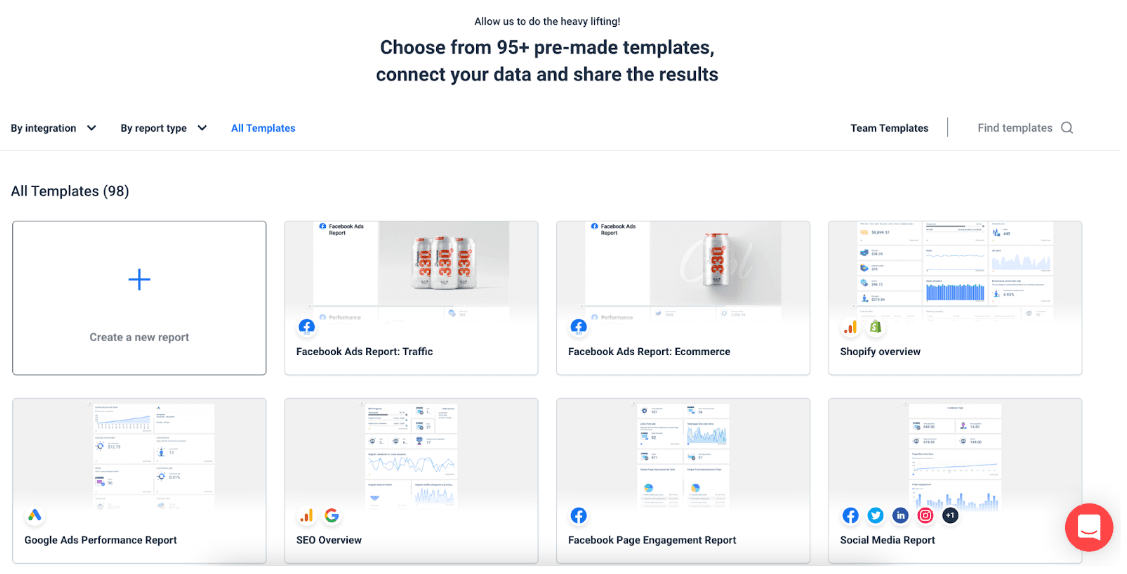
- You can access the Instagram analytics report template and save time creating a report from scratch.
- You can access a pre-made gallery with more than 90 ready-to-use templates.
- 24/5 customer support service.
- You get a dedicated account manager to help you with any requests.
- You can download it as a desktop app and use it as a native app.
Downsides
- Doesn’t recognize UTM tracking;
- Not an advanced BI tool; look elsewhere if you are looking for data visualization and exploration on a higher enterprise level.
- Integrations are fit for wider use cases and not fit for niche agencies
- Forecasting, data insights, and similar features are in the roadmap with something like Overview.
- There are no drill-down (filtering) options when sharing live dashboards.
Pricing
Whatagraph offers four pricing plans:
- Forever-free – lets you get started at no cost, with 5 source credits, Whatagraph IQ basics, templates, and live chat support.
- Start ($229/mo billed annually) – includes 20 source credits and essential integrations
- Boost ($463/mo billed annually) – jumps up to 50 source credits, adds advanced integrations, custom metrics & dimensions, white-labeling, and performance overview with alerts
- Max (custom pricing) – for enterprise/complex teams, with custom source credits, premium integrations, data groups and blends, Whatagraph IQ+, SSO, and dedicated Customer Success Manager
Who Is It Best For?
Whatagraph is using freelancers, marketers, business owners and especially marketing agencies. Anyone promoting their business and needs data to create optimized strategies would benefit from our Instagram reporting tool.
3. Iconosquare
Iconosquare is a social media analytics tool that allows managing and scheduling posts.
Best Features
- Offers connections to five major social media platforms: Facebook, Instagram, Twitter, TikTok and LinkedIn.
- You can download Instagram data in XSL form.
- Tracks individual posts.
- Can see the benchmark for specific markets.
- Reports can be automated.
- The tool can track competitor performance data.
Downsides
- It can be a bit pricey.
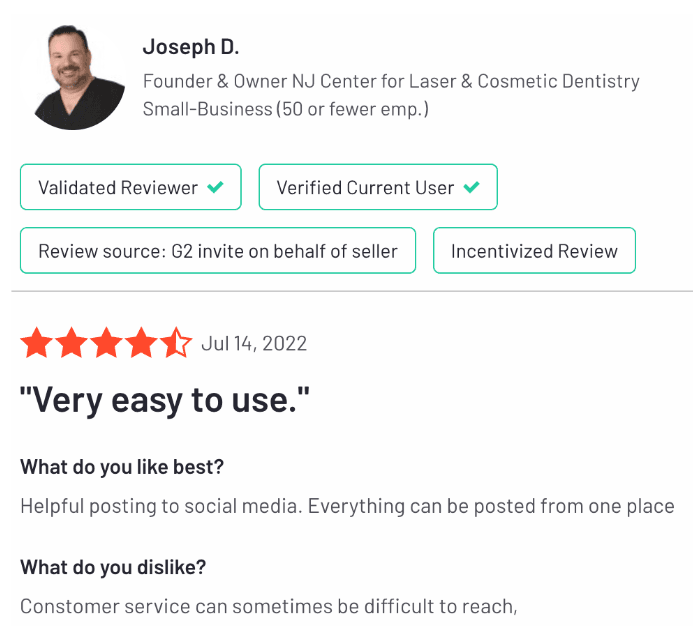
- According to G2 reviews, ‘customer service can be difficult to reach’.
- No white-label feature.
- Limited at integrations.
- No cross-channel reporting.
Pricing
Iconosquare has three pricing options, offering a free trial for 14 days.
Pro option - $49.00 per month
Advanced option - $79.00 per month
Enterprise option - Custom
Who Is It Best For?
Considering integrations, this tool is best for freelancers and social media managers. However, their main page claims that many agencies are using the tool too.
4. Keyhole
Keyhole - a tool to create automated social media reports.
According to Keyhole's website, it allows you to learn about your and your competitor’s growth strategies. You can set up feeds to track specific competitor accounts and share your dashboard with your team or clients so that everyone is up to date.
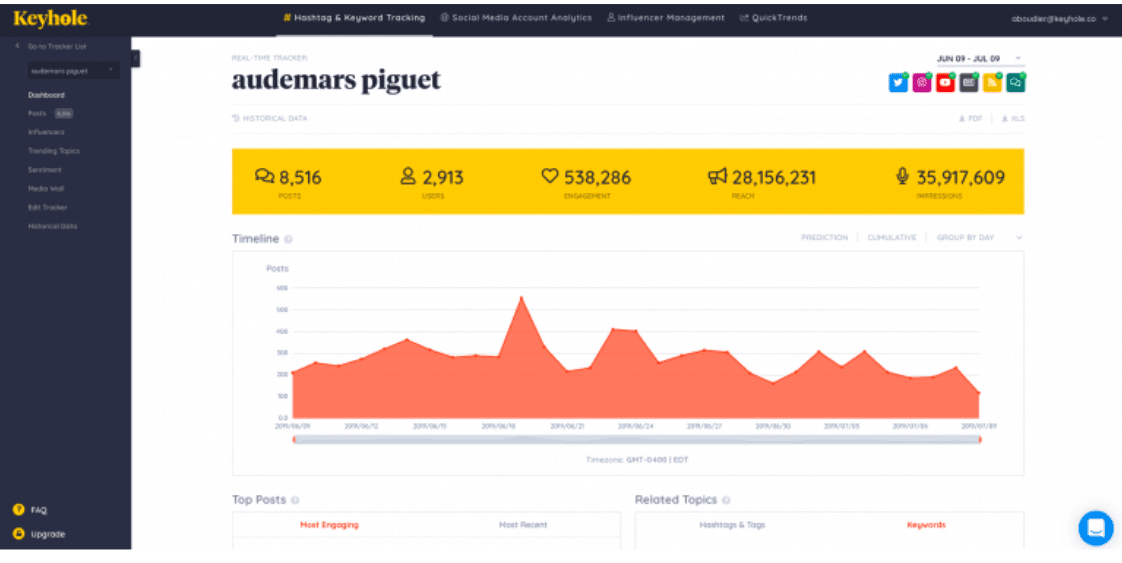
Image: Keyhole
Best Features
- Reports can be exported into .pdf, .csv, .xsl files.
- Gathers competitor data.
- Gives in-depth audience data.
- Provides Instagram hashtag analytics.
- Tracks and monitors follower count.
- Reports and dashboards can be automated.
- Pricing plans can be customized.
Downsides
- Doesn’t provide white labeling.
- No cross-channel reporting.
- Integrates only with 6 platforms: Instagram, TikTok, YouTube, LinkedIn, Twitter, and Facebook.
- If you don't put your trackers in place immediately, it can be difficult to set them up later.
- It doesn’t offer a free trial.
Pricing
Keyhole provides 4 pricing packages:
- Basic - $49.00 per month.
- Plus - $99.00 per month.
- Professional - $199.00 per month.
- Enterprise - Custom
Who Is It Best For?
The tool is focused on helping B2C brands, agencies, and social media managers.
5. Hootsuite
Hootsuite is a tool for creating, scheduling, managing, and analyzing campaigns.
ootsuite can assist users in marketing campaigns, seeking and expanding their audience, and sending targeted messages via Instagram and various other channels. The social media dashboard allows users to schedule posts on popular social channels via mobile, desktop, and web-based platforms.
Image: Hootsuite.
Best Features
- Allows you to manage multiple social media networks in one place.
- Offers a free 30-day trial.
- Customizable reports.
- Tracks social ads.
- Tracks Instagram stories.
- Provides competitor analysis.
- Reports can be exported into .pdf, .csv, .xsl files.
- Tracks Instagram content performance.
- Provides notifications when changes occur in metrics.
Downsides
- No data in Facebook insights.
- It can be expensive for teams.
- Expensive custom URL shorteners.
- Doesn’t provide audience insights such as age, region, etc.
- No automation feature.
- The free version is limited and has only a few platform integrations.
Pricing
- Professional - $48.00 per month.
- Team - $129.00 per month.
- Business - $739.00 per month.
- Enterprise - Custom.
Who Is It Best For?
Their website claims that the tool is best for freelancers, social media experts and businesses.
6. Minter.io
Minter.io is a social analytics tool that allows you to monitor numerous different Instagram accounts from a single dashboard.
In a nutshell, it is ideal for businesses with multiple Instagram accounts or relies heavily on Instagram for marketing. Furthermore, it is possible to track various competitors for various Instagram accounts.
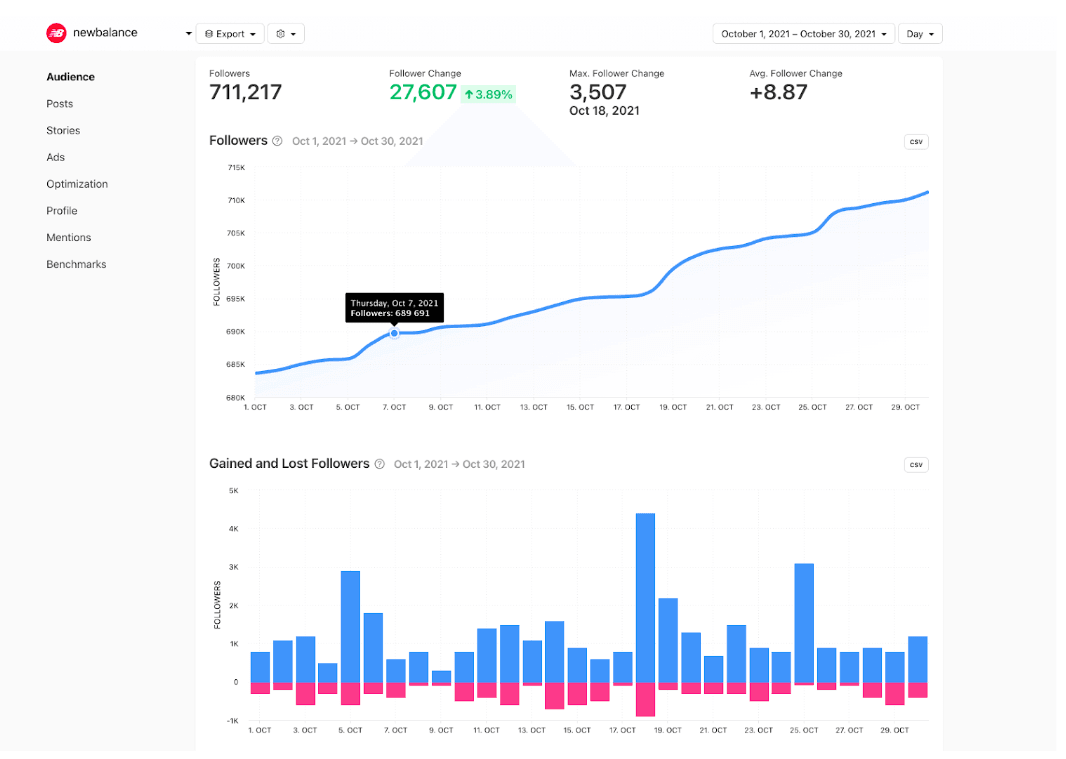
Image: Minter.io
Best Features
- Provides hourly Instagram data updates.
- Provides Instagram benchmarks.
- Reports can be exported into .csv, .pdf, .xls, .pptx.
- Offers automation feature.
- Reports on ads.
- Tracks Instagram stories.
- Customizable reports.
- Offers competitor analytics.
Downsides
- Integrates only with 5 platforms: Instagram, Twitter, TikTok, Facebook, and LinkedIn.
- No white-labeling.
- No cross-channel reporting.
- No custom data.
- Doesn’t offer report templates.
Pricing
There are 2 different pricing plans created for different needs:
If you want to pay per profile:
- Silver - €9.00 per month.
- Gold - €19.00 per month.
- Platinum - €39.00 per month.
Pricing plans for agencies:
- Agency 10 - €330.00 per month.
- Agency 25 - €499.00 per month.
- Agency 50 - €8.999.00 per month.
Who Is It Best For?
The tool seems best for social media managers, agencies, and businesses.
7. Phlanx
Phlanx is a marketing platform that allows you to contact influencers, collaborate with brands, create contracts, and track engagement.
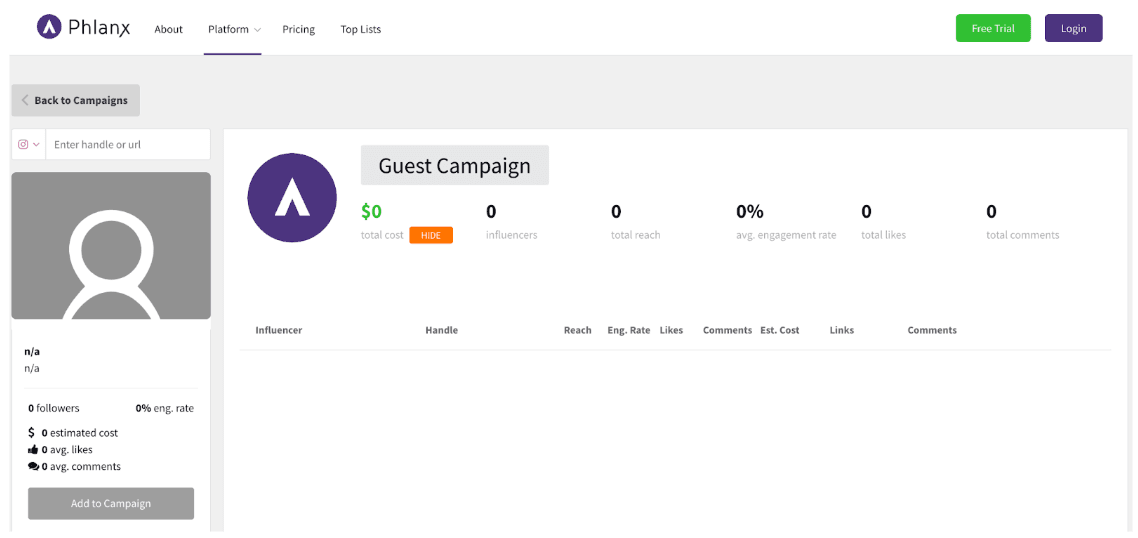
Image: Phlanx.
Best Features
- Measures Instagram audience engagement.
- Provides social media auditors.
- Tracks Instagram stories.
- Manages all social media campaigns.
- Provides competitor tracker option.
- Creates reports.
Downsides
- No automation feature.
- Doesn’t create dashboards.
- No white-label option.
- No customization.
- No cross-channel reporting.
- Integrates only with five main social media platforms.
Pricing
Phlanx provides three pricing packages with a 30-day free trial.
- Basic ($25 annually)
- Premium ($35 annually)
- Business ($55 annually)
Who Is It Best For?
Due to the high focus on the influencer directory, it’s best for influencers and social media managers.
Conclusion
There are many powerful Instagram and social media in general reporting tools. Depending on the number of clients and business accounts marketer or marketing agency manages, they should pick the one that would meet the most needs.
We want to offer you a tool that would also report on Instagram data and other social media platforms. Because comparing different channels to each other really gives an overview of the marketing strategy’s effectiveness.
Sign up for Whatagraph to gain access to a positively overwhelming template gallery, report automation, and 40 data integrations. Create beautiful reports that your clients will enjoy, and save time by having data pulled from sources automatically. To get started, sign up for a free trial today!
Published on Feb 03 2020
WRITTEN BY
Dominyka VaičiūnaitėDominyka is a copywriter at Whatagraph with a background in product marketing and customer success. Her degree in Mass Communications/Media Studies helps her to use simple words to explain complex ideas. In addition to adding value to our landing pages, you can find her name behind numerous product releases, in-app notifications, and guides in our help center.