Top 5 Instagram Metrics to Measure Performance
If you're a marketer or an influencer, you know that checking the performance of any marketing effort made on social media is a rule of thumb. Without exception, the same goes for any action on Instagram: if you want to get results, you need to keep an eye on specific metrics constantly.

Feb 03 2020●4 min read


But what exact metrics should you be tracking? And how do you get access to these numbers? In today's article, you'll learn all about what metrics you should be monitoring to master the Instagram content strategy for your business.
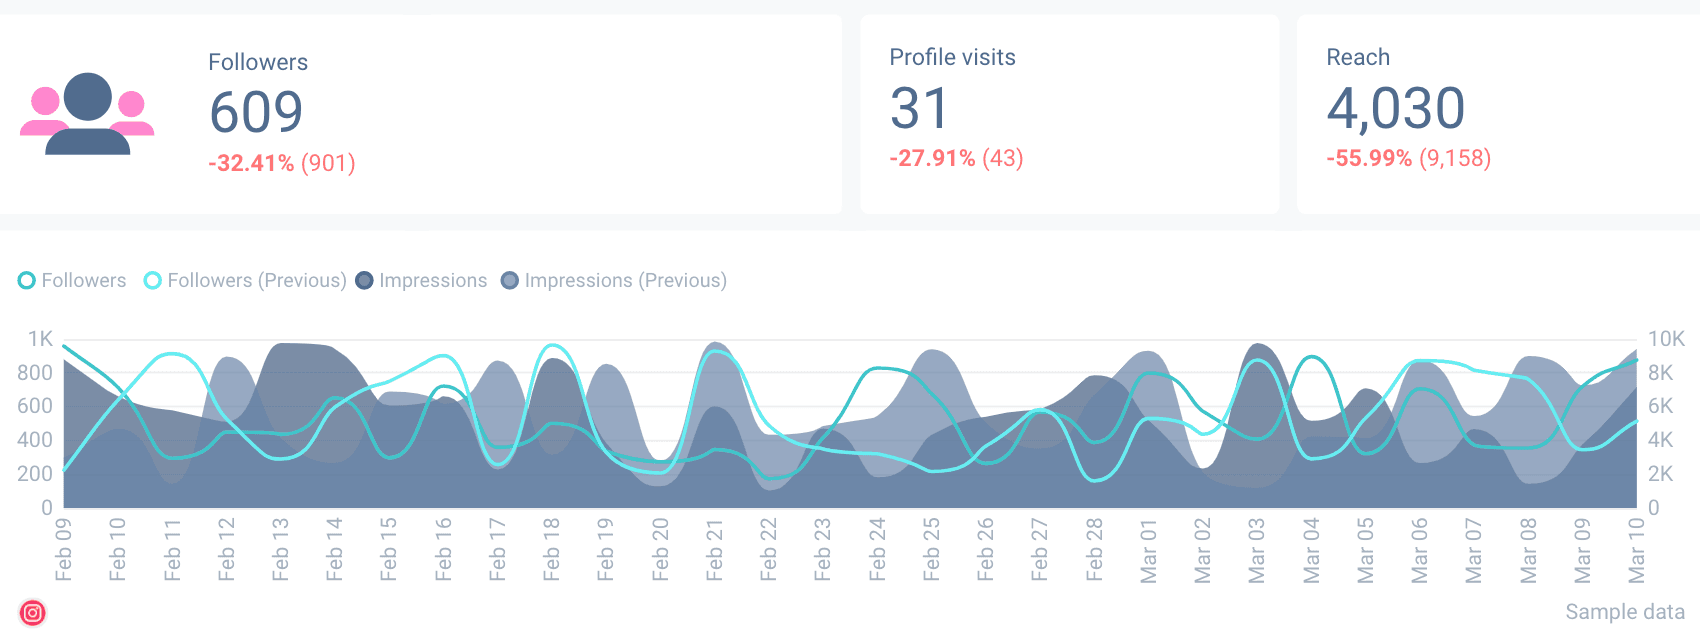
Follower Growth Rate
Any marketer should aim for a high number of followers: it's one of the best ways to get your business extended and build brand awareness. You can gain followers through various ways like relying on an Instagram followers app. However, a large following isn't enough: you should focus on the rate of change.
Once you reach the initial goal of follower number, you should keep track of how many new followers you're gaining each month. This way, you can measure the increase (or decrease) and determine which actions bring results, then make changes accordingly.
For instance, if your audience seems to like seeing your Instagram stories, you should try uploading more. If you very much enjoy stories a brand uploads, you're likely to share the content with your friends – here's a potential for your social platform to grow continually.
In other words, you should keep the focus on the actions that work on social media and exploit the possibilities rather than always looking for something new.
Quality over quantity: besides keeping an eye on your followers' growth metrics, you should make sure you're reaching your target audience.
If your social profile is gaining followers that are in no way associated with no brand, you won't be getting the expected results. Hence, your growth metric should be coming from the correct audience.
Engagement Rate
By monitoring the engagement, you'll be able to determine if your social media strategies are working and your content is relevant. A lack of follower engagement on your posts or stories may indicate you need to change your tone of voice or improve your content quality.
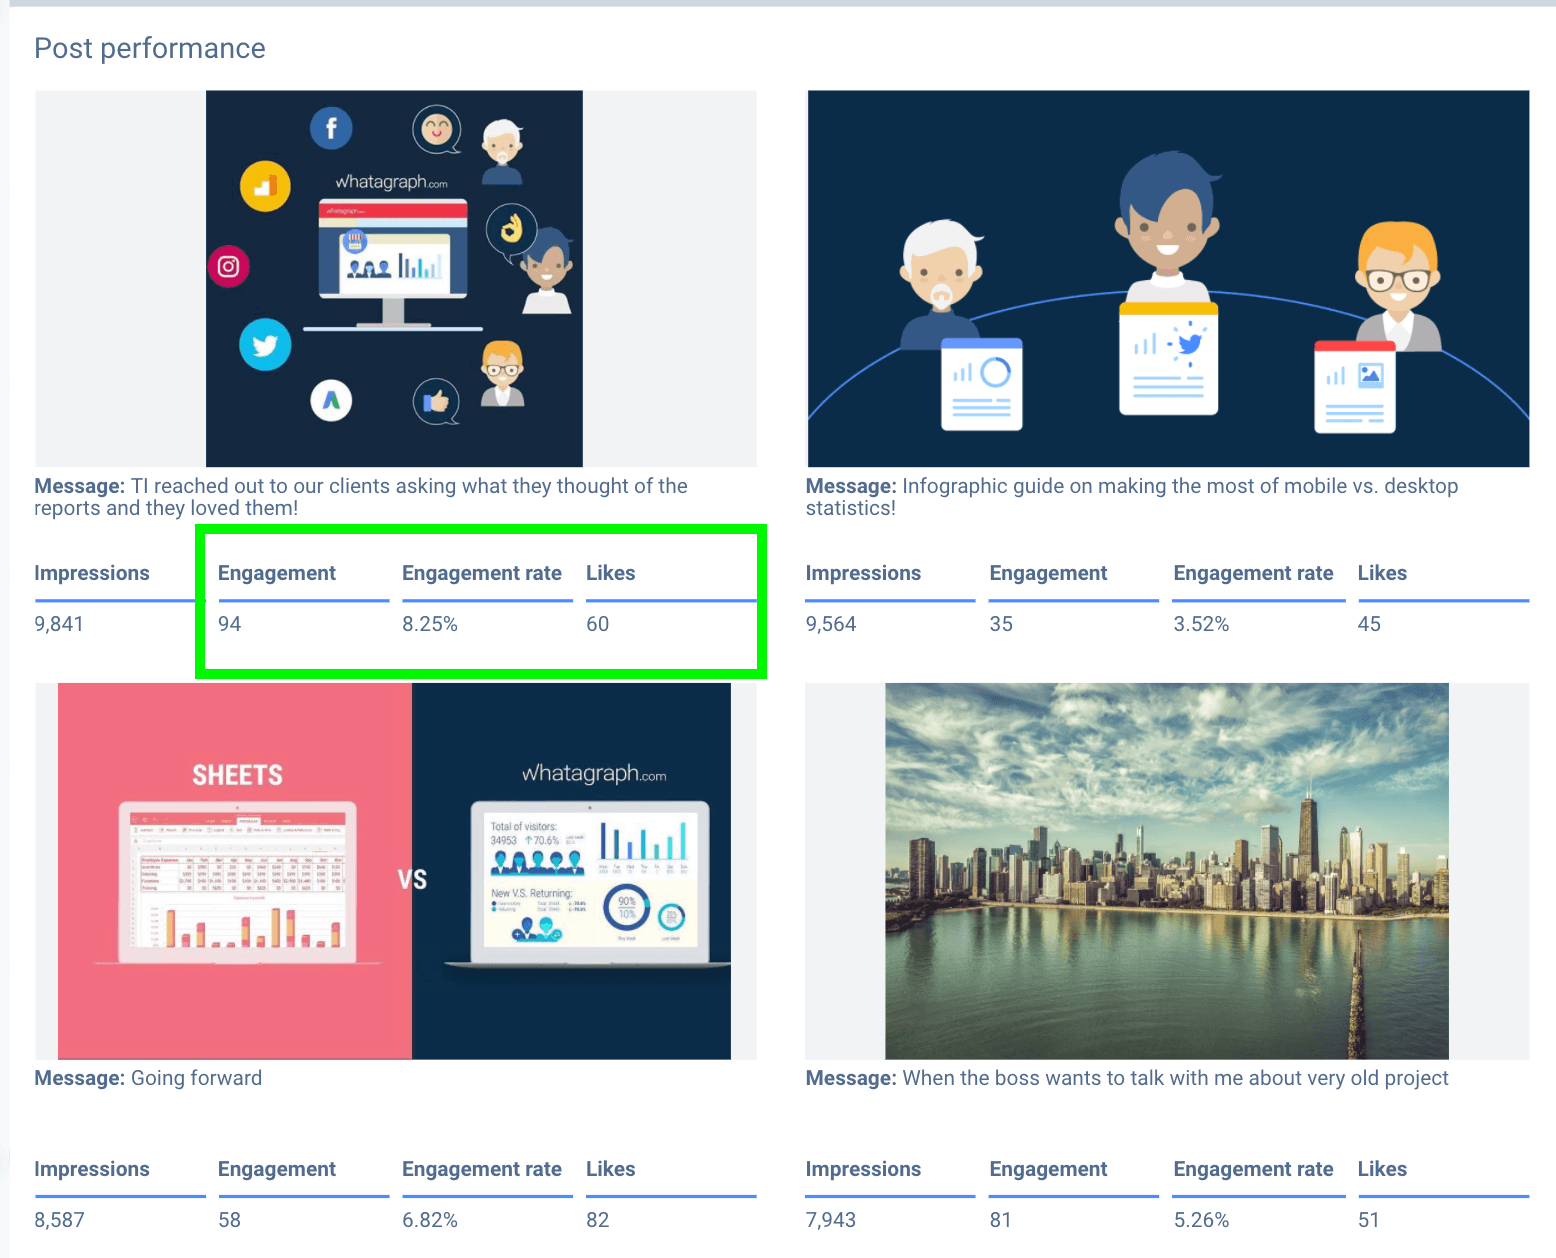
If you want to calculate your engagement rate, divide your content's total number of comments and likes by the total number of your followers, and multiply it by 100%. Reporting tools like Whatagraph do all the calculations on your behalf, so there is no need to rely on spreadsheets and growing complexity as your client lists grow too.
Typically, the engagement drops as you get more followers. If your followers' number is growing, but the engagement is decreasing – you're receiving fewer likes and comments – it may be indicating your content is no longer as useful.
Not only does the engagement rate help you determine how well you're interacting with your followers, but it's also directly related to the quality of your posts and stories. If specific posts or stories are receiving more engagement significantly, you should take it into account and make changes accordingly.
Reach
Reach metric is the total number of unique users that saw your posts or stories on Instagram. To access these metrics, you'll need a business account.
There is a common misconception between reach and impressions. If you want to see the difference, imagine that a single person sees the same post on a social platform three times. In this scenario, the number of engagements is three, while the reach number equals one.
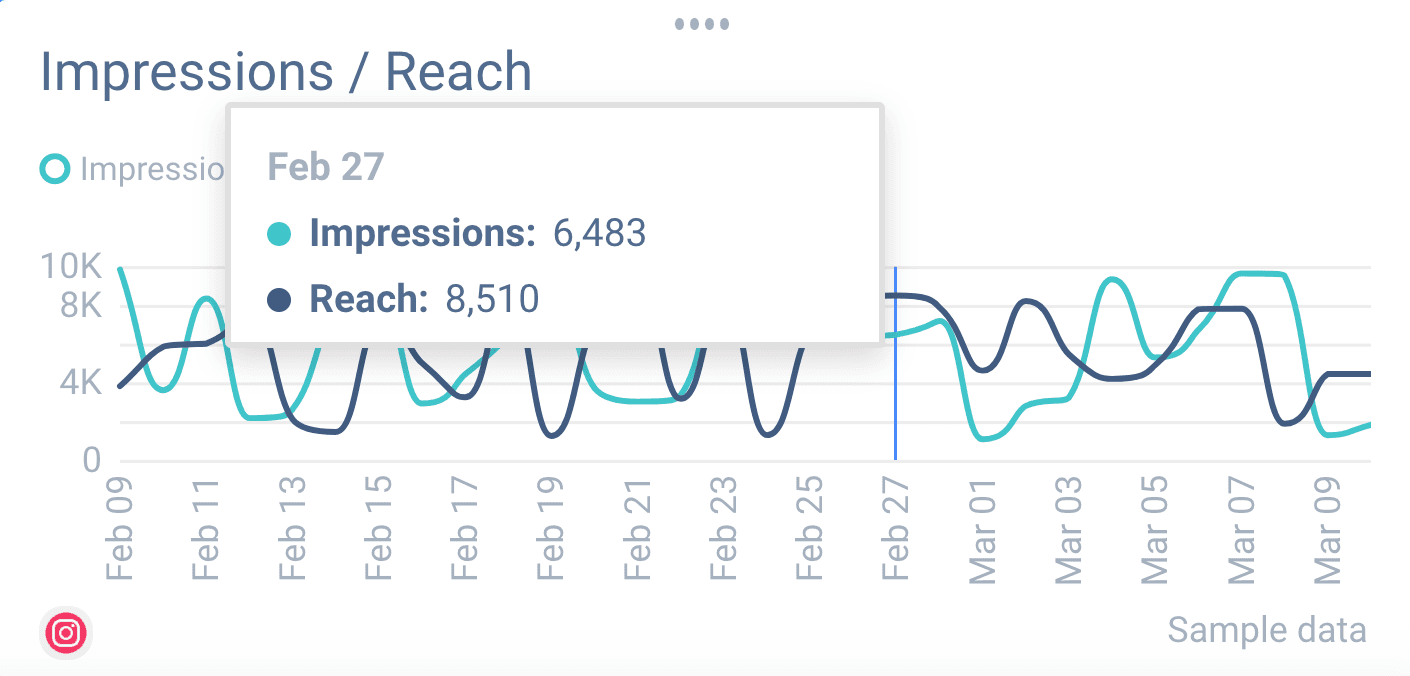
Reach is an important indicator that shows if you're reaching new audiences or if your account is growing. If you're planning to launch ads on Instagram stories or posts, make sure to measure the reach. Check how your stories and posts are performing, and you'll be able to see the potential impact of an ad.
How do you find your reach metrics?
Now that you know why the reach stats on Instagram matter, how do you find those?
You can find these stats under the Instagram Insights section. Head over to your profile page, then tap the bar icon. After that, open the content tab and select all. Then you'll be able to narrow down to any posts or stories.
Hashtag Performance
Hashtags should play an essential role in your Instagram marketing strategy – many people use them to search for posts on this social media platform. Adding hashtags is a proper way to align your brand with your followers. In other words, it allows you to keep your momentum.
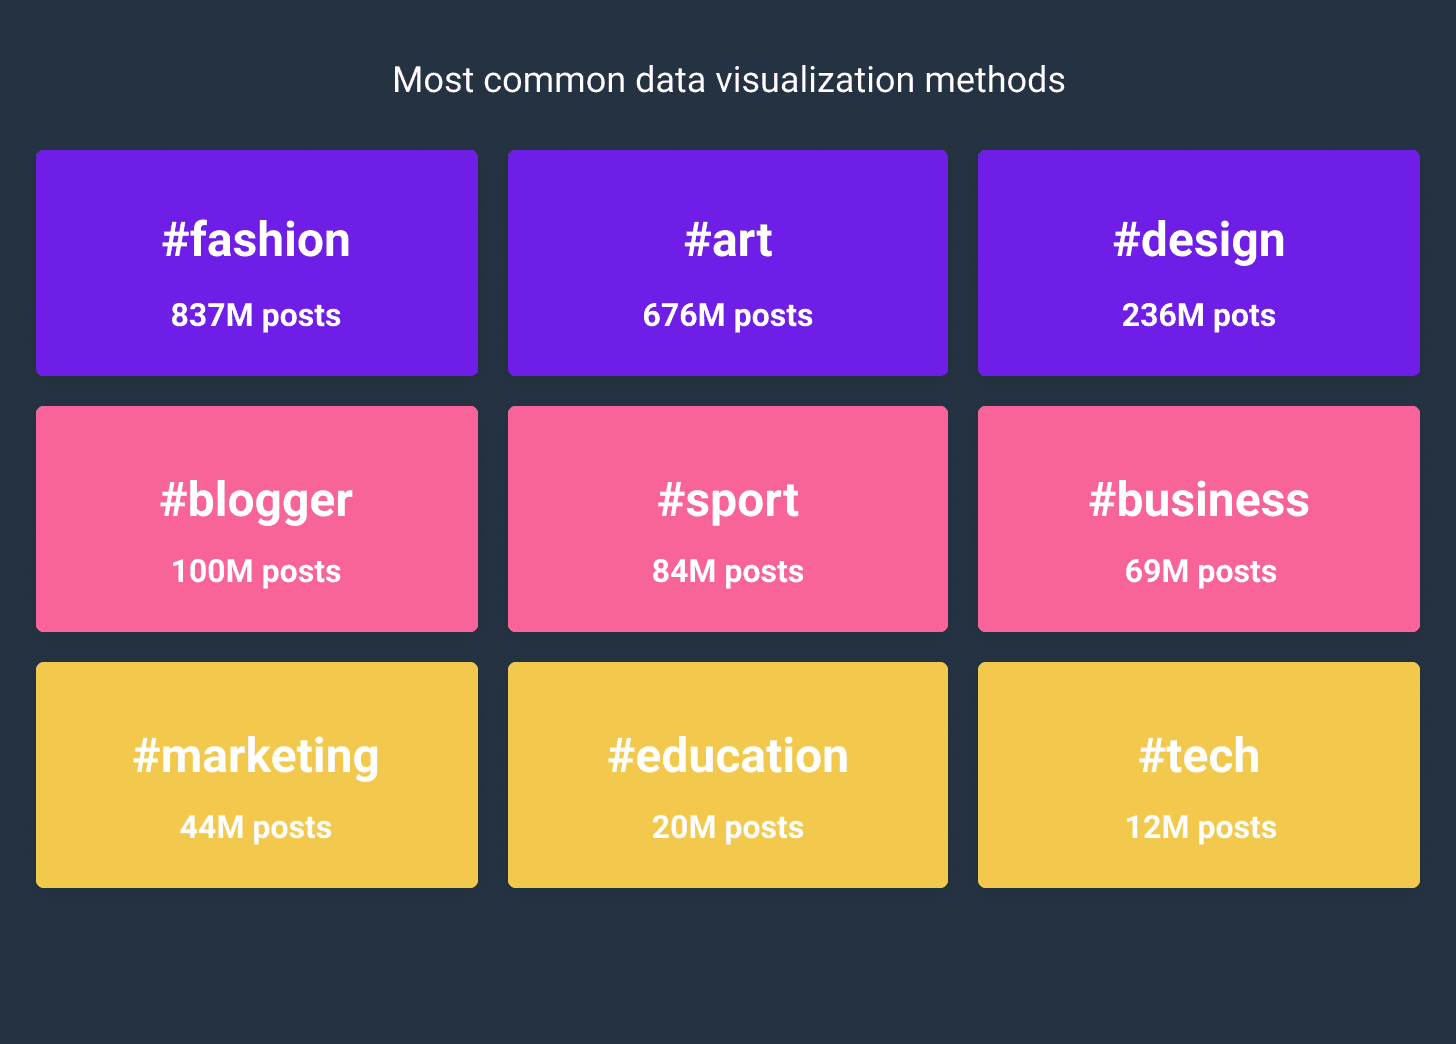 |
You should note that some hashtags may not drive the expected engagement. Therefore, it would be wise to keep a list of the best-performing hashtags and add them to your descriptions more often.
Besides, using hashtags will gauge your campaign awareness. If hashtags drive more traffic and engagement to your business site, it means they're relevant to your campaign.
Hashtags also help you see how your competitors' content is performing. You may use a tool for tracking your competitor's activities on social platforms – this way, you can narrow down the best-performing hashtags.
To see how your used hashtags are performing, open the Instagram Insights section. Then, select a post and click 'View Insights' and swipe up to view the full page. Finally, head to the 'Impressions' metric, under which you'll see the 'From hashtags' function.
A hashtag is an Instagram engagement metric that displays the number of people who saw your post via your added hashtag.
Website Traffic
If you're running an Instagram account for your business, you must be aiming to drive traffic to your website. However, your ultimate goal should be improving ROI, short for Return on Investment: that's why you must keep track of the traffic metrics.
Here's the tricky part: you can't add hyperlinks to your Instagram posts or comments – users will not be able to click on them. Although you can add a clickable link to your Instagram profile bio, it will not drive much traffic.
But here's a solution: by adding UTM text codes to your link, you can track the tags via Google Analytics and see how visitors get to your site.
A reporting tool will make it very easy for you to create cross-channel reports that contain data from multiple sources - like Google Analytics and Instagram - in one report. Any shortcomings of native analytic tools can be quickly negated as the data is extracted automatically from ALL of your digital marketing tools.
We actually created an Instagram Dashboard template for you to use - for free. All you have to do is integrate your Instagram business account with our platform, and the latest metrics will find themselves within the dashboard. It's easy to use, and most importantly - simple to relay vital data to others. Try it out!
Some Common FAQs
How do I get Instagram metrics?
You can keep track of most of the Instagram metrics through the Instagram application. Others will require calculating manually or using a tool.
And, as you already know, you'll need to use UTM parameters to track the total number of website visitors.
What is a reasonable impression rate on Instagram?
The impression rate is the number of people who saw your post relative to your followers count. In general, the average Instagram engagement rate is 1.22%.
It can be a valuable KPI when you want to track your brand awareness. Nevertheless, it's not entirely useful – impressions don't account for unique views.
Published on Feb 03 2020
WRITTEN BY
Roberta AukstikalnyteRoberta is a content writer and editor who strives to share industry updates with her readers. Her professional background includes Public Relations and Customer Success.