9 Free Digital Marketing Report Templates to Save You Time
Looking for a digital marketing report template you can just plug-and-go?
This guide gives you 9 free, ready-to-use marketing report templates, designed to help you:
- Track the right KPIs (not vanity metrics)
- Report on multiple channels in one place
- Visualize performance with clean graphs and dashboards
- Customize your report in the exact brand colors, fonts, and images you want
- Automate the delivery of your reports through Slack or email

Feb 12 2026●7 min read


Instead of spending hours building a digital marketing reporting template from scratch, here are 7 you can use immediately, built for both agencies and in-house marketing teams.
Jump straight to the templates. Or stick around for insights from top marketers.
What Is a Digital Marketing Report?
A digital marketing report is a structured summary of your marketing performance across channels, built to show what’s working, what’s not, and what to optimize next.
It answers questions like:
- Are we hitting our KPIs?
- Is our ad spend generating positive ROAS?
- Is organic traffic increasing month over month?
- Which marketing channels drive the highest conversion rate?
- Where are we losing users (high bounce rate, low CTR, poor landing page performance)?
What Should a Marketing Report Template Include?
A strong marketing report template should:
- Show key metrics clearly
- Highlight conversion rate, CTR, ROAS, and return on investment
- Compare campaign performance period-over-period
- Give stakeholders actionable insights
- And update automatically in real-time
That being said, based on marketers we’ve talked to, here are the sections they recommend:
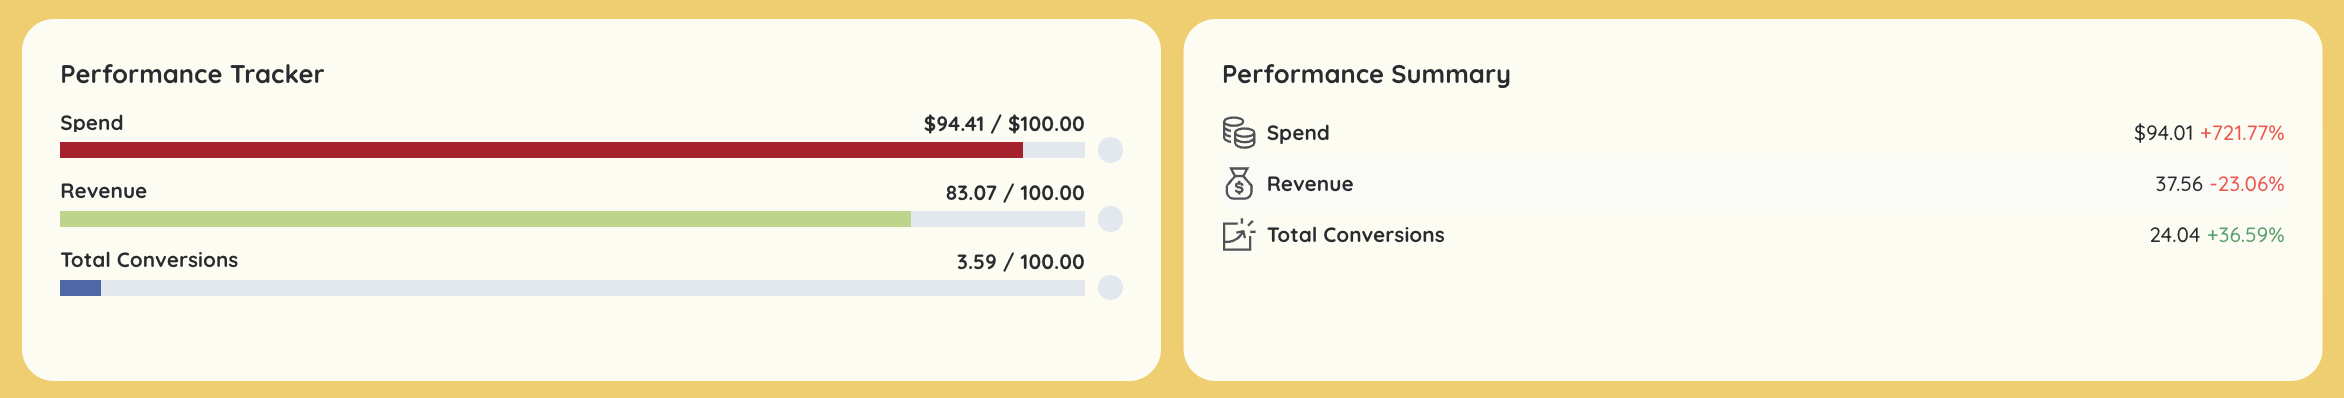
1. Goal pacing
Before campaigns launch, agree on concrete goals with your clients or stakeholders. Then, start every campaign performance report template showing how you’re pacing towards goals.
For example:
- 20% revenue increase
- 4x ROAS
- 1,000 new leads
- 15% higher conversion rate
As Elizabeth Greene, Co-Founder at Junglr, an Amazon Ads agency, puts it:
If you don’t know what goals you’re aiming for, it’s impossible to know what to focus on. ‘Growth’ isn’t helpful. Is it 5%? 20%? We require very concrete goals — and we revisit them monthly in our reports. If priorities change, we pivot. But we have to be specific.
Your report should clearly show:
- Target vs. actual
- Are we ahead, behind, or on track?
- How performance is trending month over month
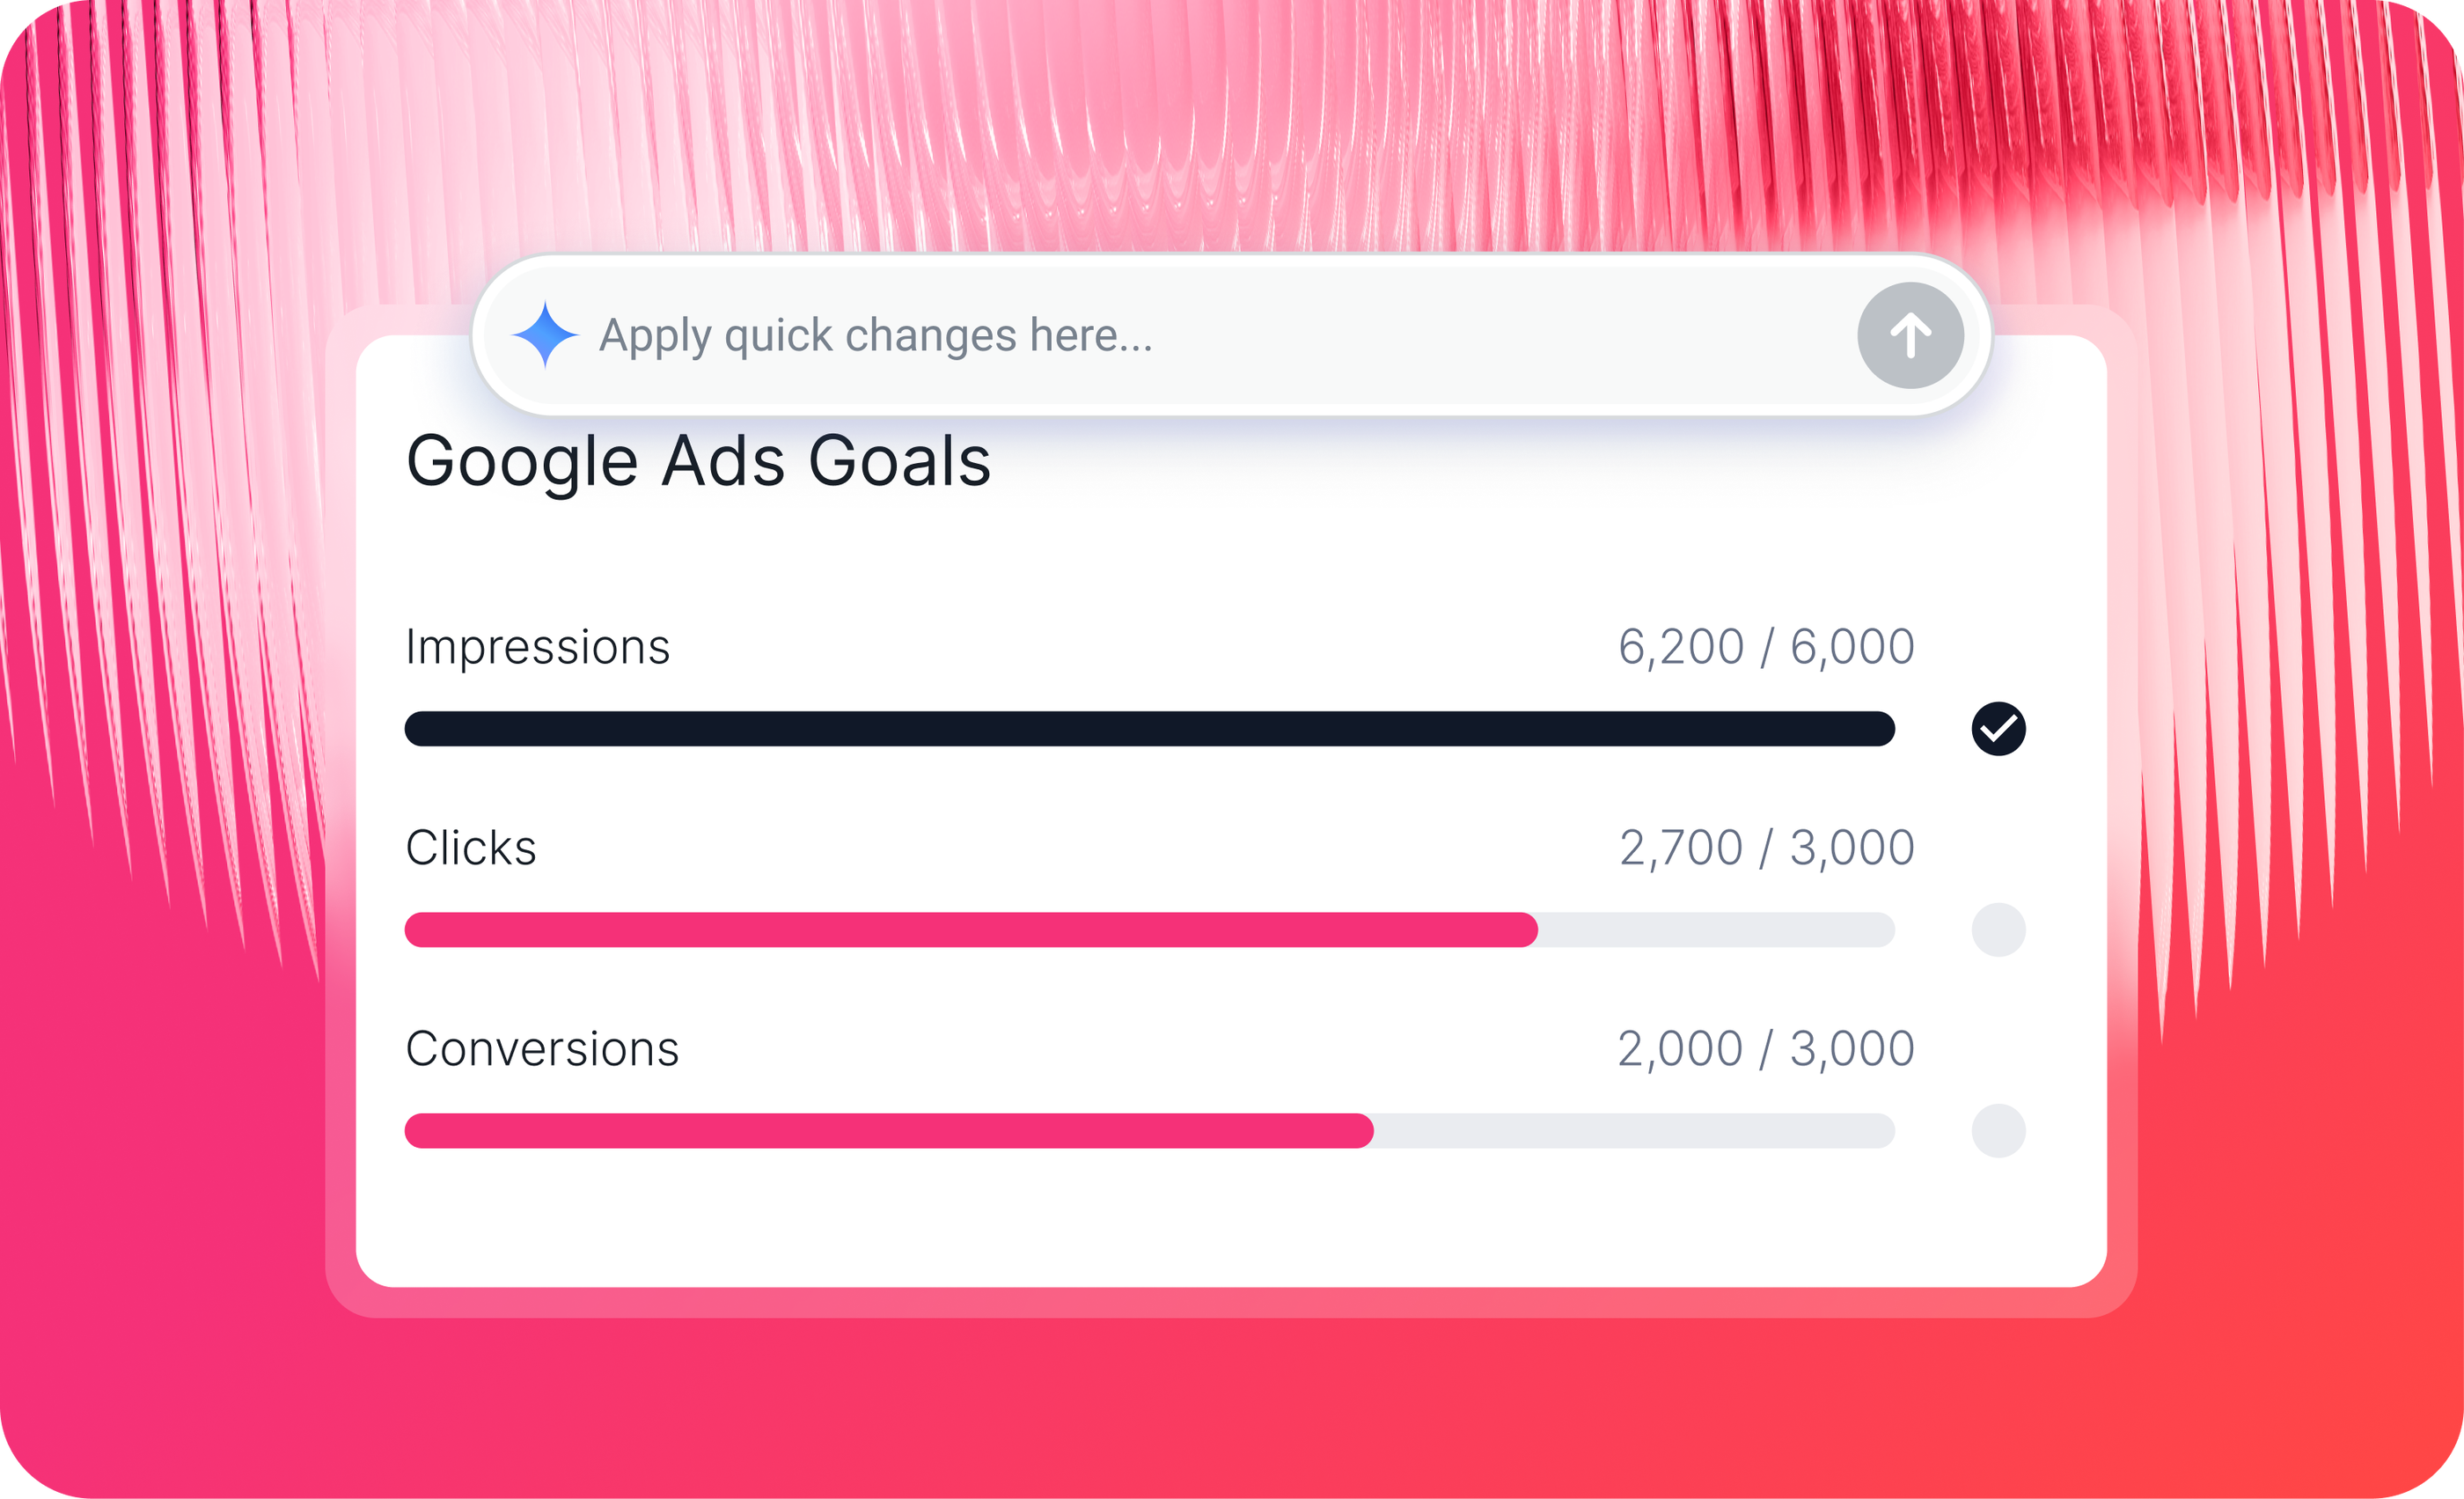
On Whatagraph, you can easily drag and drop a goal widget into your report and show progress like below:
2. Actionable Insights and Next Steps
Any strong marketing report needs an insights section answering:
- What worked?
- What didn’t?
- What are we optimizing next month?
We agree with Stephen, Founder of NexFusion, a digital marketing automation agency, when he told us:
The biggest mistake is dumping a spreadsheet of metrics with no context. Clients do not need to see every number, just the ones that matter. A simple fix is to create a one-page executive summary with three clear sections: what is working, what needs improvement, and the action plan for the next month. This keeps the report digestible and helps clients make informed decisions quickly.
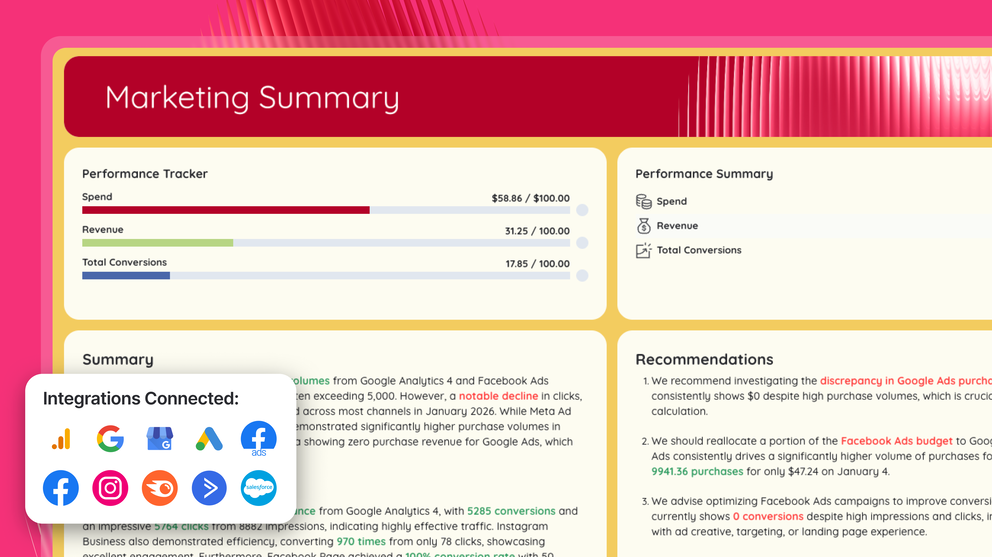
But writing out the insights yourself manually can be tedious and time-consuming. On Whatagraph, you can get Whatagraph IQ to write out the first version for you, and tweak it with your business context or tone.
You can choose from 5 different content types – Summary, Recommendations, Wins, Issues, or custom prompt, and from 18 different languages.
See how it works here:
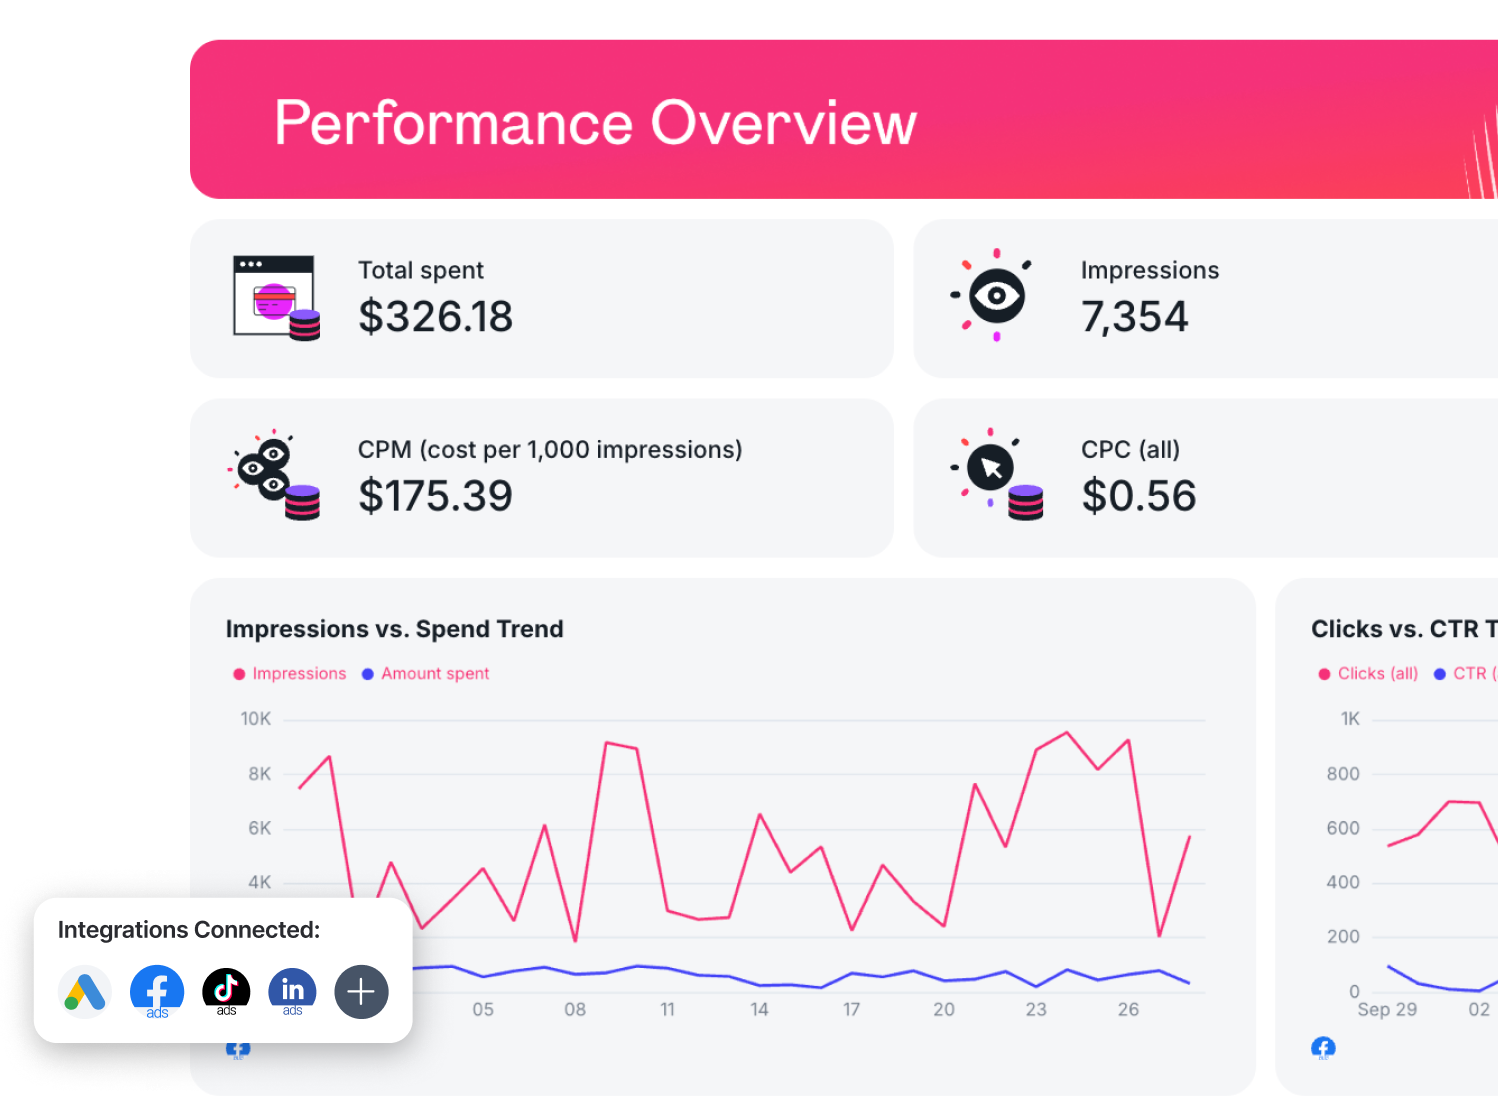
3. Top-Level KPIs (Executive View)
This is where you show:
- Revenue or lead generation
- Return on investment
- Cost per acquisition
- Conversion rate
- Overall marketing performance
4. Channel Breakdowns
Then you go deeper by marketing channel:
- SEO report: organic search traffic, keyword rankings, backlinks, Google Search Console impressions, click-through rate
- PPC / paid advertising: Google Ads performance, Facebook Ads, LinkedIn Ads, ad campaigns, ad spend, ROAS, CTR
- Social media marketing: engagement, reach, demographics, follower growth, social media report metrics
- Email marketing report: open rate, unsubscribe rate, click-through rate, email campaigns performance
- Ecommerce reporting: revenue by channel, average order value, customer acquisition cost
Each section should show period-over-period comparisons, so you can see trend lines, not just isolated numbers.
Annnd with that, let’s head to the templates.
9 Free Digital Marketing Report Templates
Jump to each report template:
- Cross-channel analytics report template
- PPC report template
- SEO report template
- Social media report template
- Multichannel eCommerce report template
- Google Ads report template
- Email marketing report template
- Facebook Ads report template
- Google Analytics (GA4) report template
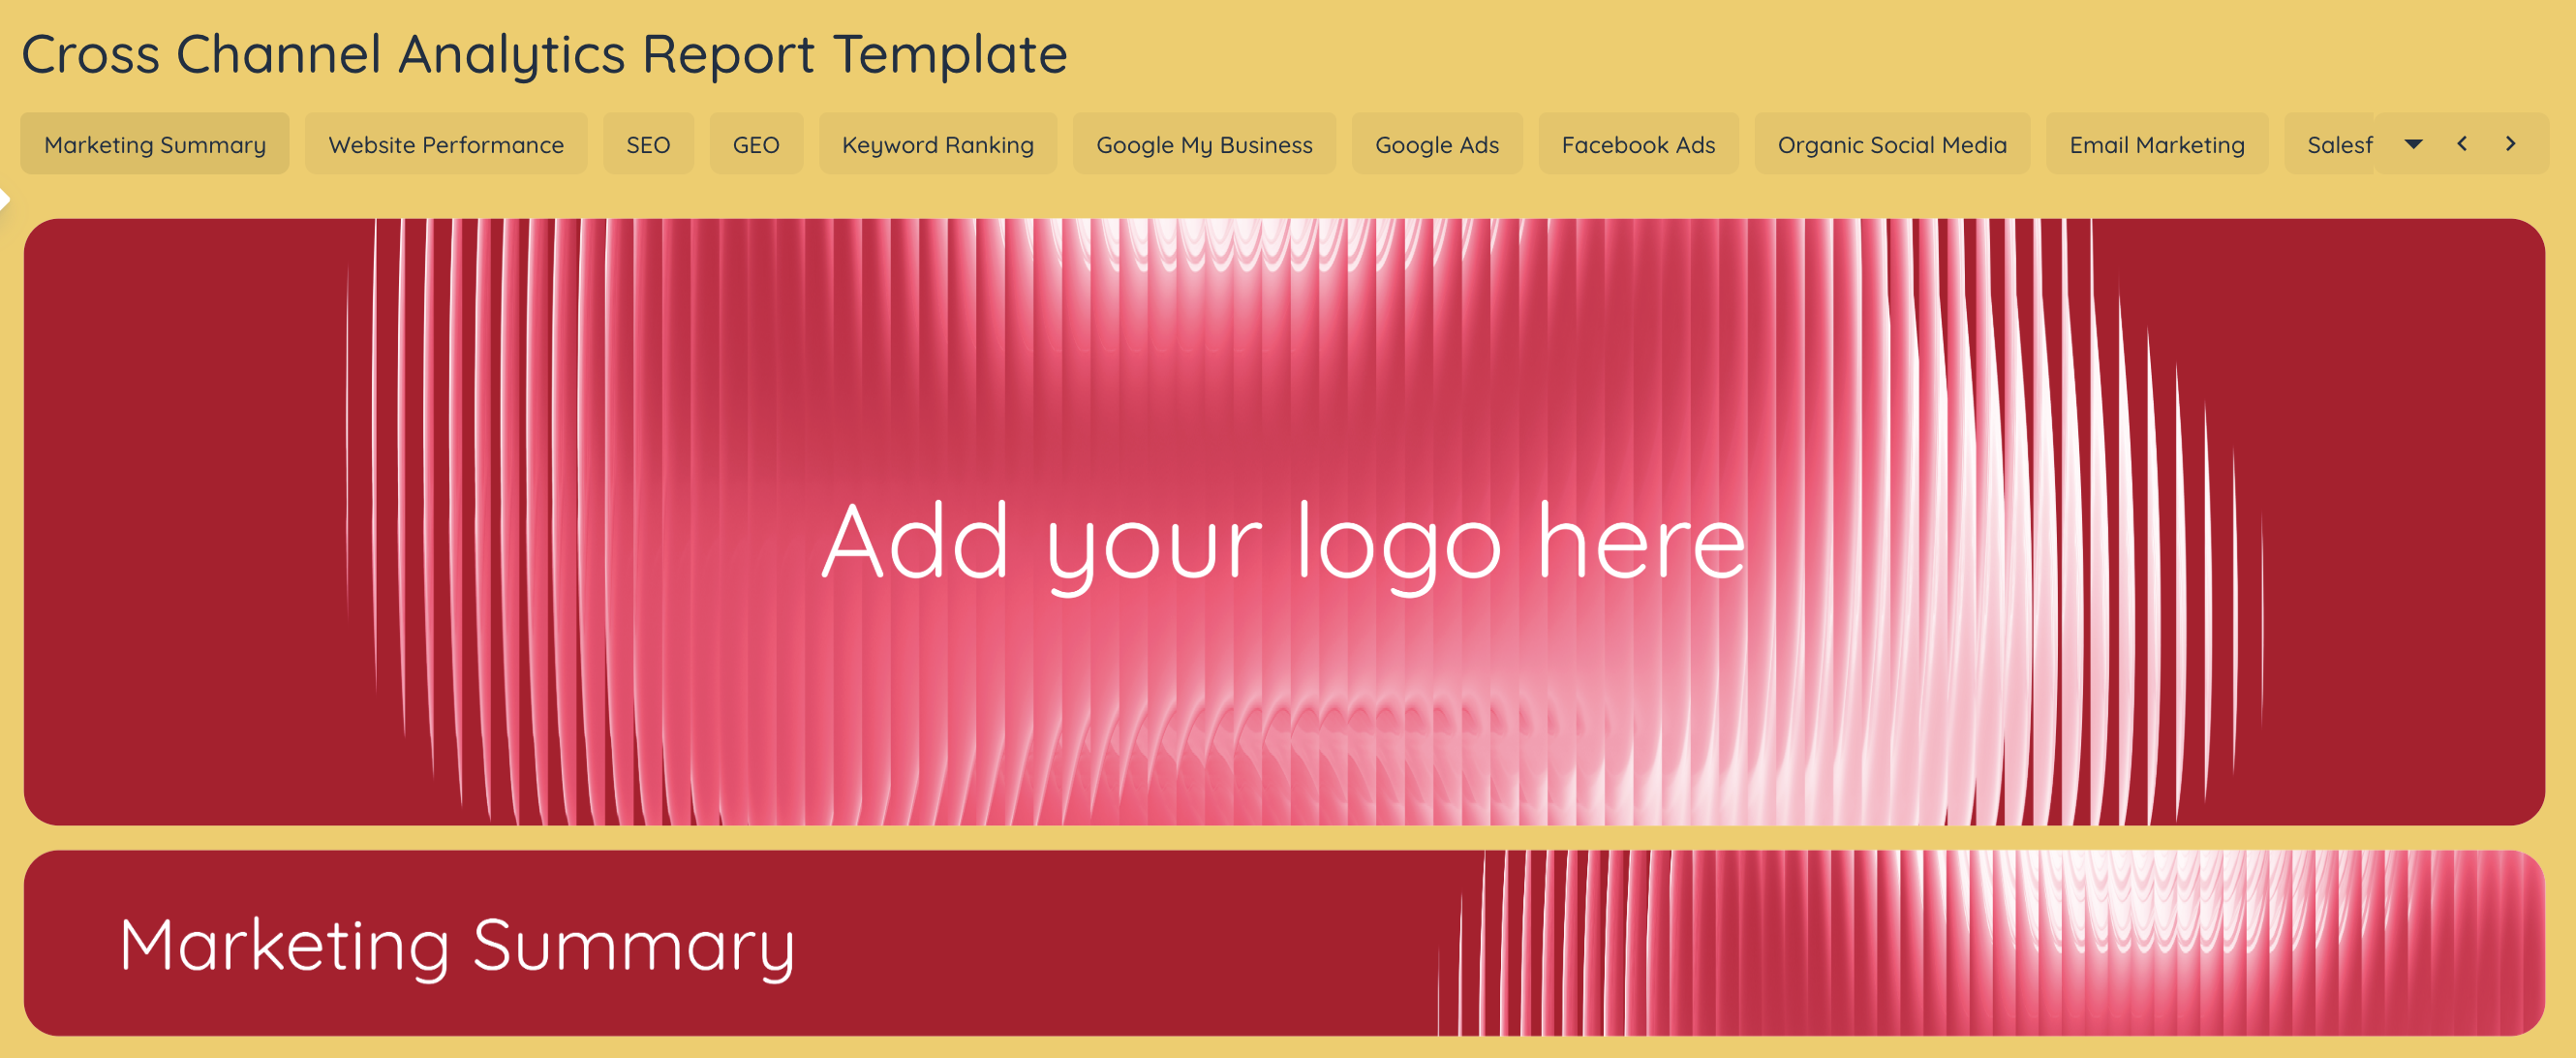
1. Cross-Channel Analytics Report Template
 Use this template for free with your data
Who it’s for: Marketing managers and agencies running multiple marketing channels (paid + organic) who need one clean performance report instead of five disconnected ones.
Channels connected: Google Analytics 4, Google Search Console, Google My Business, Google Ads, Facebook Ads, Facebook, Instagram, Semrush, ActiveCampaign, Salesforce
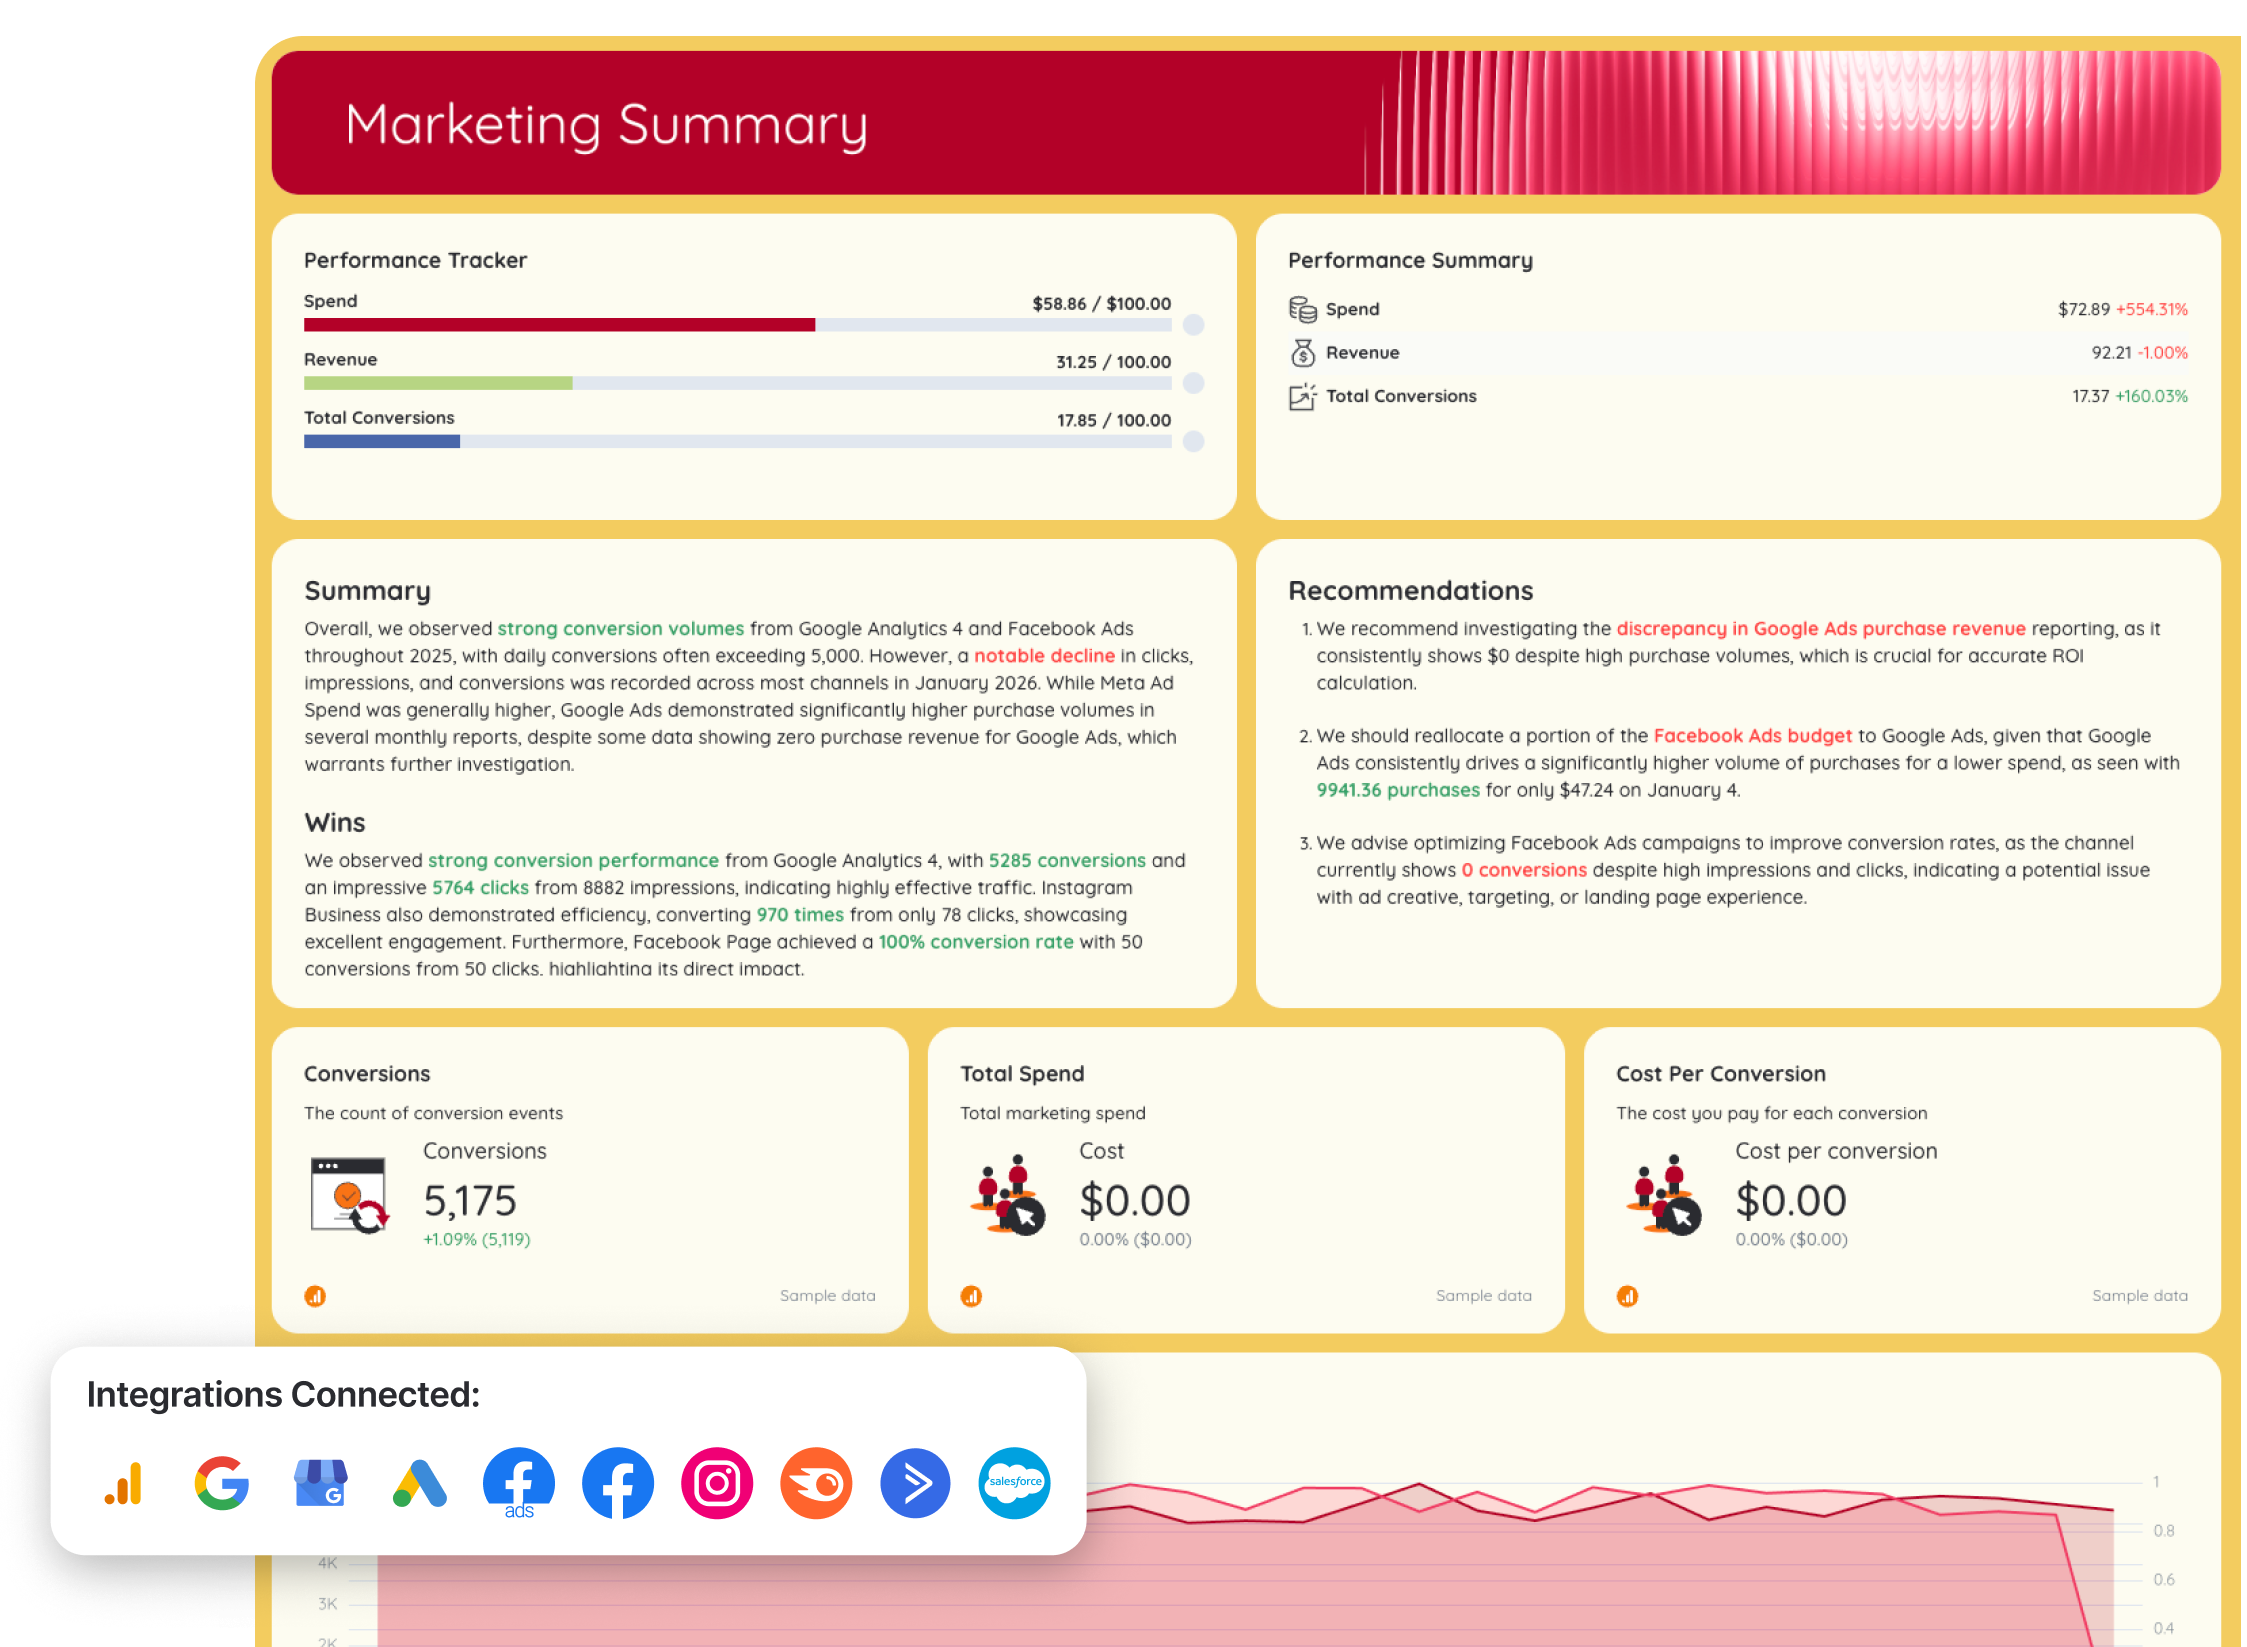
A cross-channel marketing analytics report template consolidates performance data from all your marketing channels into one unified dashboard. It shows how your SEO, paid advertising, social media, and website traffic contribute to overall conversions, revenue, and return on investment.
Use this as a monthly marketing report template or a weekly, quarterly, or annual one – it can be customized to any cadence you prefer.
How to use:
Metrics to visualize:
- Total conversions
- Total revenue
- Total ad spend
- Cost per conversion
- ROAS
- Conversion rate
- Website sessions
- Total users
- Clicks and impressions per channel
- Conversions by source
- Purchases by channel
- Revenue by channel
- Month-over-month % change
Best practices:
✅ Use different tabs to report on different channels (e.g. Google Ads, Social Media) to avoid a 40-page performance report template that takes hours to scroll through
 ✅ Always add goal pacing widgets and actionable insights on every tab of your report
 ✅ Have one executive summary at the beginning of the executive report template showing cross-channel totals metrics (e.g. Total Ad Spend across Google Ads and Facebook Ads)
✅ Create custom metrics (e.g. Total Ad Spend) to show on the summary page
2. PPC Report Template
 Use this template for free with your data
Who it’s for:
- Performance marketers managing paid campaigns
- Agencies reporting PPC results to clients
- Marketing teams optimizing ad spend and conversion rate
Channels connected: Google Ads, LinkedIn Ads, Facebook Ads, TikTok Ads
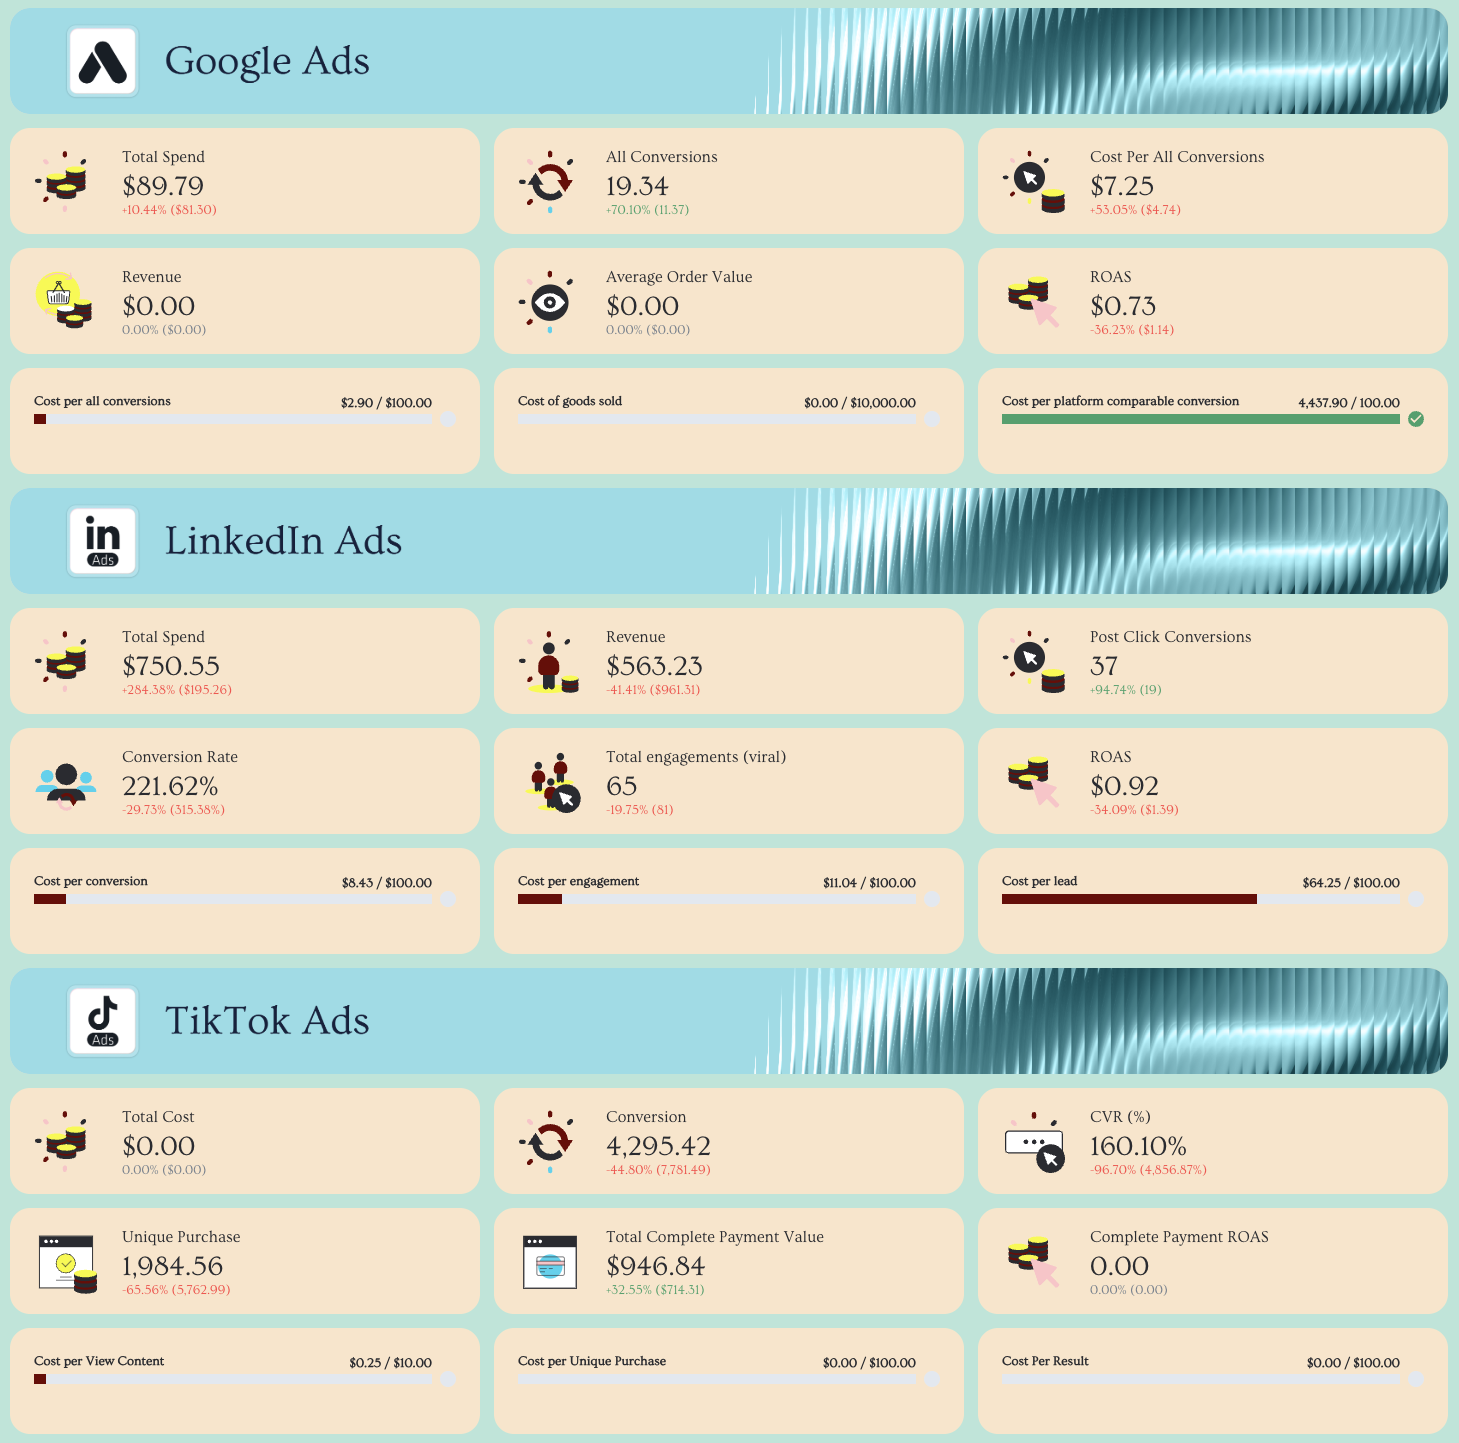
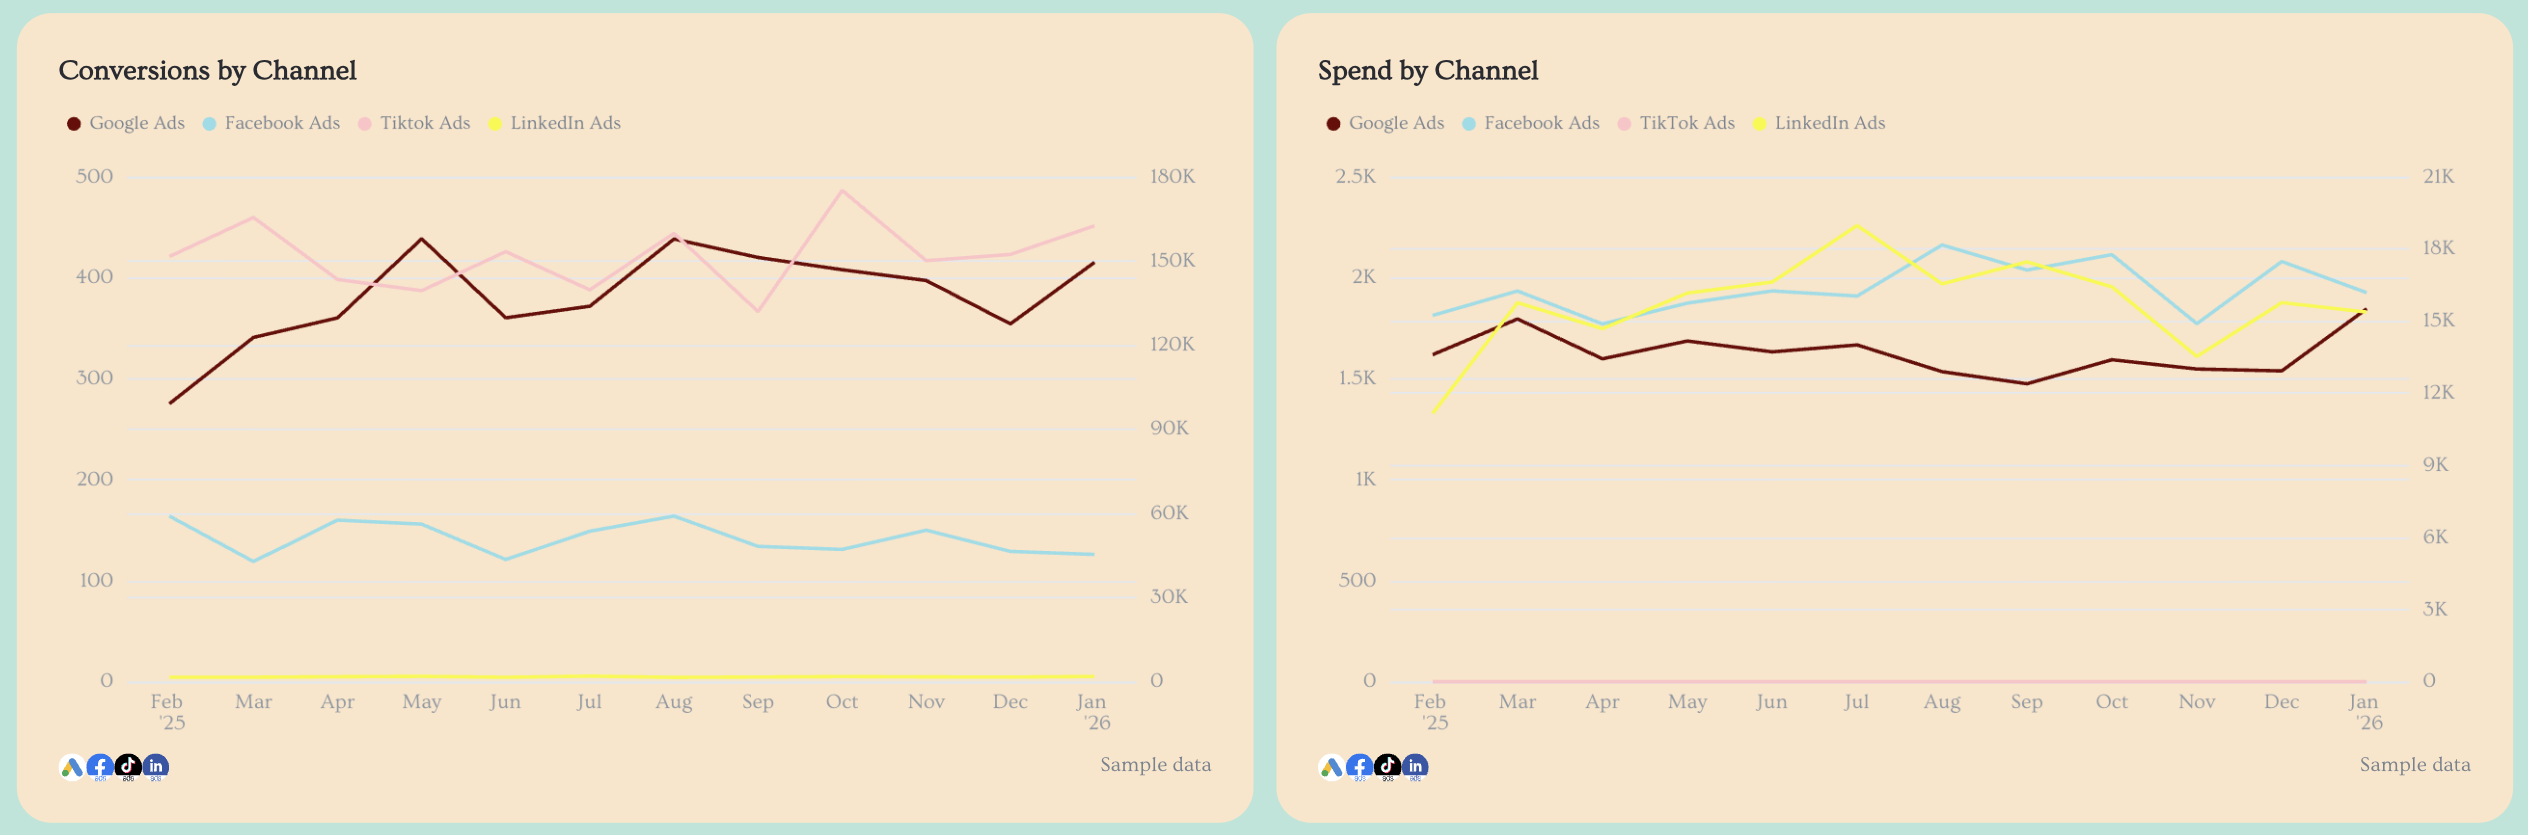
A PPC report template is built to show exactly how your paid advertising is performing, across Google Ads, LinkedIn Ads, Meta Ads, and other paid channels. It focuses on spend, conversions, ROAS, and optimization opportunities.
How to use:
Metrics to visualize:
- Total ad spend
- Total conversions
- Cost per conversion
- ROAS (Return on Ad Spend)
- Clicks
- Impressions
- CTR (click-through rate), CPC (cost per click), CPM
- Conversion rate
- Spend by channel
- Conversions by channel
- Campaign performance
- Ad performance
- Keyword performance (for Google Ads)
- Landing page performance
Best practices:
✅ Use separate tabs for each paid channel (Google Ads report template) to keep your advertising report template structured and easy to navigate
✅ Include a “Paid Advertising Overview” tab that aggregates total ad spend, total conversions, and total ROAS across all channels
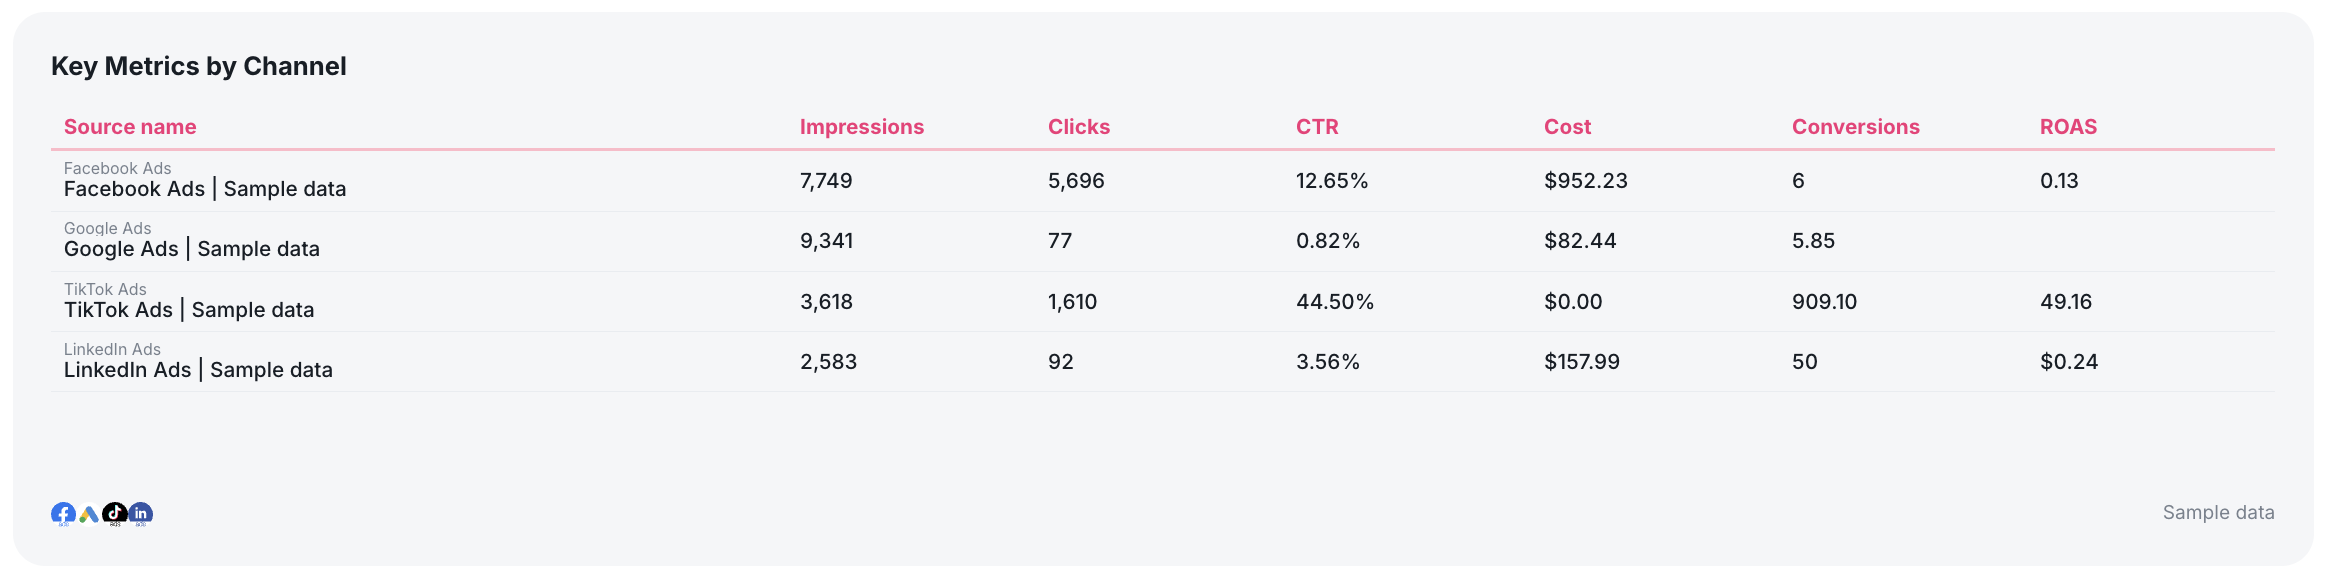
✅ Add a multi-source breakdown table showing key metrics (e.g. Ad spend) for all PPC channels in one view
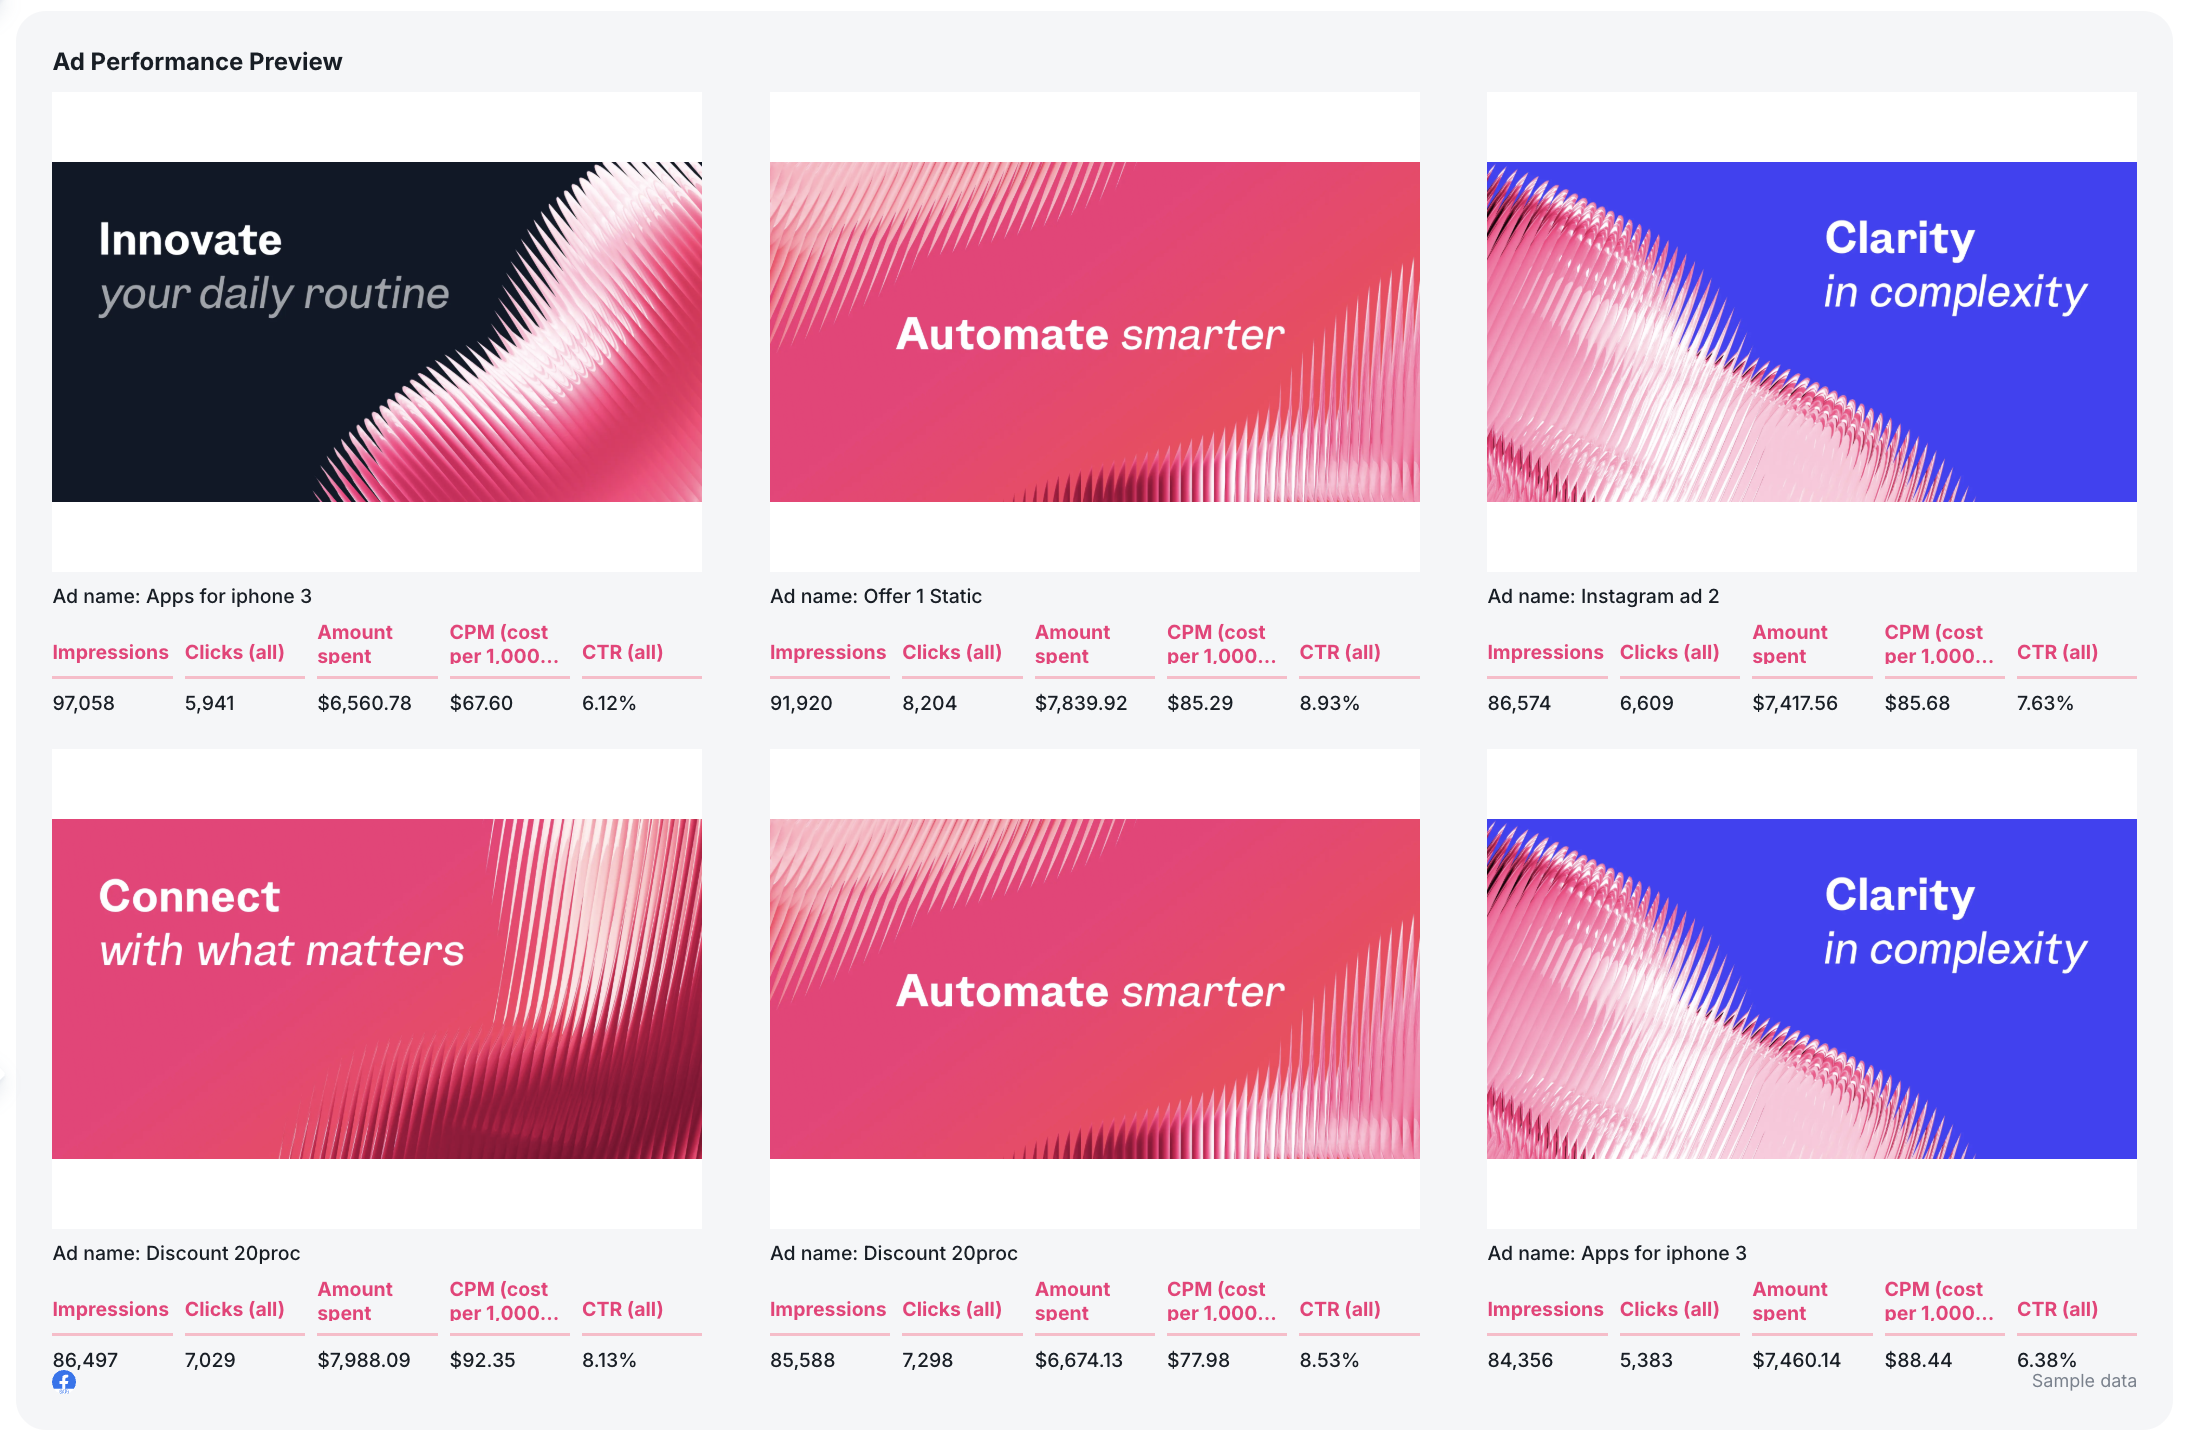
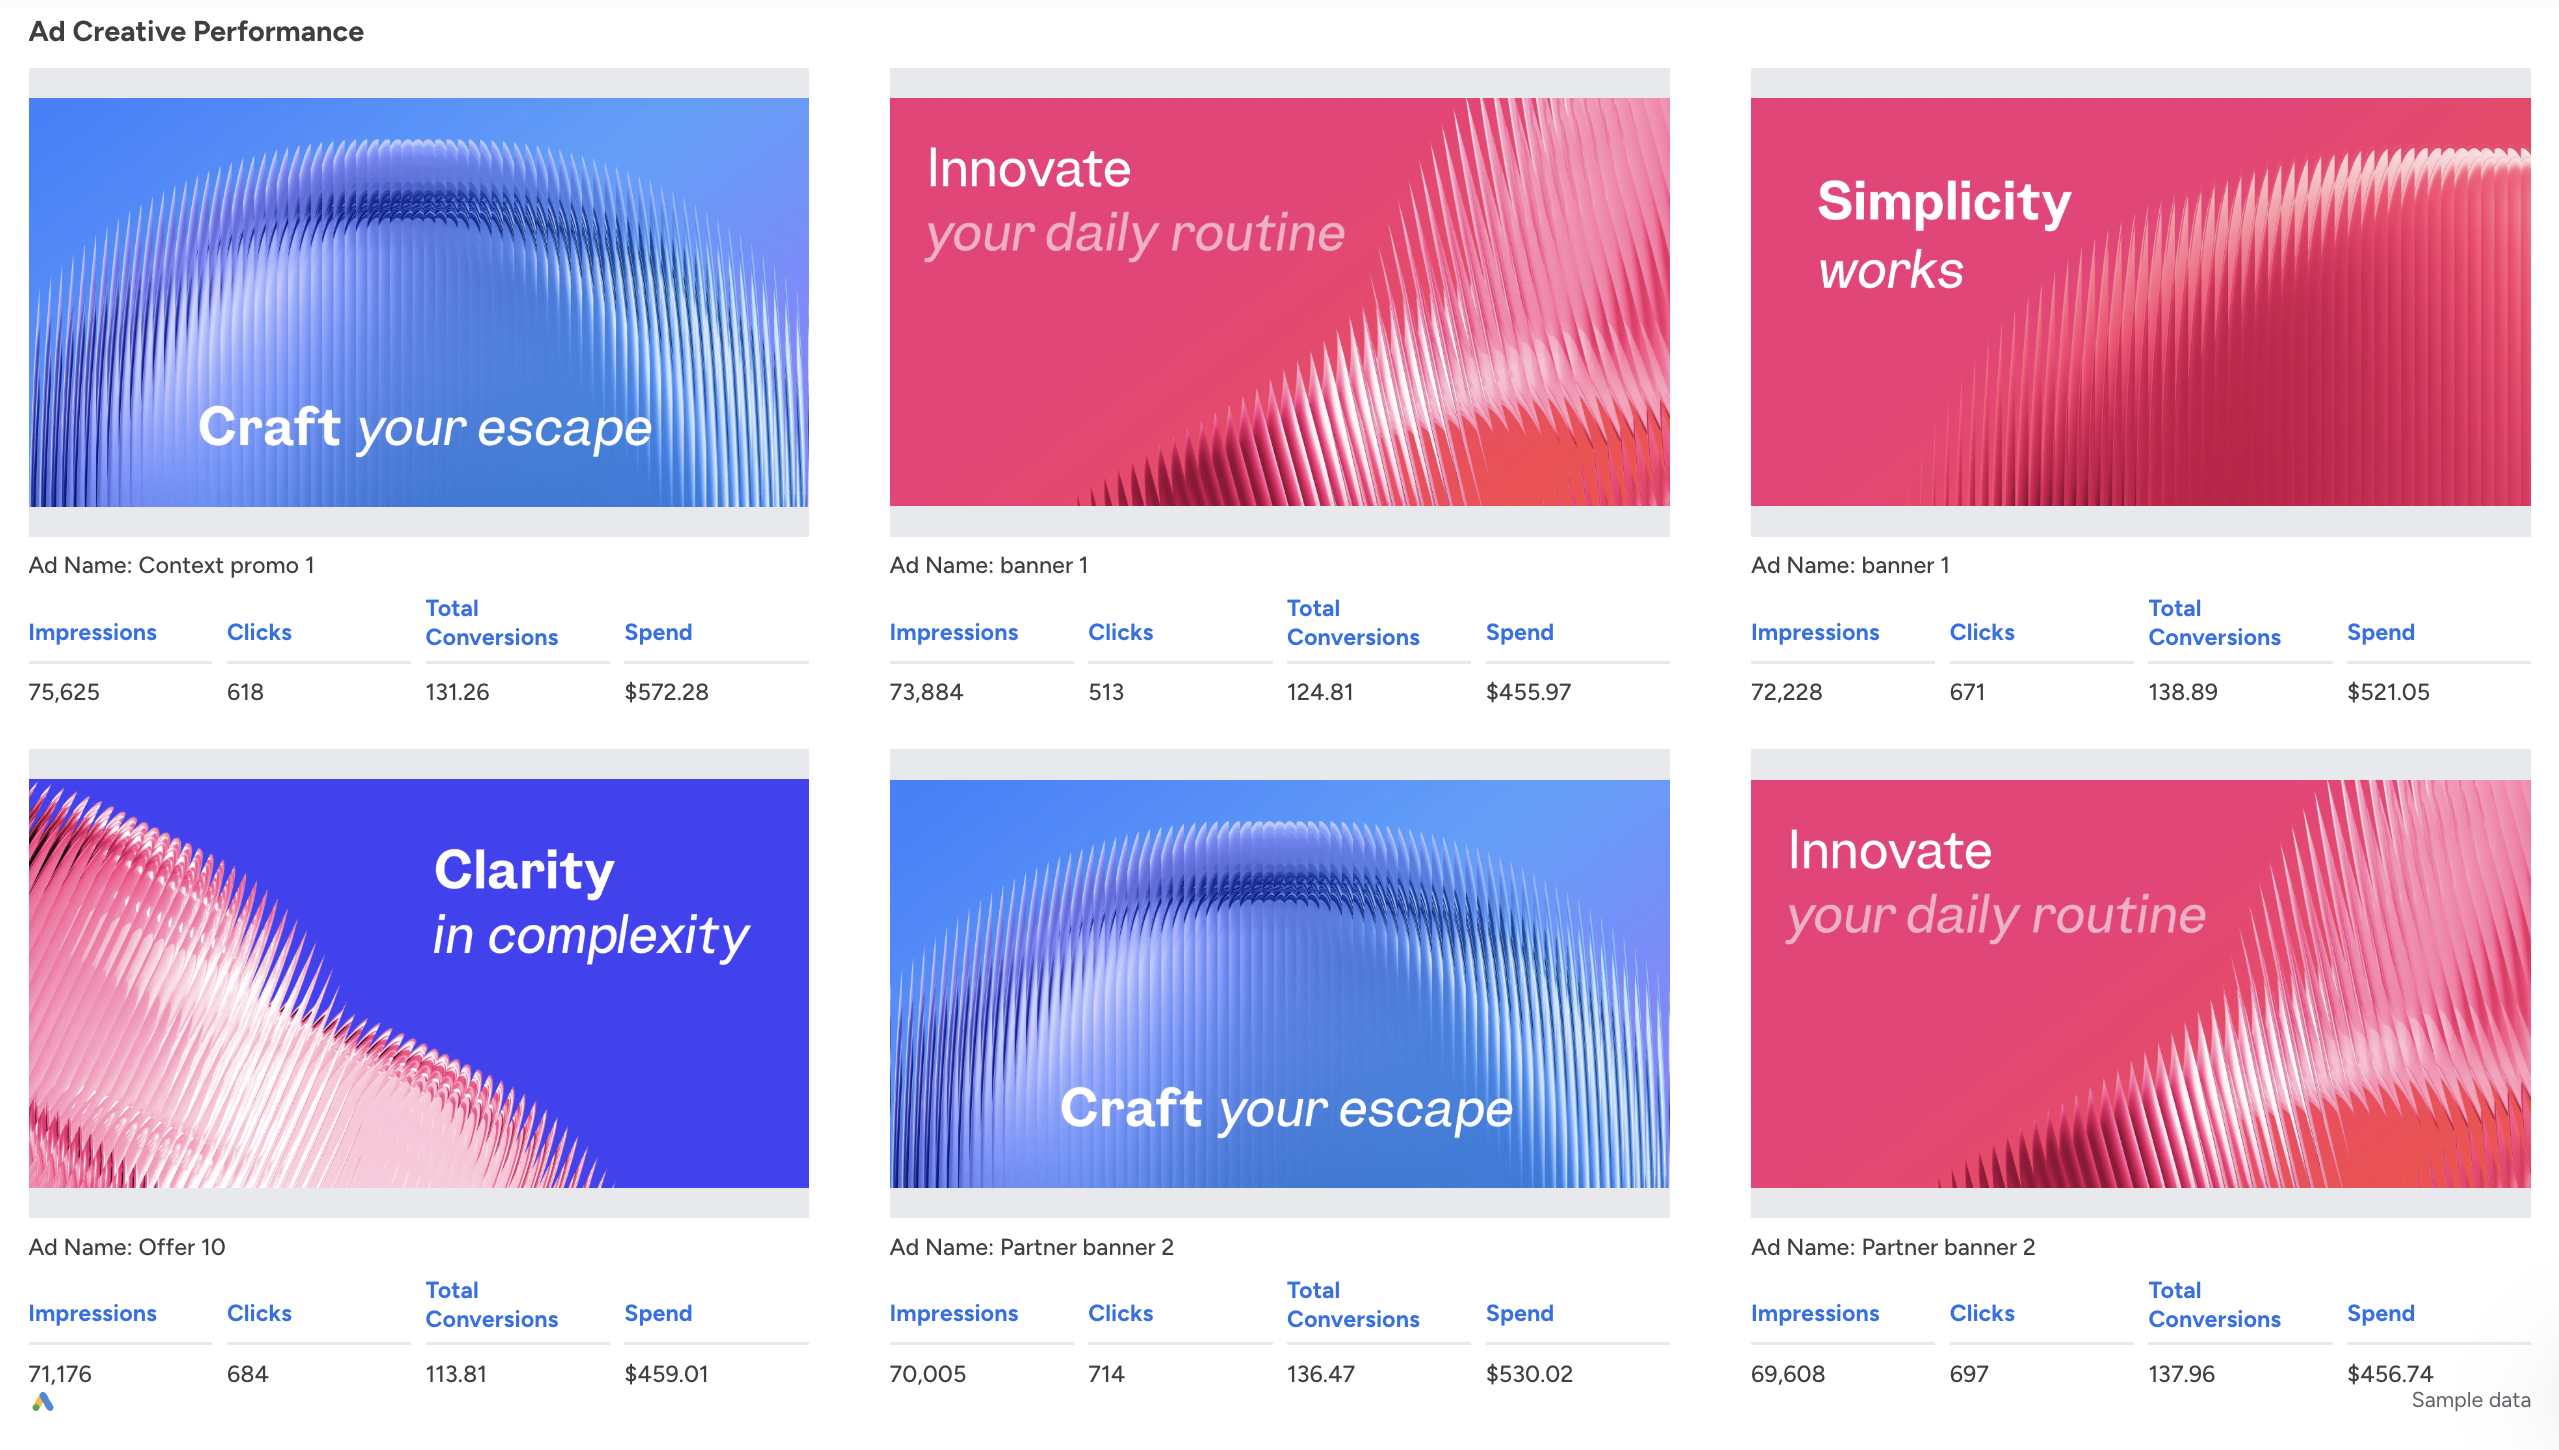
 ✅ Add a carousel chart showing the top performing ad creatives for each channel in your campaign reporting template
 ✅ Break performance down into three layers: Campaign → Ad → Keyword or Audience
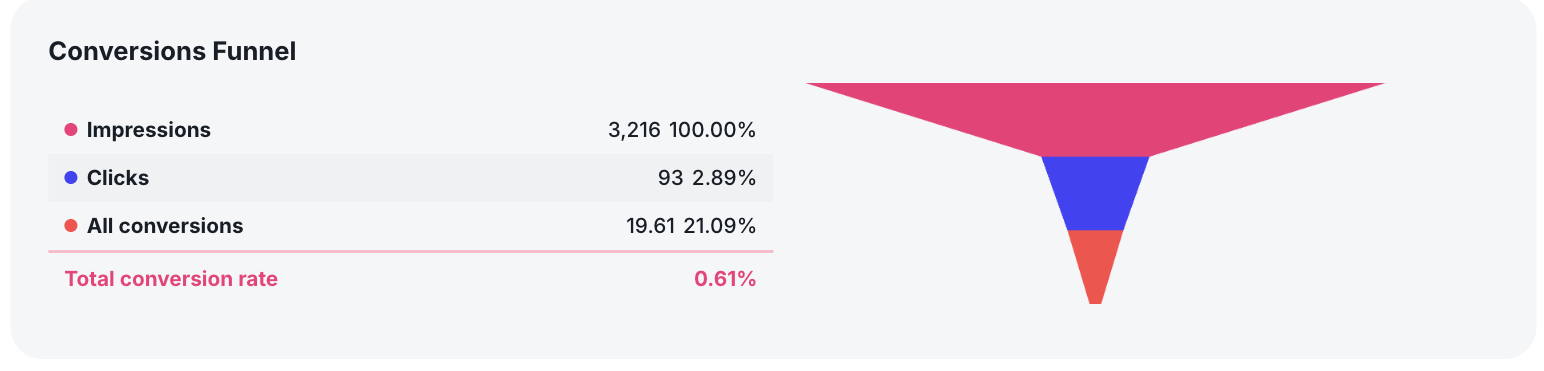
✅ Always include a funnel view (Impressions → Clicks → Conversions) to quickly identify drop-offs
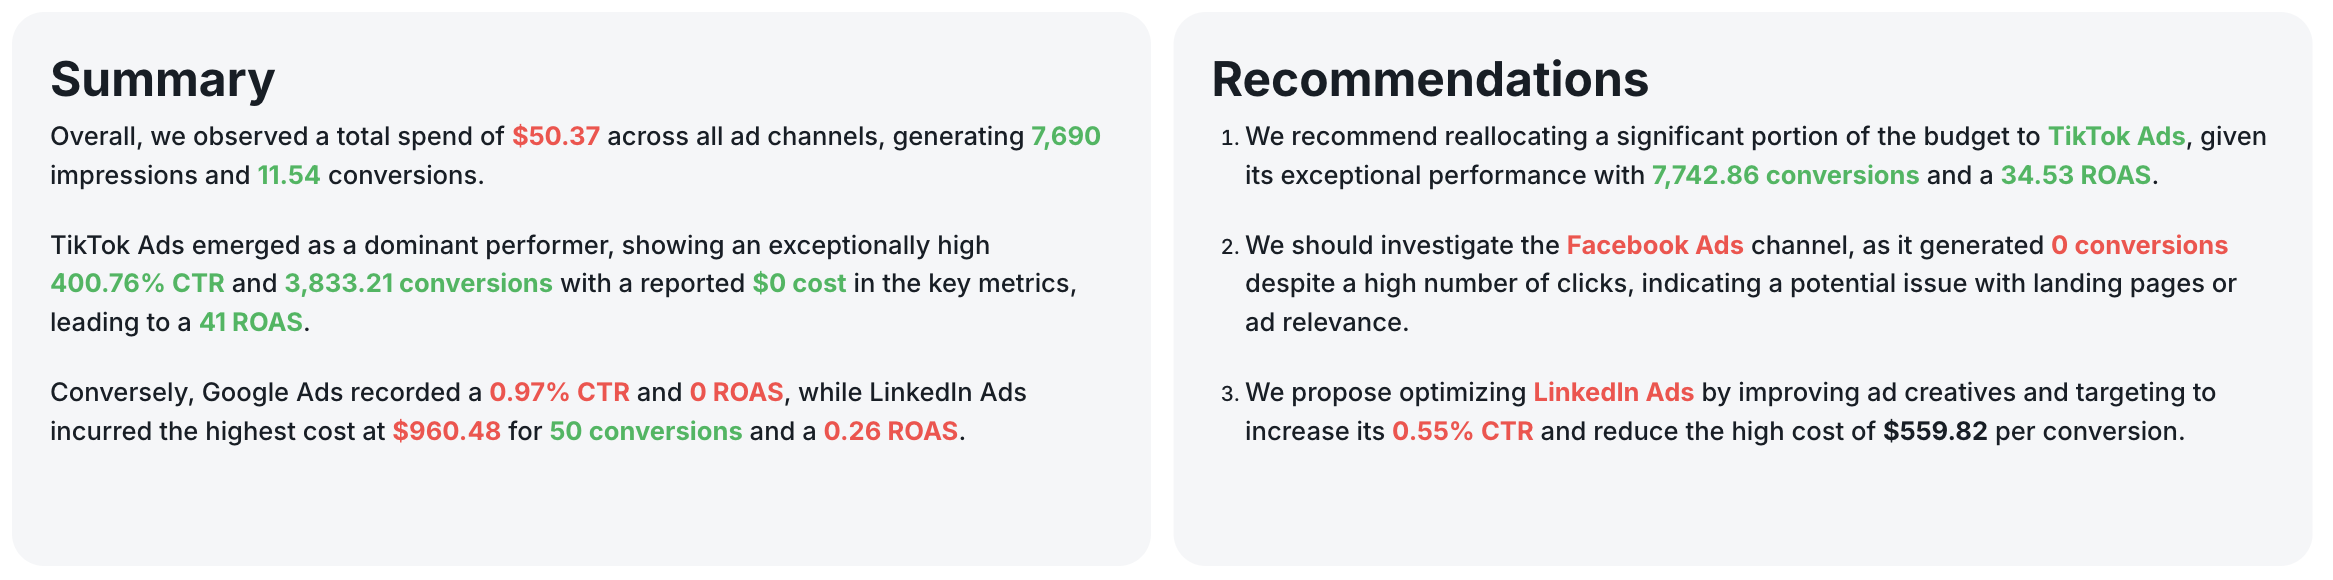
 ✅ Add a recommendations section at the bottom of each tab with clear optimization actions
3. SEO Report Template
 Use this template for free with your data
Who it’s for:
- SEO specialists and organic growth teams
- Agencies delivering white-label SEO reports
- Marketing managers tracking organic traffic and conversions
Channels connected: Google Analytics 4, Google Search Console
An SEO report template shows how your organic search performance contributes to traffic, conversions, and revenue. It connects rankings, impressions, clicks, and on-site behavior to real business outcomes.
How to use:
Metrics to visualize:
- Sessions
- Total users and New users
- Organic traffic by channel
- Impressions
- Clicks
- CTR (click-through rate)
- Average position
- Keywords ranking 1–10
- Conversions and Conversion rate
- Ecommerce purchases
- Transactions
- Total revenue from organic SEO
- Revenue by source / medium / device
- Top landing pages
- Page engagement rate and engagement time
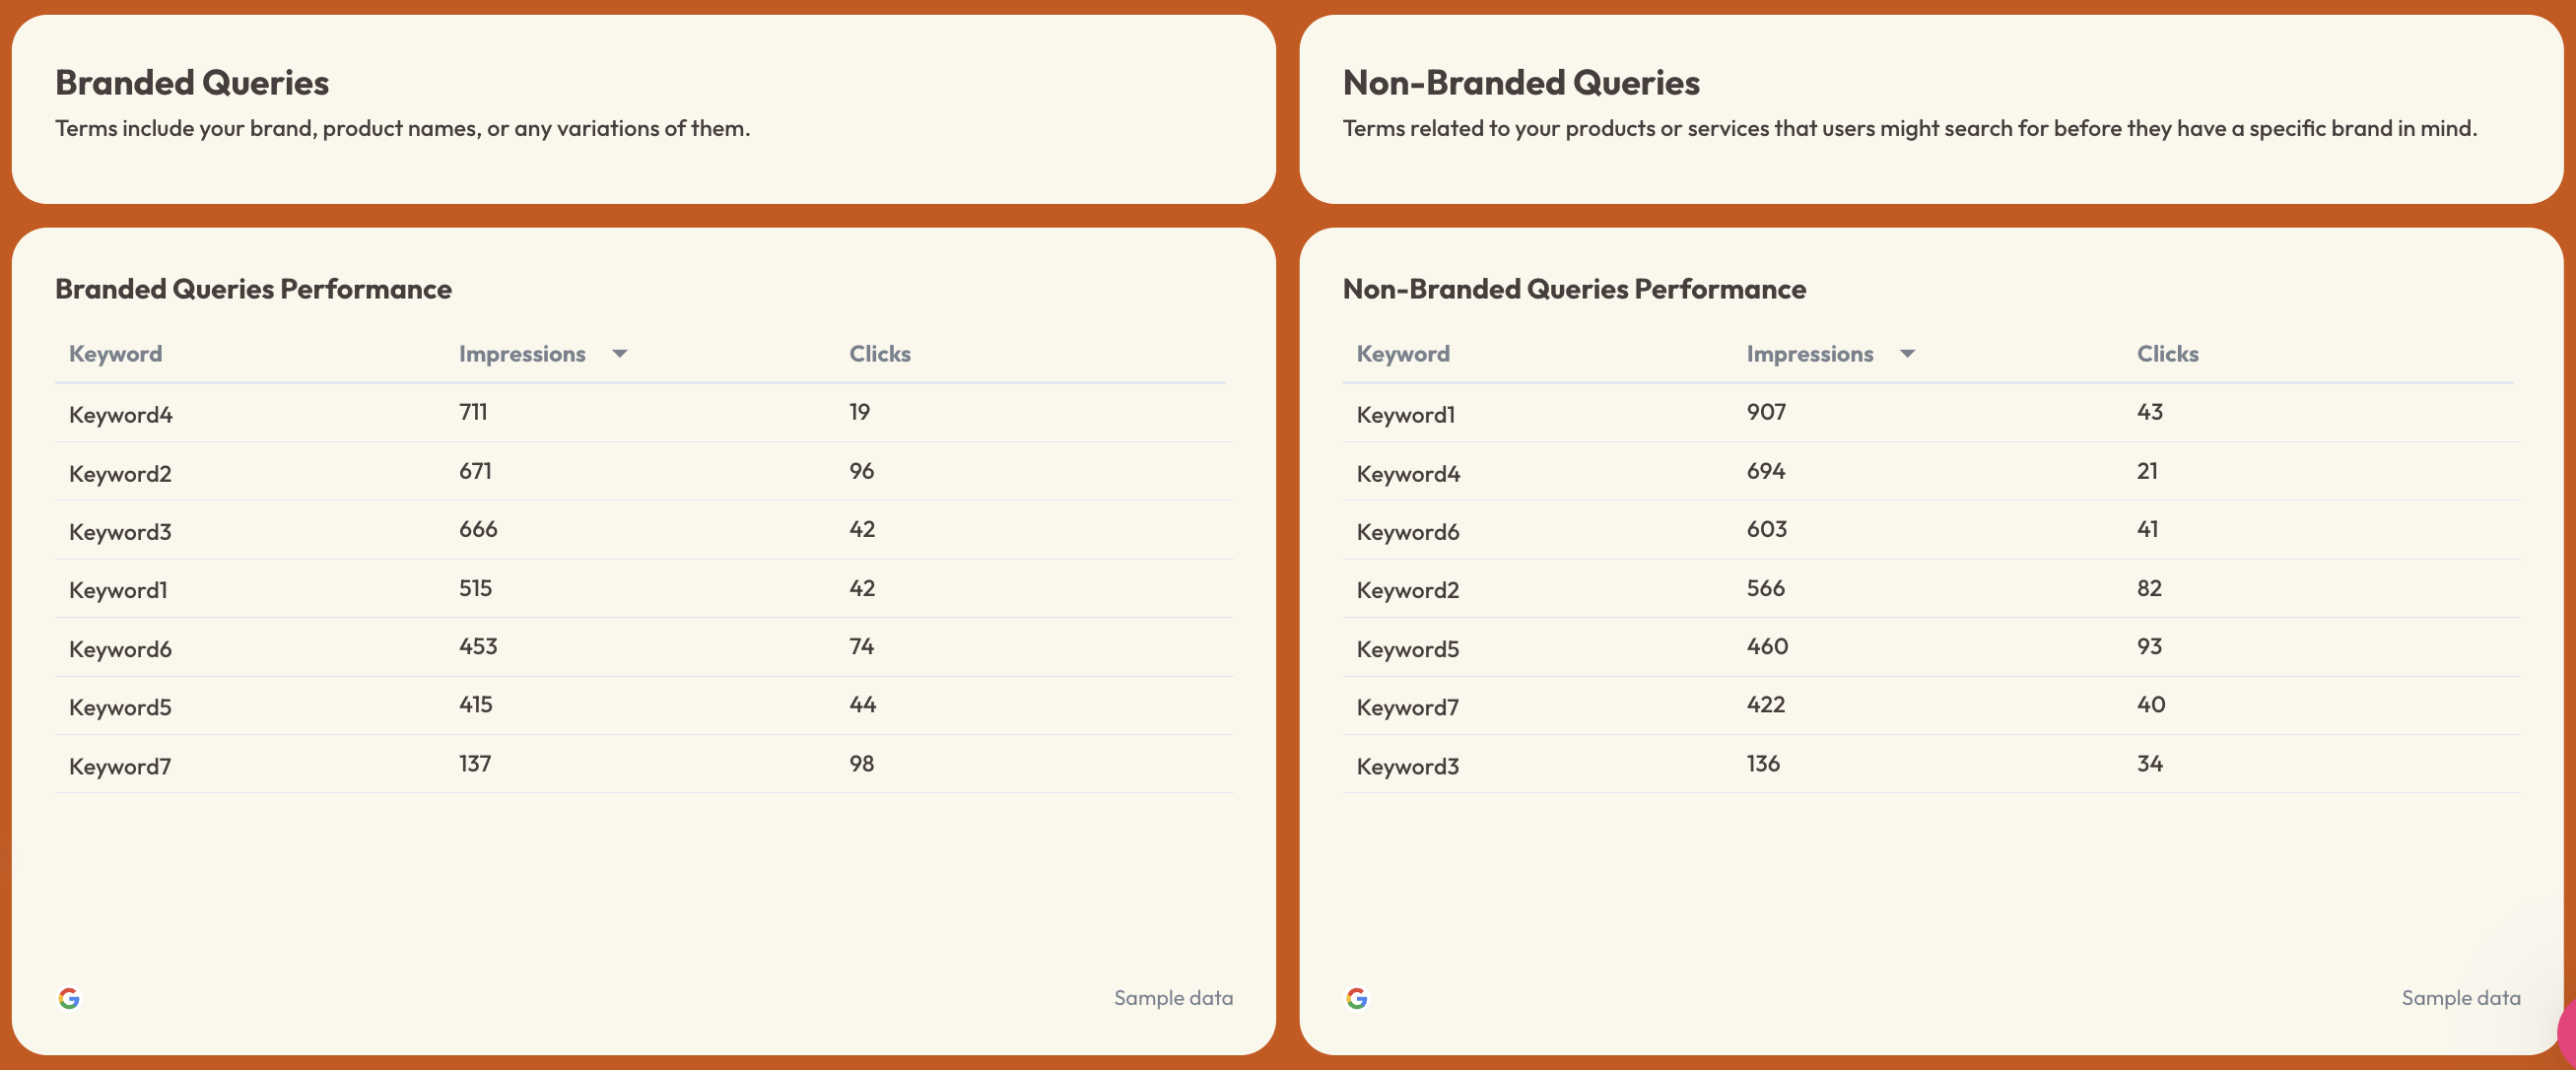
- Branded vs non-branded query performance
Best practices:
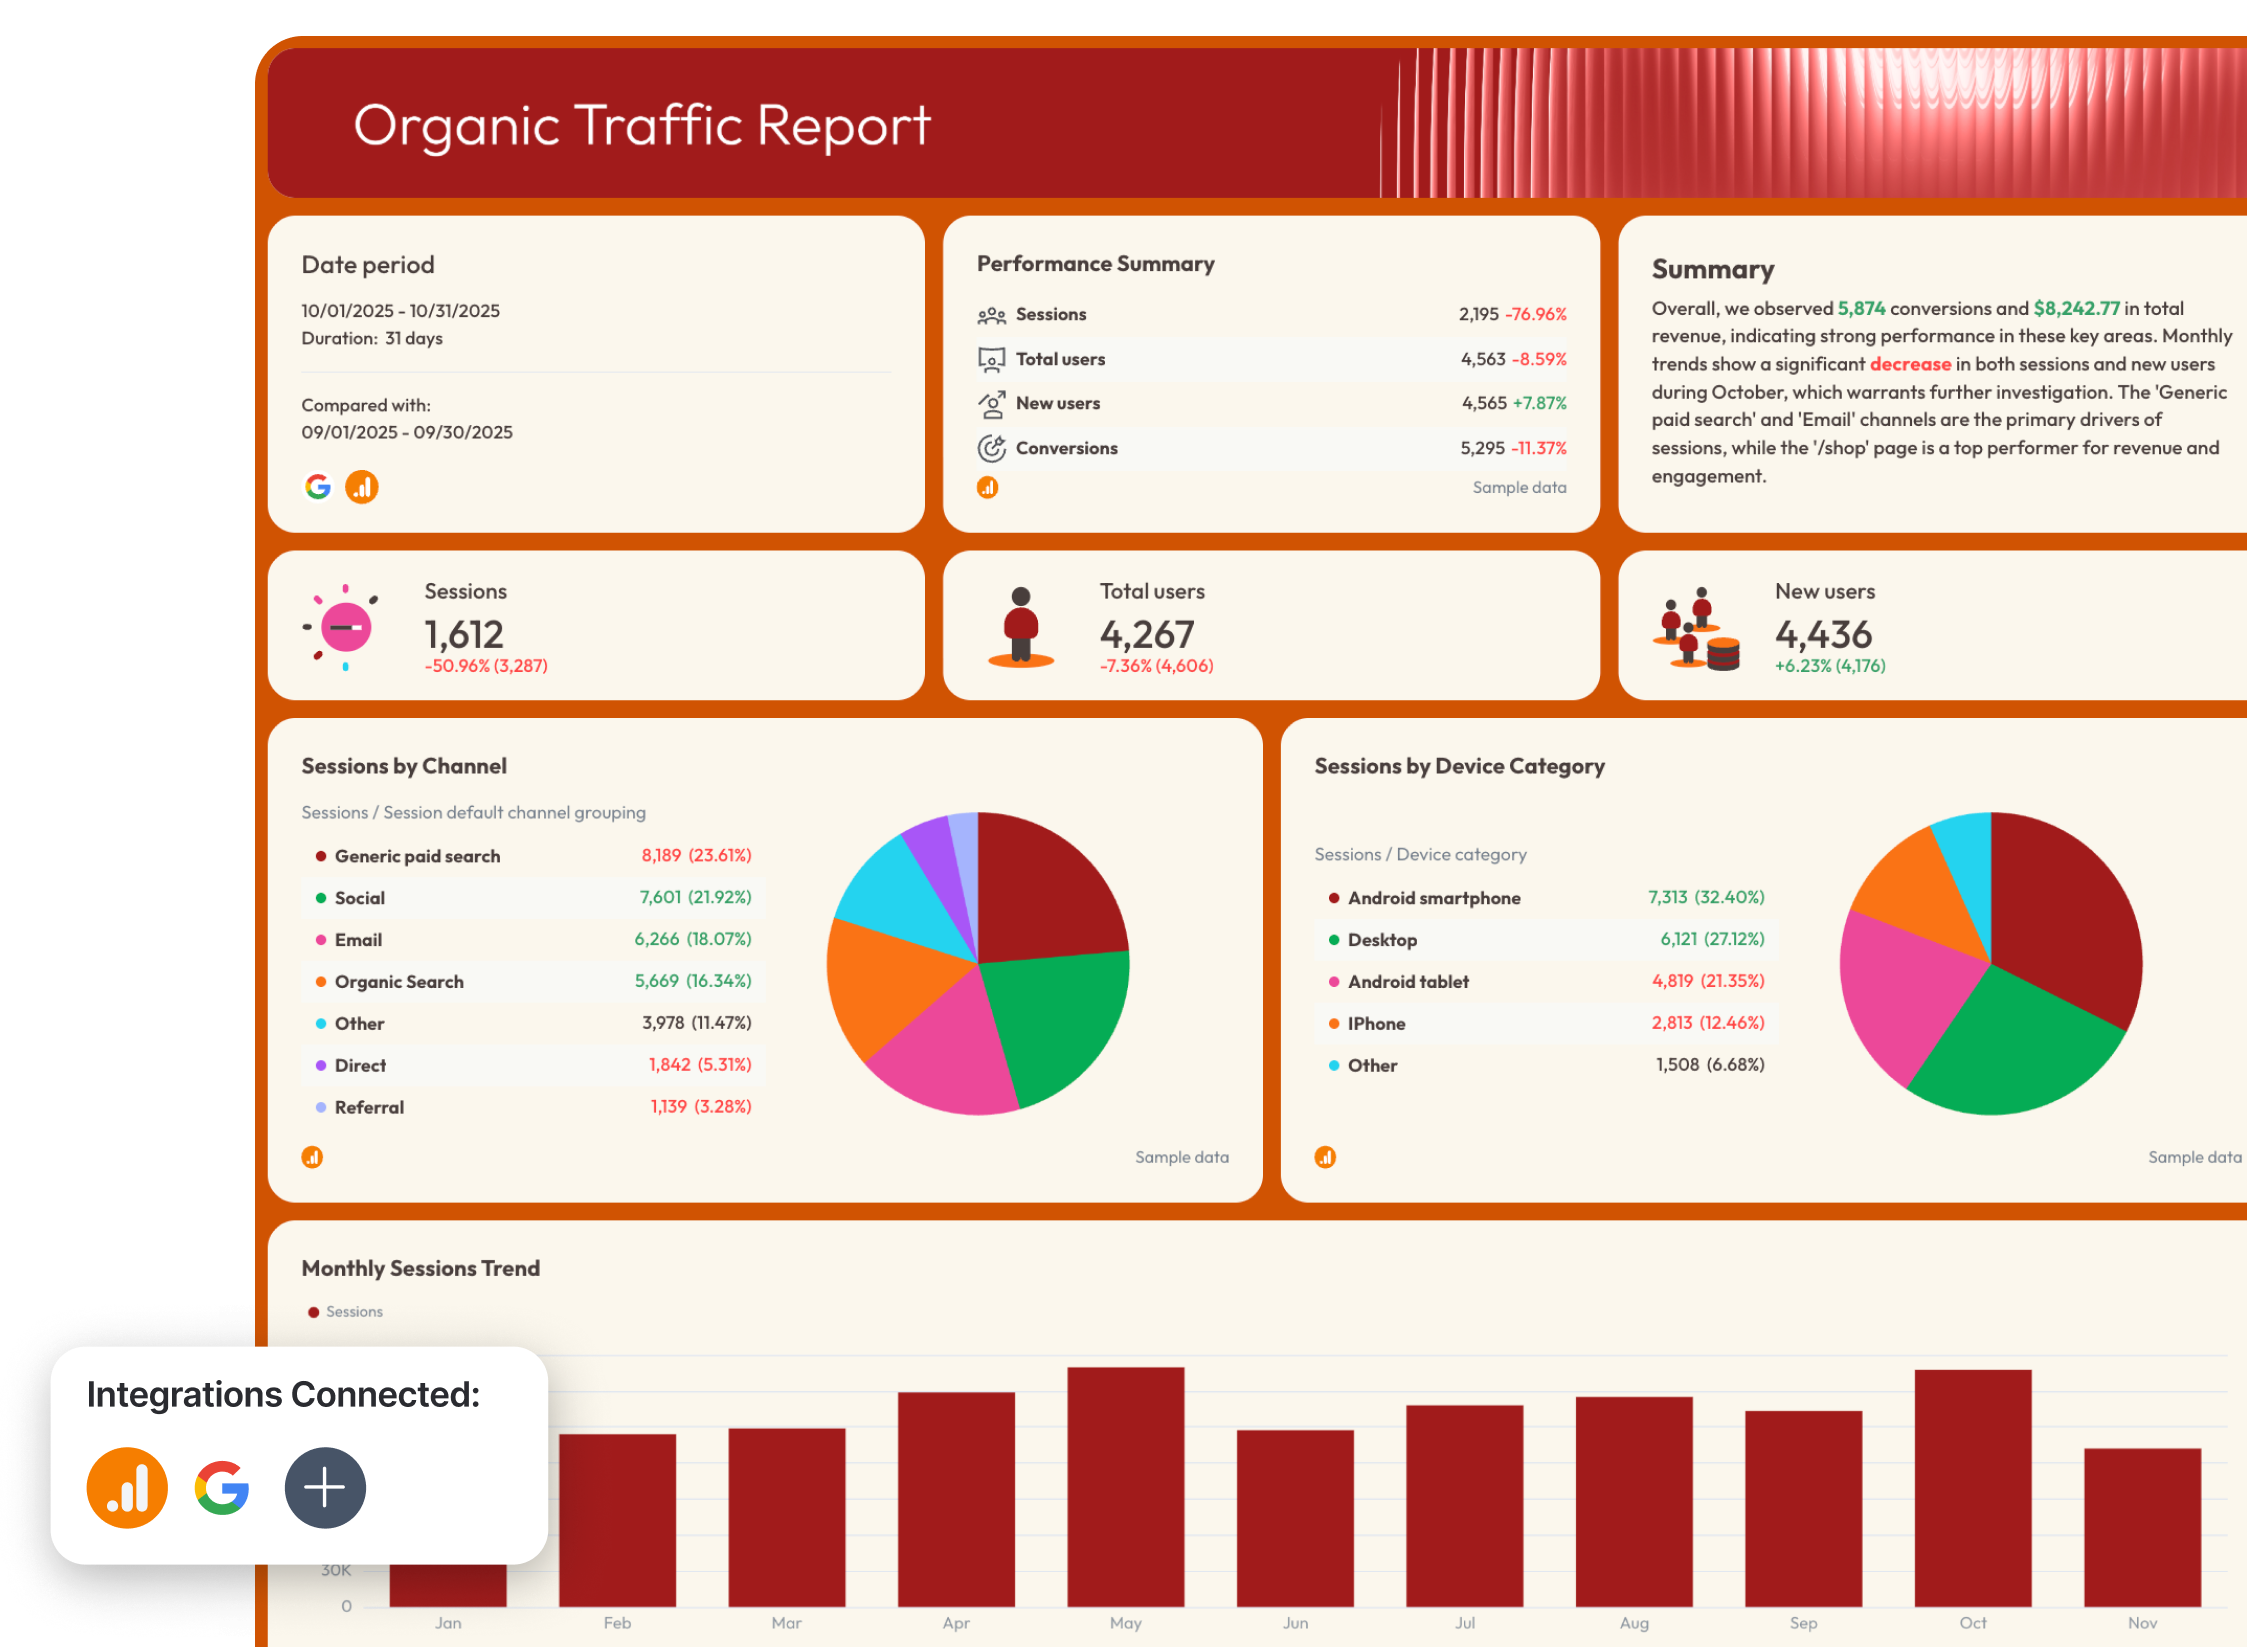
✅ Separate your report into three tabs: Organic Visibility, Organic Traffic, and Organic Conversions
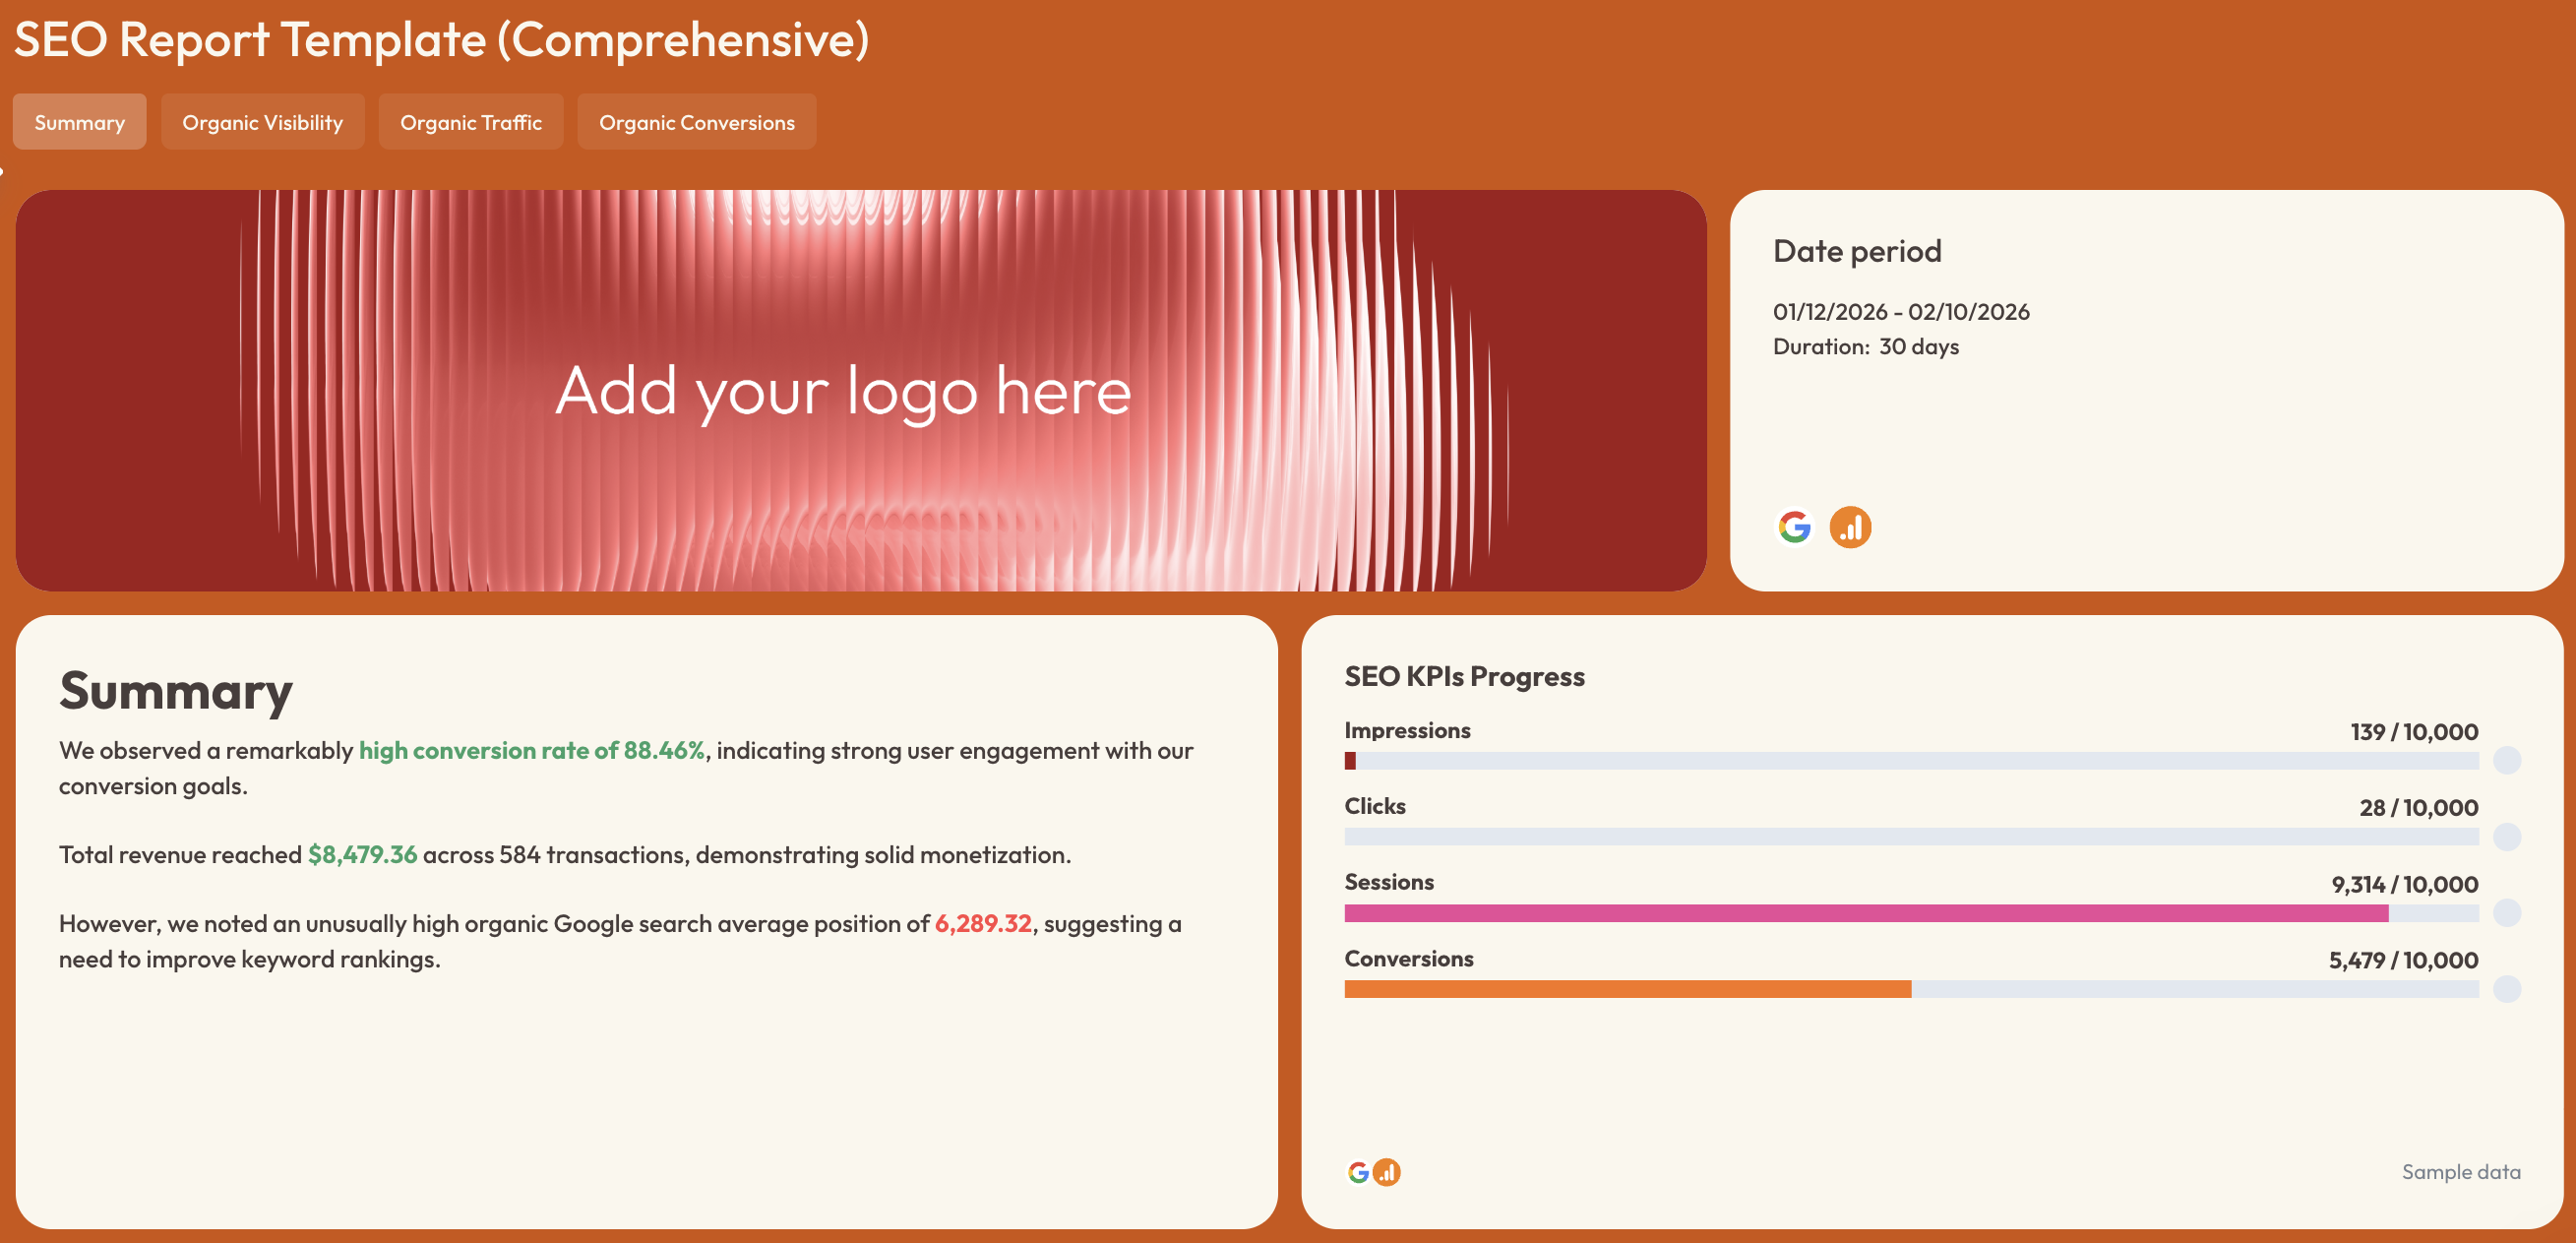 ✅ Include a goal pacing section for organic sessions, conversions, and revenue
✅ Break down branded vs non-branded queries to identify growth opportunities
 ✅ Always analyze revenue and conversions by landing page, not just traffic
✅ Include device-level performance to uncover mobile vs desktop optimization gaps
✅ Add a short recommendation section highlighting keyword gaps, ranking drops, and content opportunities
4. Social Media Report Template
 Use this template for free with your data
Who it’s for:
- Social media managers
- Content marketing teams
- Agencies reporting social media marketing performance to clients
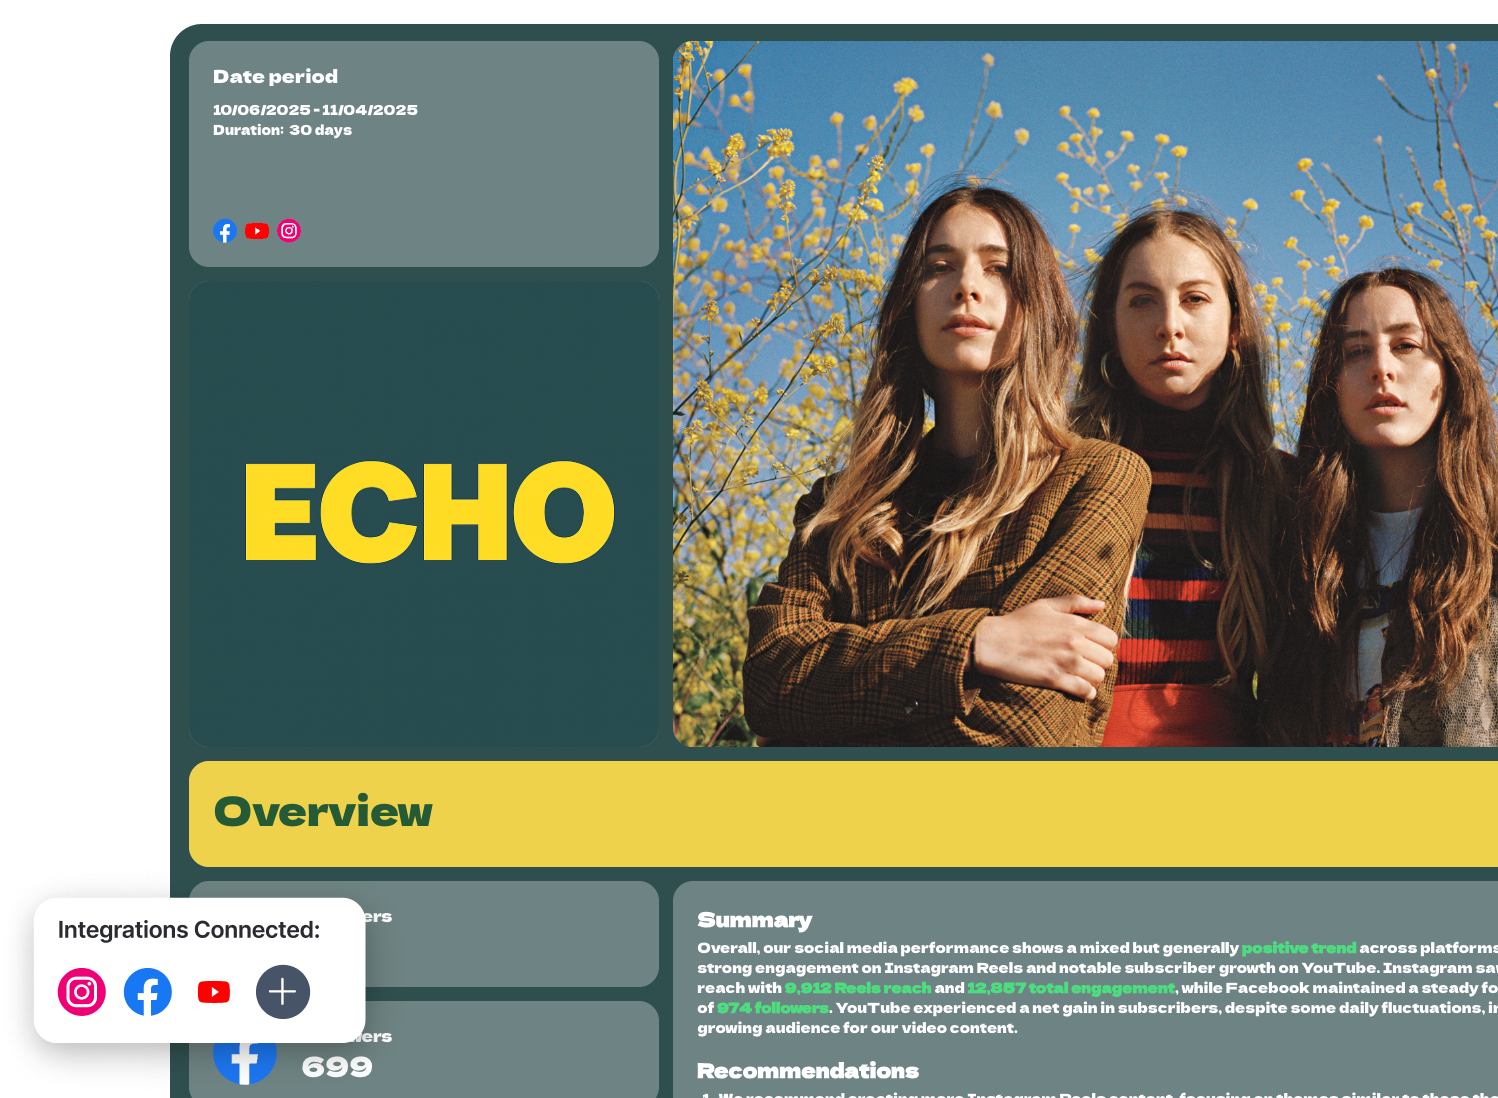
Channels connected: Instagram, Facebook, YouTube
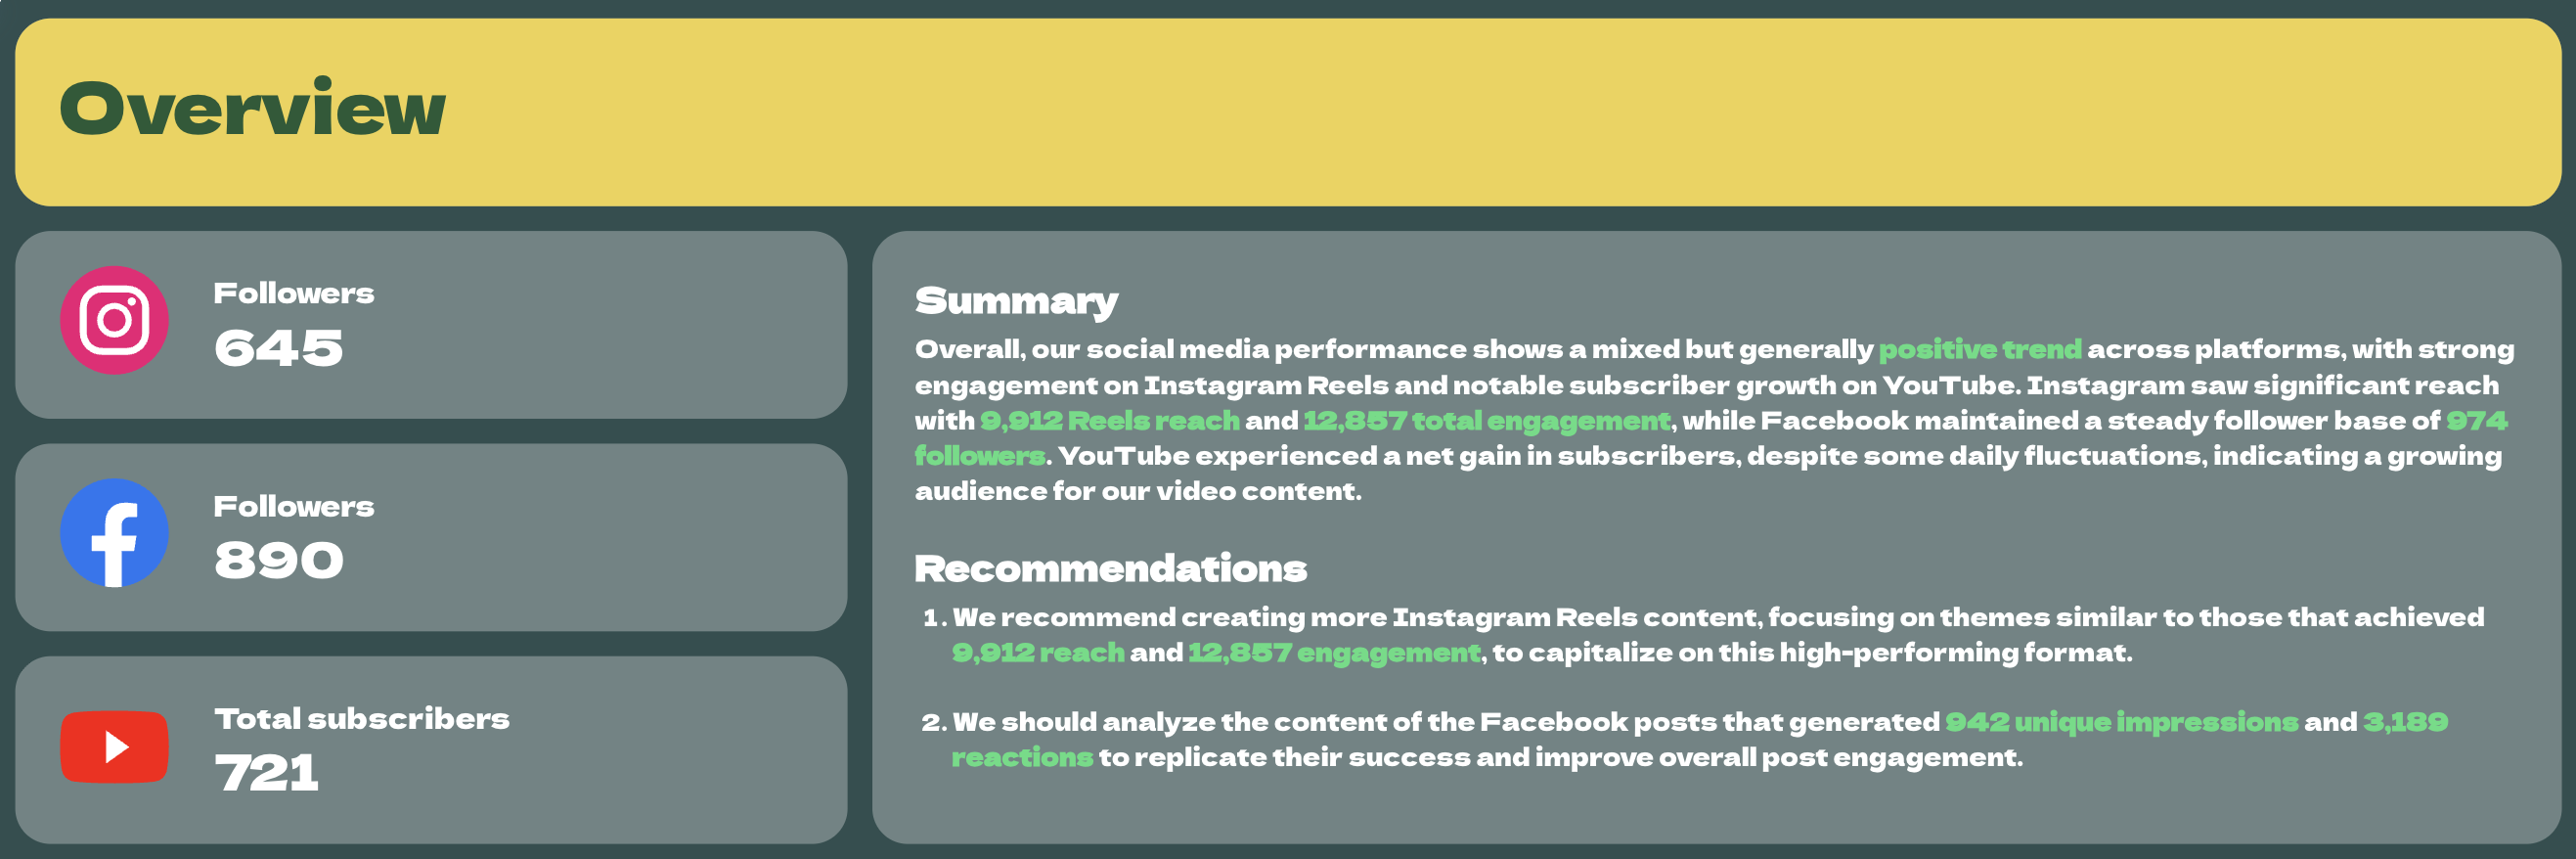
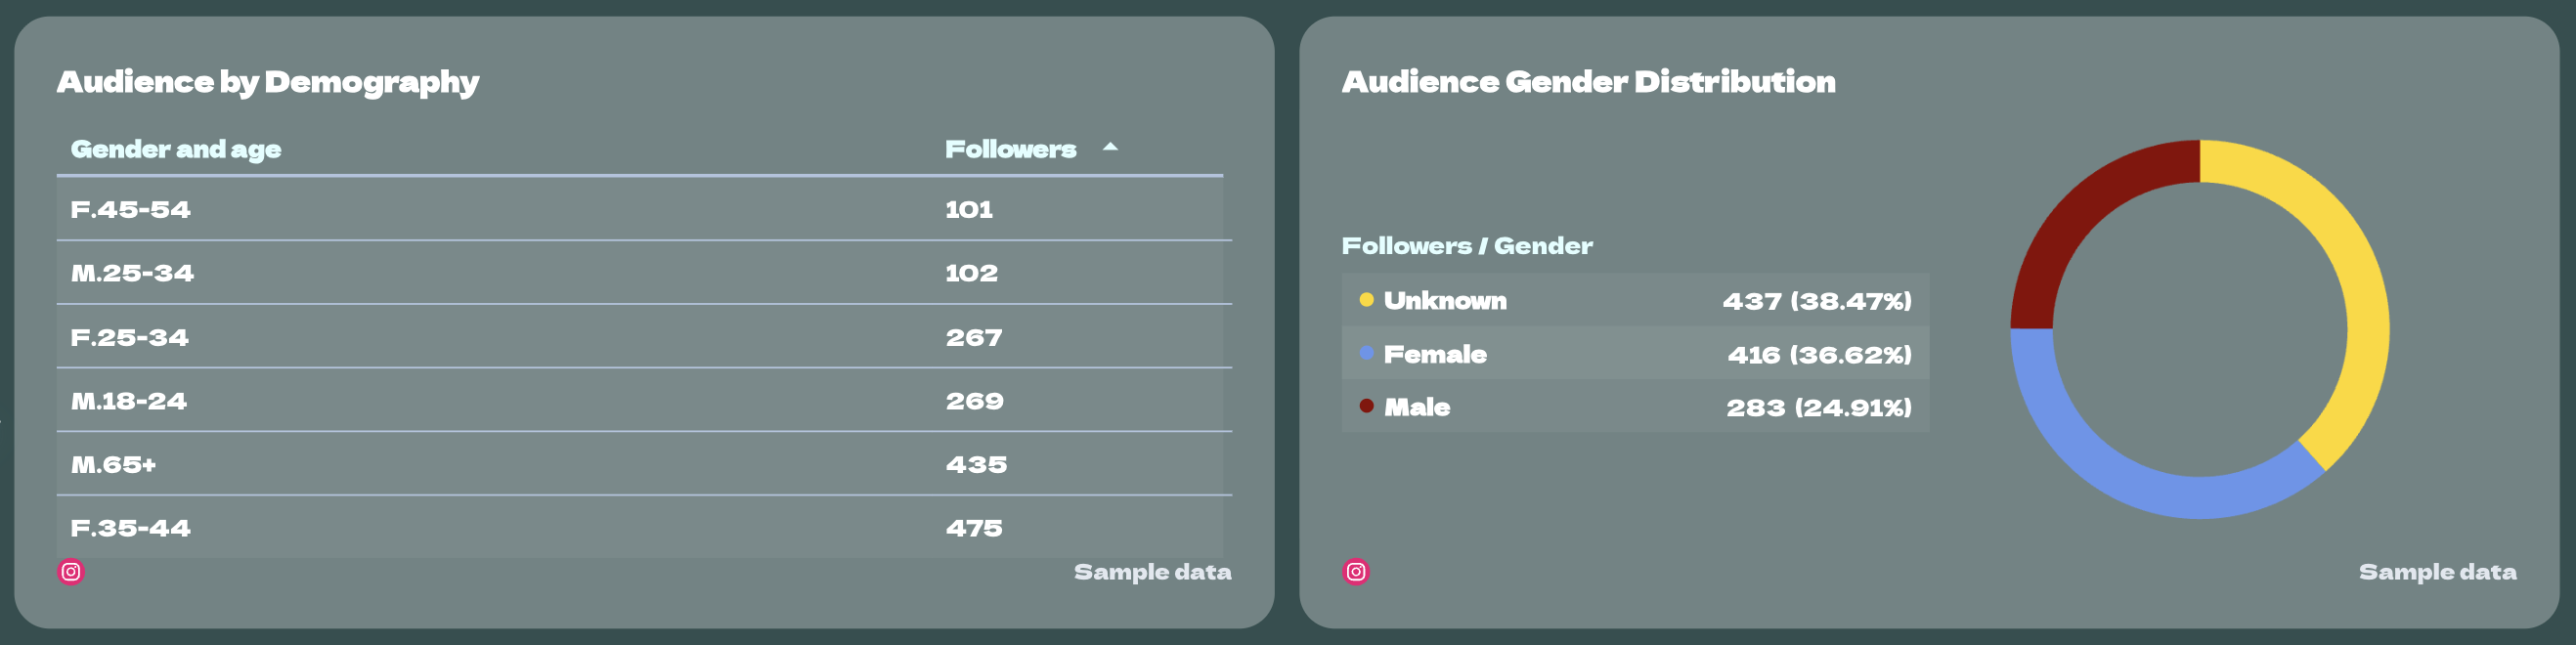
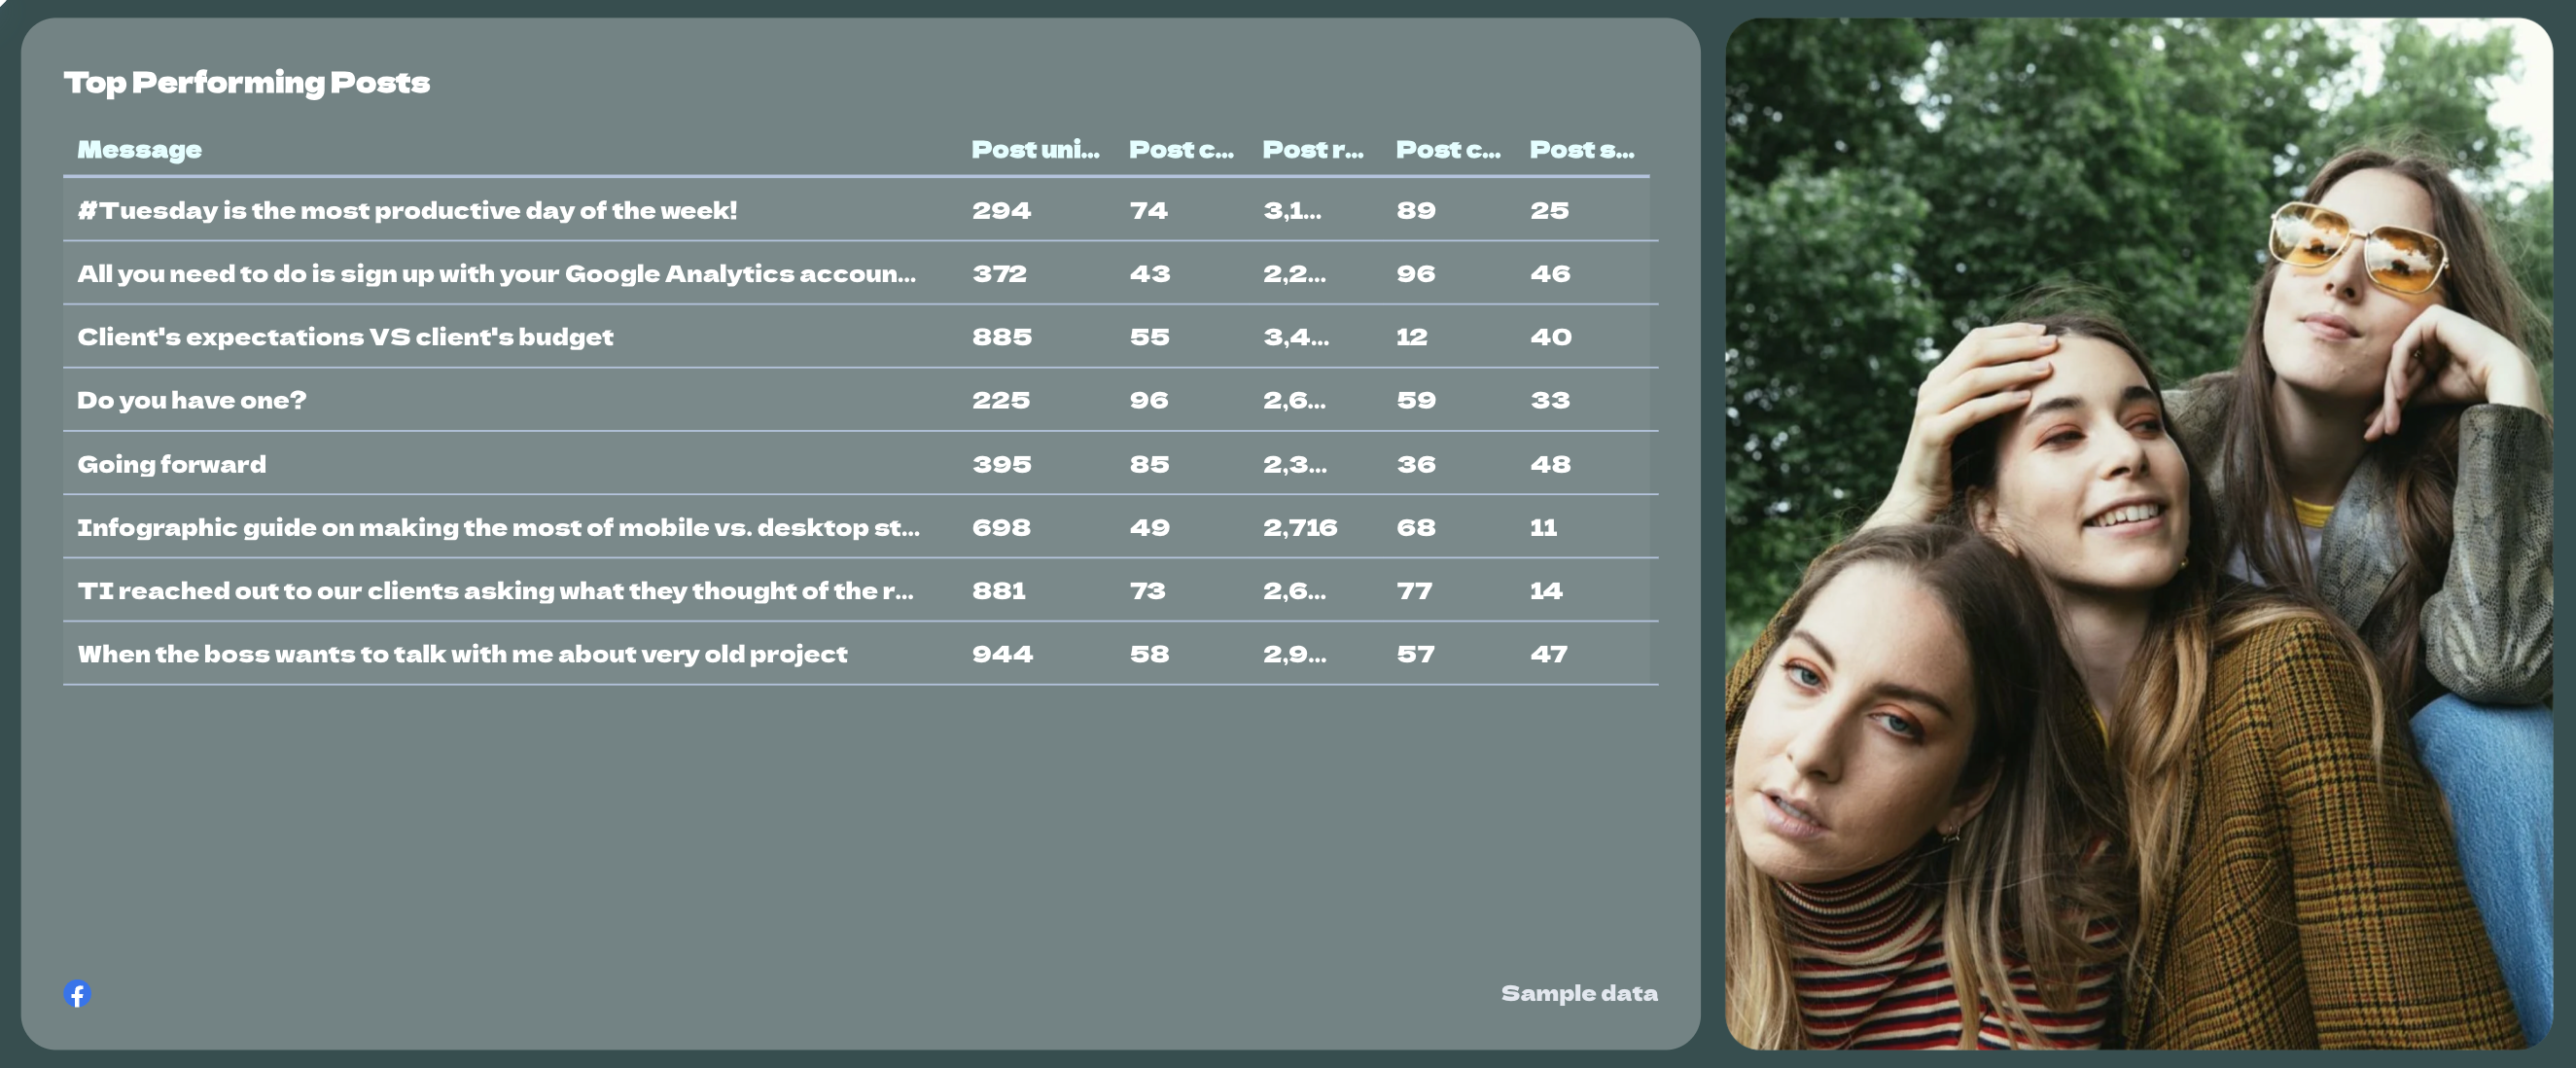
A social media report template tracks how your content performs across Instagram, Facebook, and YouTube. It connects reach, engagement, audience growth, and content performance to real marketing impact.
How to use:
Metrics to visualize:
- Total followers / subscriber growth
- New followers
- Reach
- Impressions
- Engagement and engagement rate
- Likes
- Comments
- Shares
- Saves
- Reels reach
- Stories reach
- Post engagements
- Video views
- Average view duration
- Average view percentage
- Subscribers gained / lost
- Audience demographics (age & gender)
- Top-performing posts nTop-performing videos
Best practices:
✅ Add a high-level “Social Overview” tab summarizing total reach, total engagement, and total follower growth across all platforms
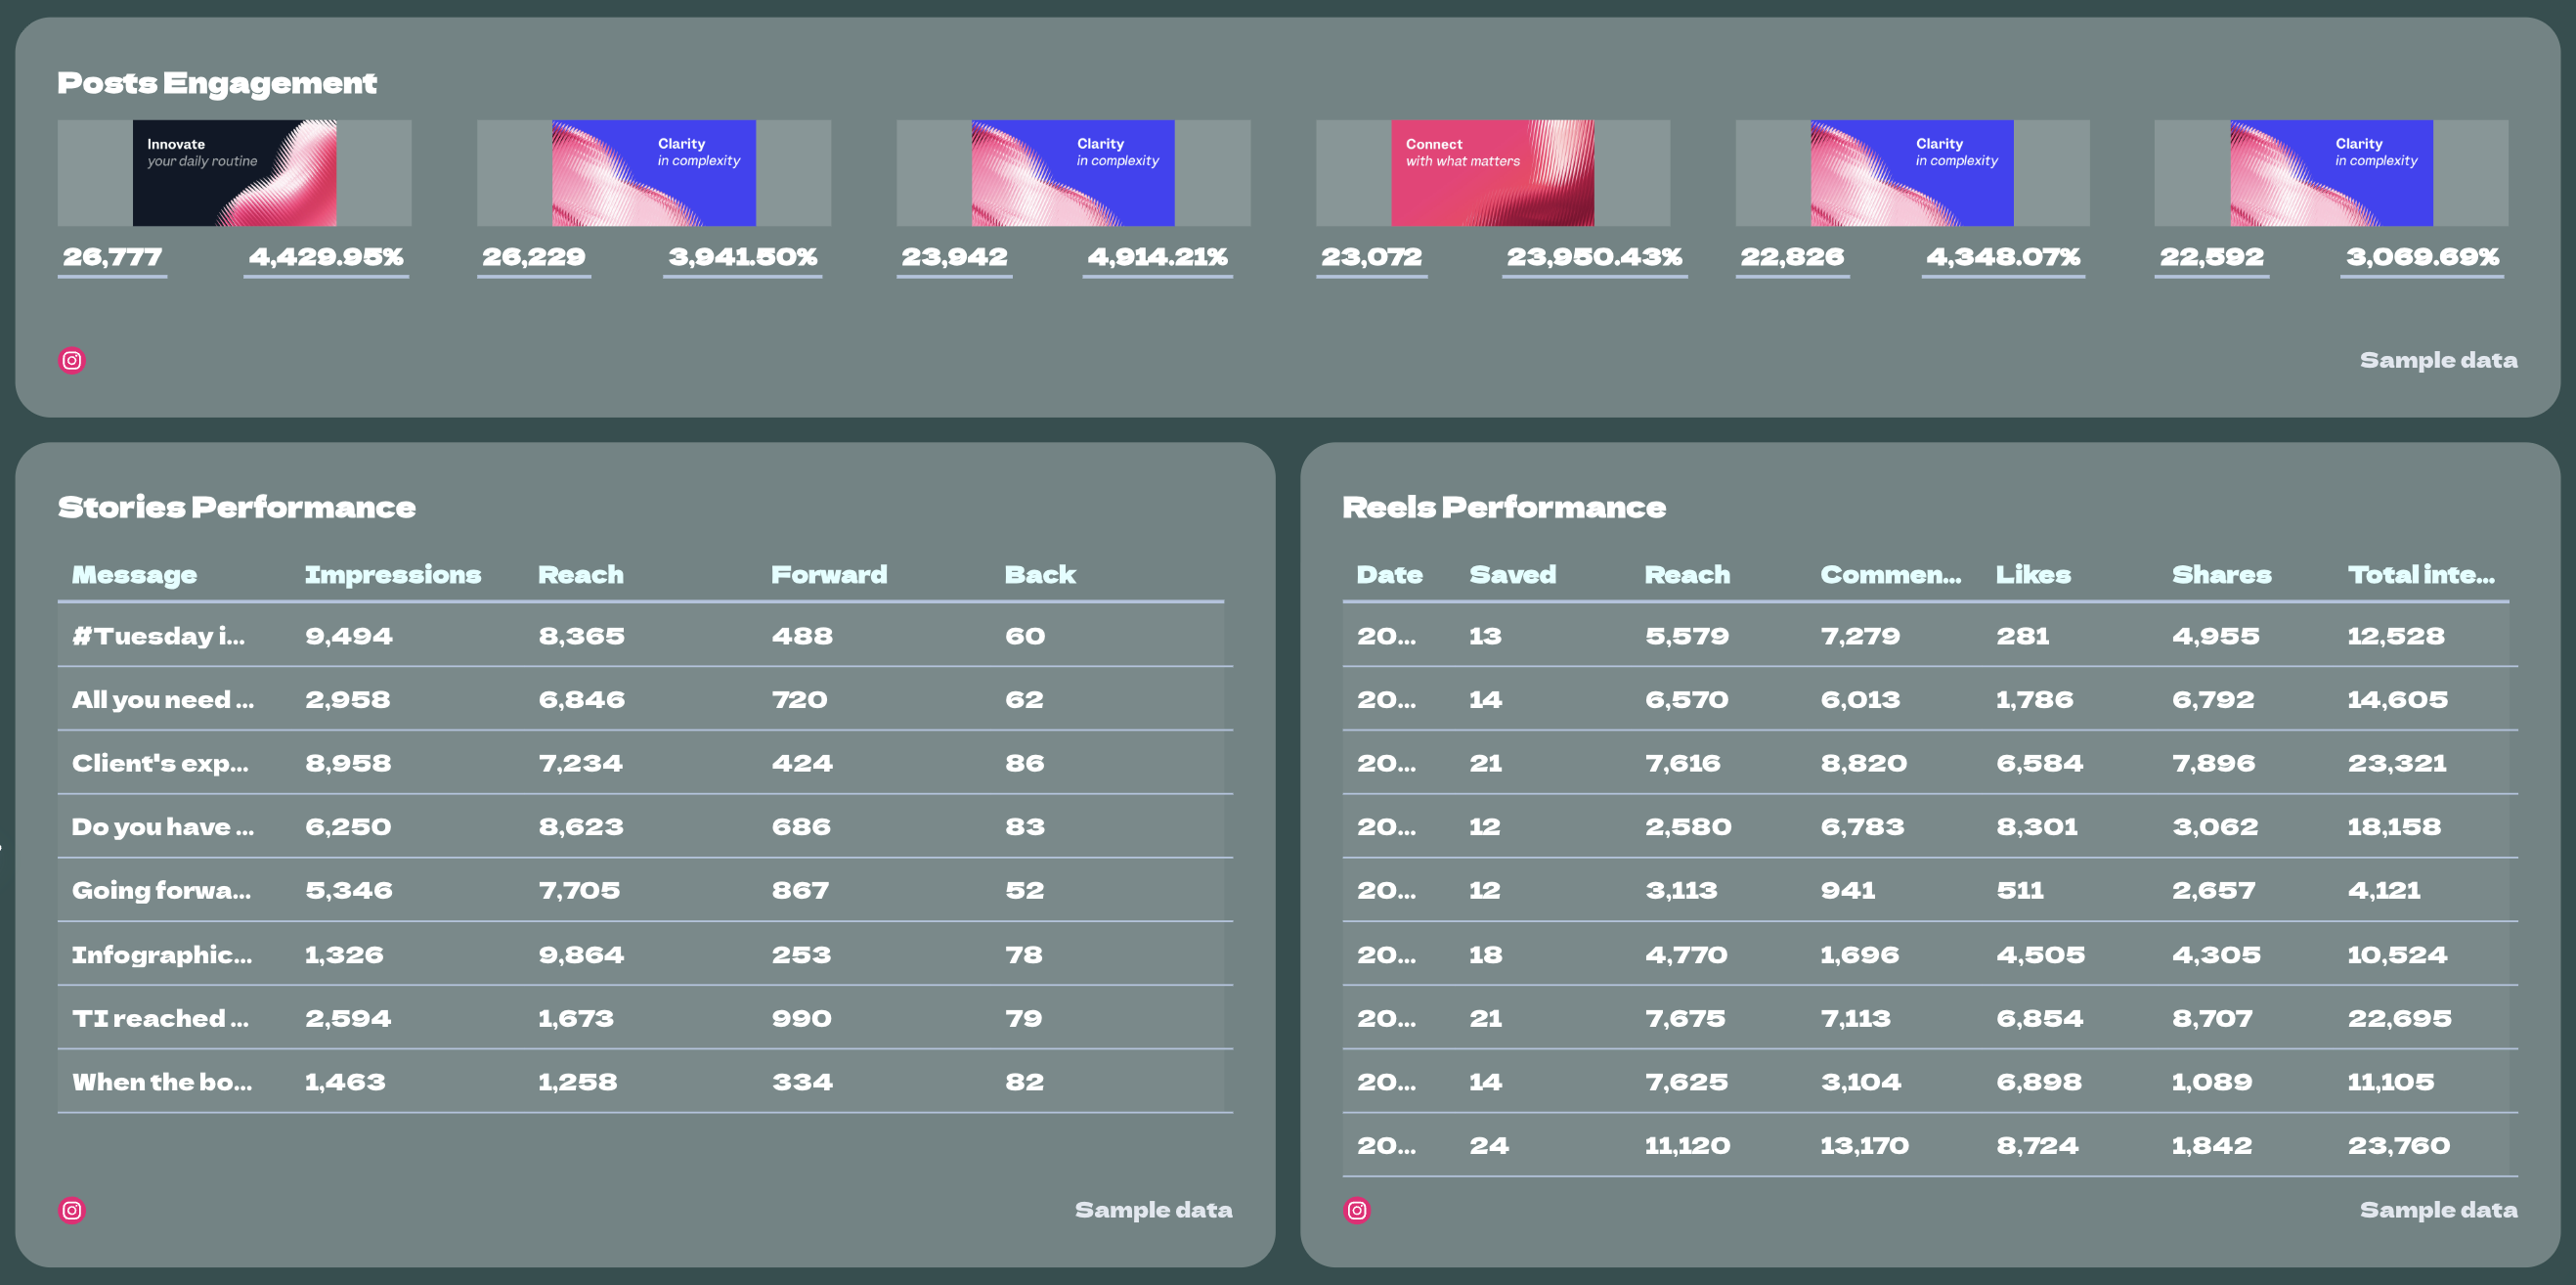
 ✅ Break down performance by content type (Reels, Stories, Posts, Videos) to identify format-level winners
 ✅ Include audience demographics to guide future content strategy
 ✅ Highlight top-performing posts and analyze why they worked (hook, format, topic, CTA)
 ✅ Always end with 3–5 concrete content recommendations for the next reporting period
5. Multichannel eCommerce Report Template
 Use this template for free with your data
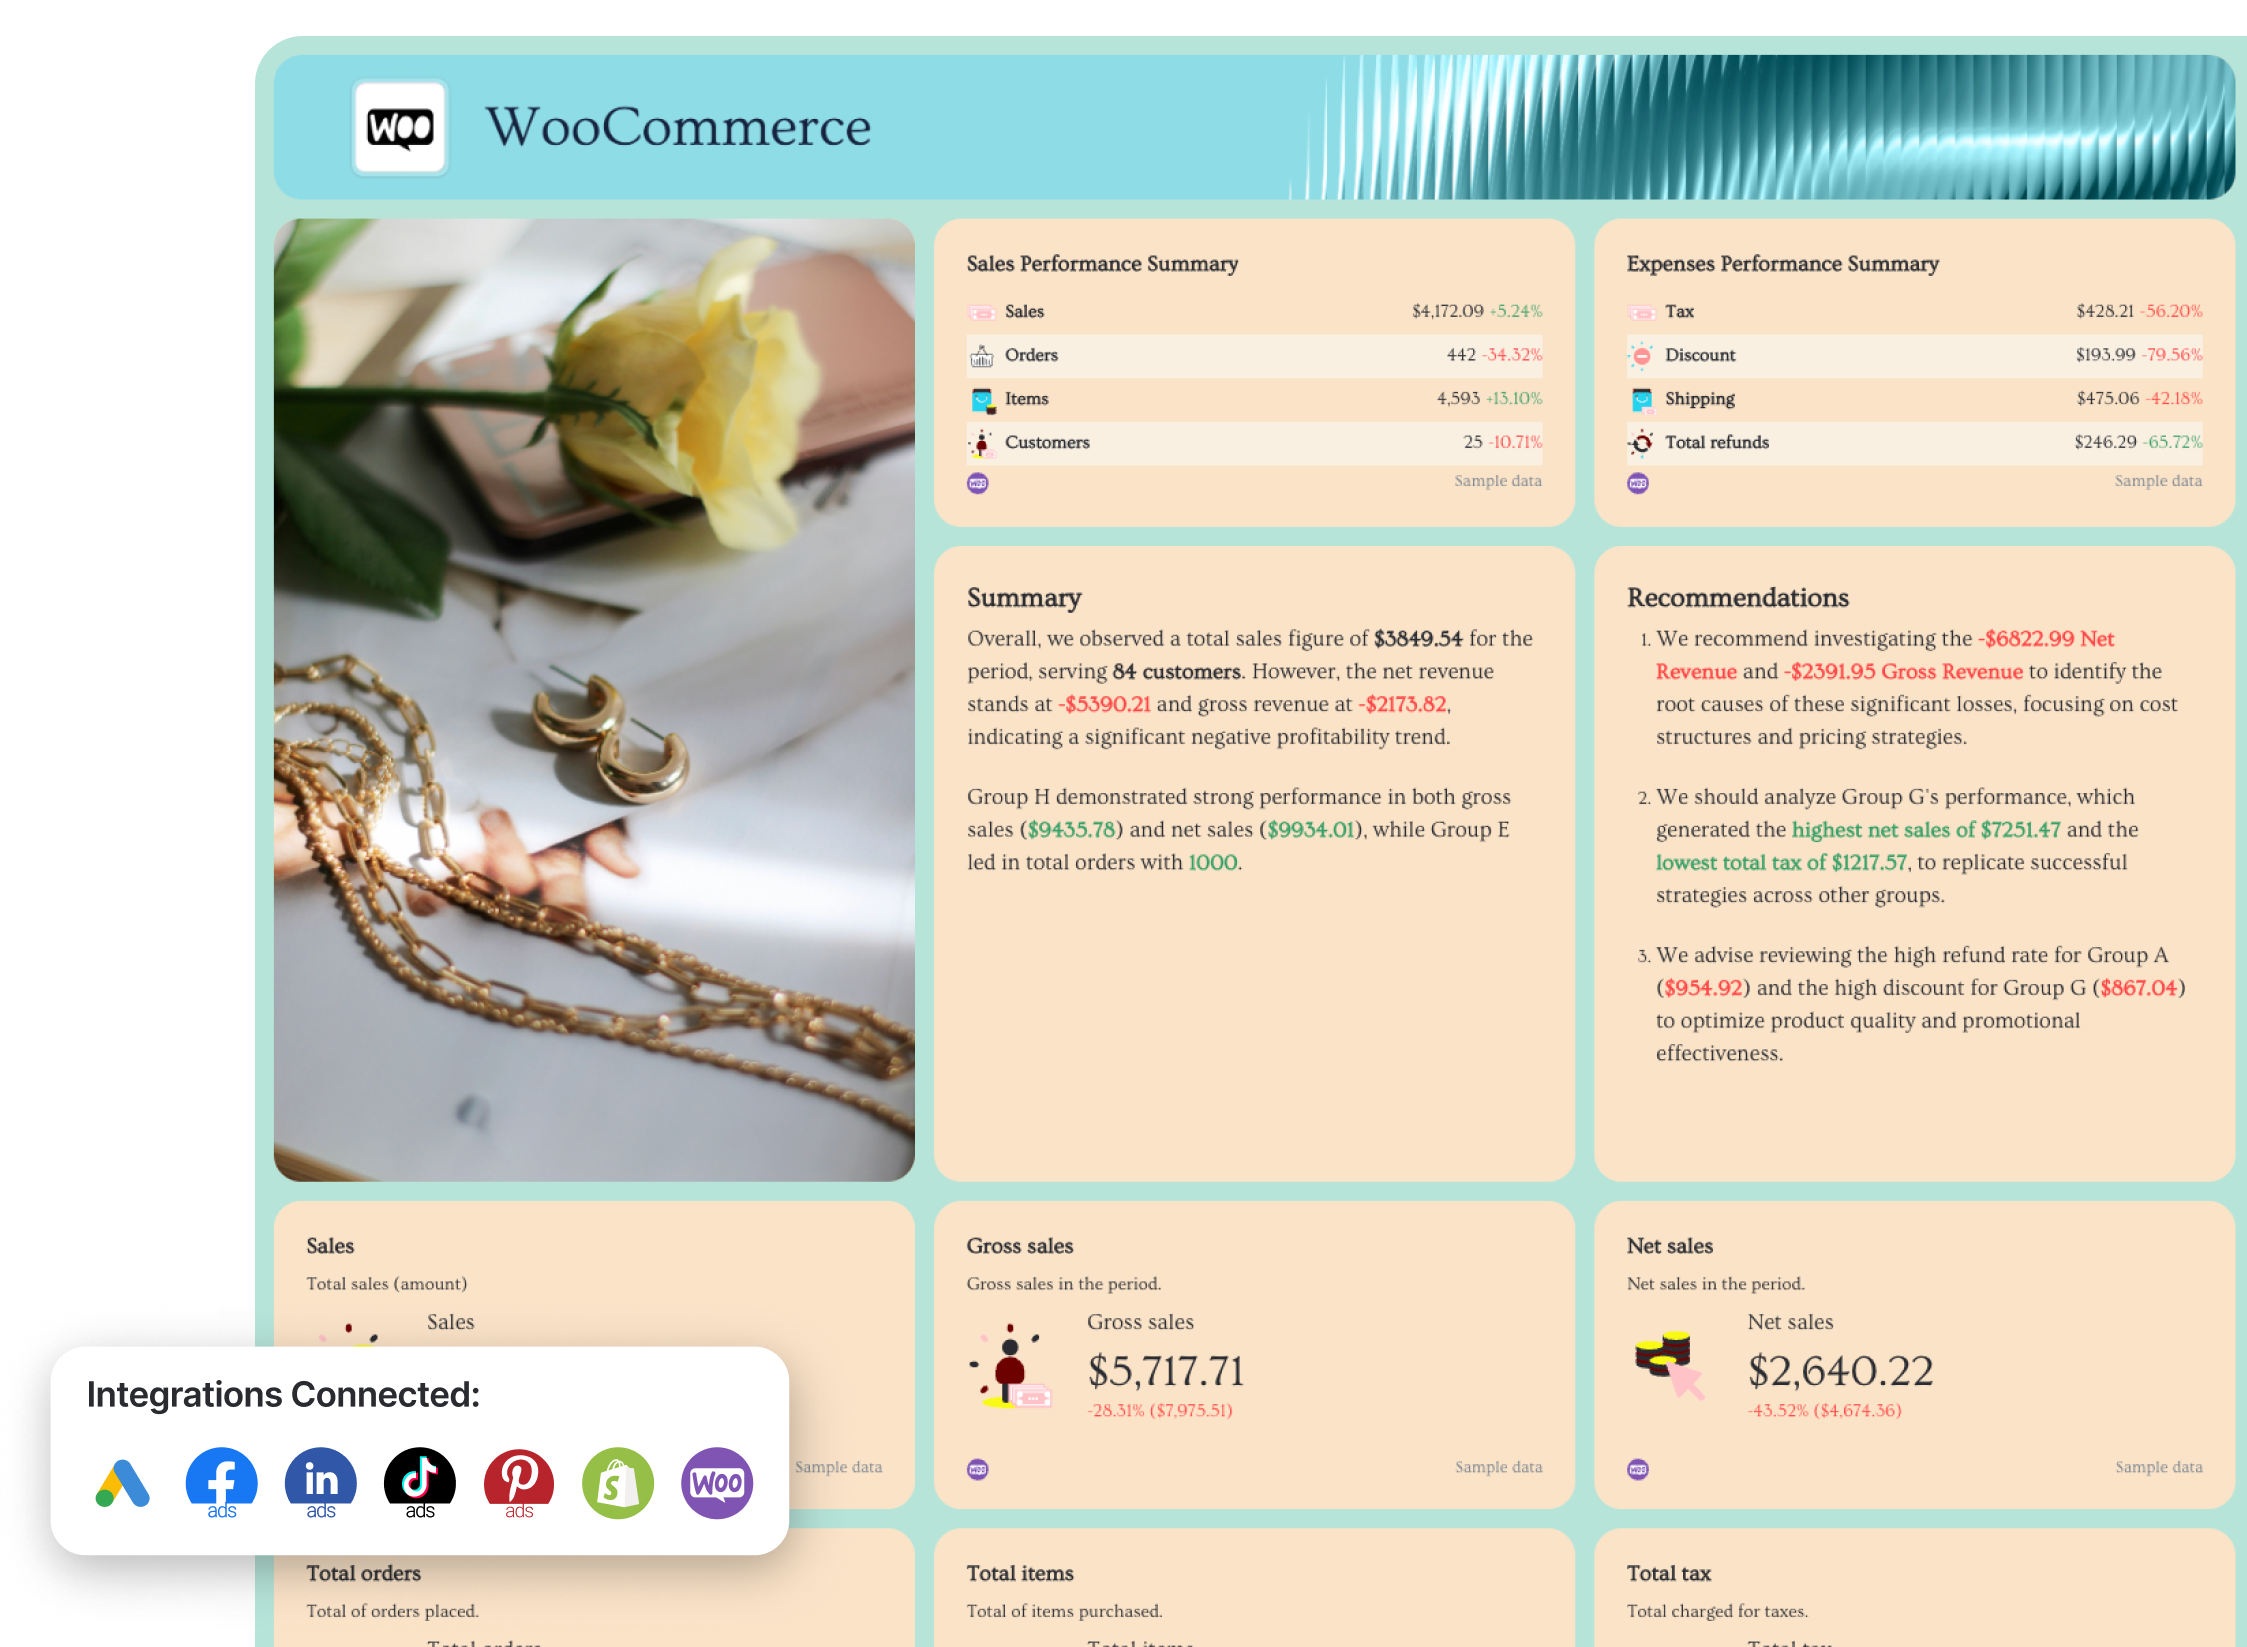
An ecommerce report template shows how your paid ads, email marketing, and store performance work together to generate revenue. It connects ad spend, transactions, average order value, refunds, and conversion rate into one unified performance report.
Who it’s for:
- Ecommerce marketing managers
- DTC brands running multi-channel campaigns
- Agencies managing paid + store performance for ecommerce clients
Channels connected: Google Ads, Facebook Ads, LinkedIn Ads, TikTok Ads, Pinterest Ads, Shopify, WooCommerce
How to use:
Metrics to visualize:
Cross-channel overview
- Total ad spend
- Total revenue
- ROAS by channel
- Conversions by channel
- Spend by channel
- Cost per acquisition
- Cross-channel conversion rate
Google Ads
- Spend
- All conversions
- Cost per conversion
- ROAS
- Revenue
- Average order value
Facebook Ads
- Impressions
- Clicks
- CTR
- CPC
- Offsite conversions
- Spend vs goal pacing
LinkedIn / TikTok / Pinterest Ads
- Audience penetration
- Spend
- Post-click conversions
- Cost per lead / result
- Conversion rate
- Complete payment ROAS
Store performance (Shopify / WooCommerce)
- Gross sales
- Net sales
- Orders
- Items sold
- Customers
- Average order value
- Refunds
- Discounts
- Taxes
- Shipping
- Ecommerce conversion rate
Best practices:
✅ Start with an “Overview” summary page where you visualize key metrics and goal trends for all your eCommerce channels (e.g. Google Ads, Shopify, Pinterest Ads) in one place
 ✅ Separate acquisition (Ads) and store performance (Shopify/WooCommerce) into dedicated sections
✅ Show conversions and spend by eCommerce channel trends over the last 12 months to visualize budget allocation impact
 ✅ Add custom images of your products and style the report in your (or your client’s) brand colors and font
 ✅ End with profitability insights (e.g., high-spend channels with low ROAS, high-refund products, underperforming audiences)
6. Google Ads Report Template
 Use this template for free with your data
Who it’s for:
- PPC specialists managing Google Ads accounts
- Agencies delivering client-facing paid search reports
- Marketing teams optimizing budget allocation and ROAS
Channels connected: Google Ads, Google Analytics 4 for landing page and conversion validation (optional)
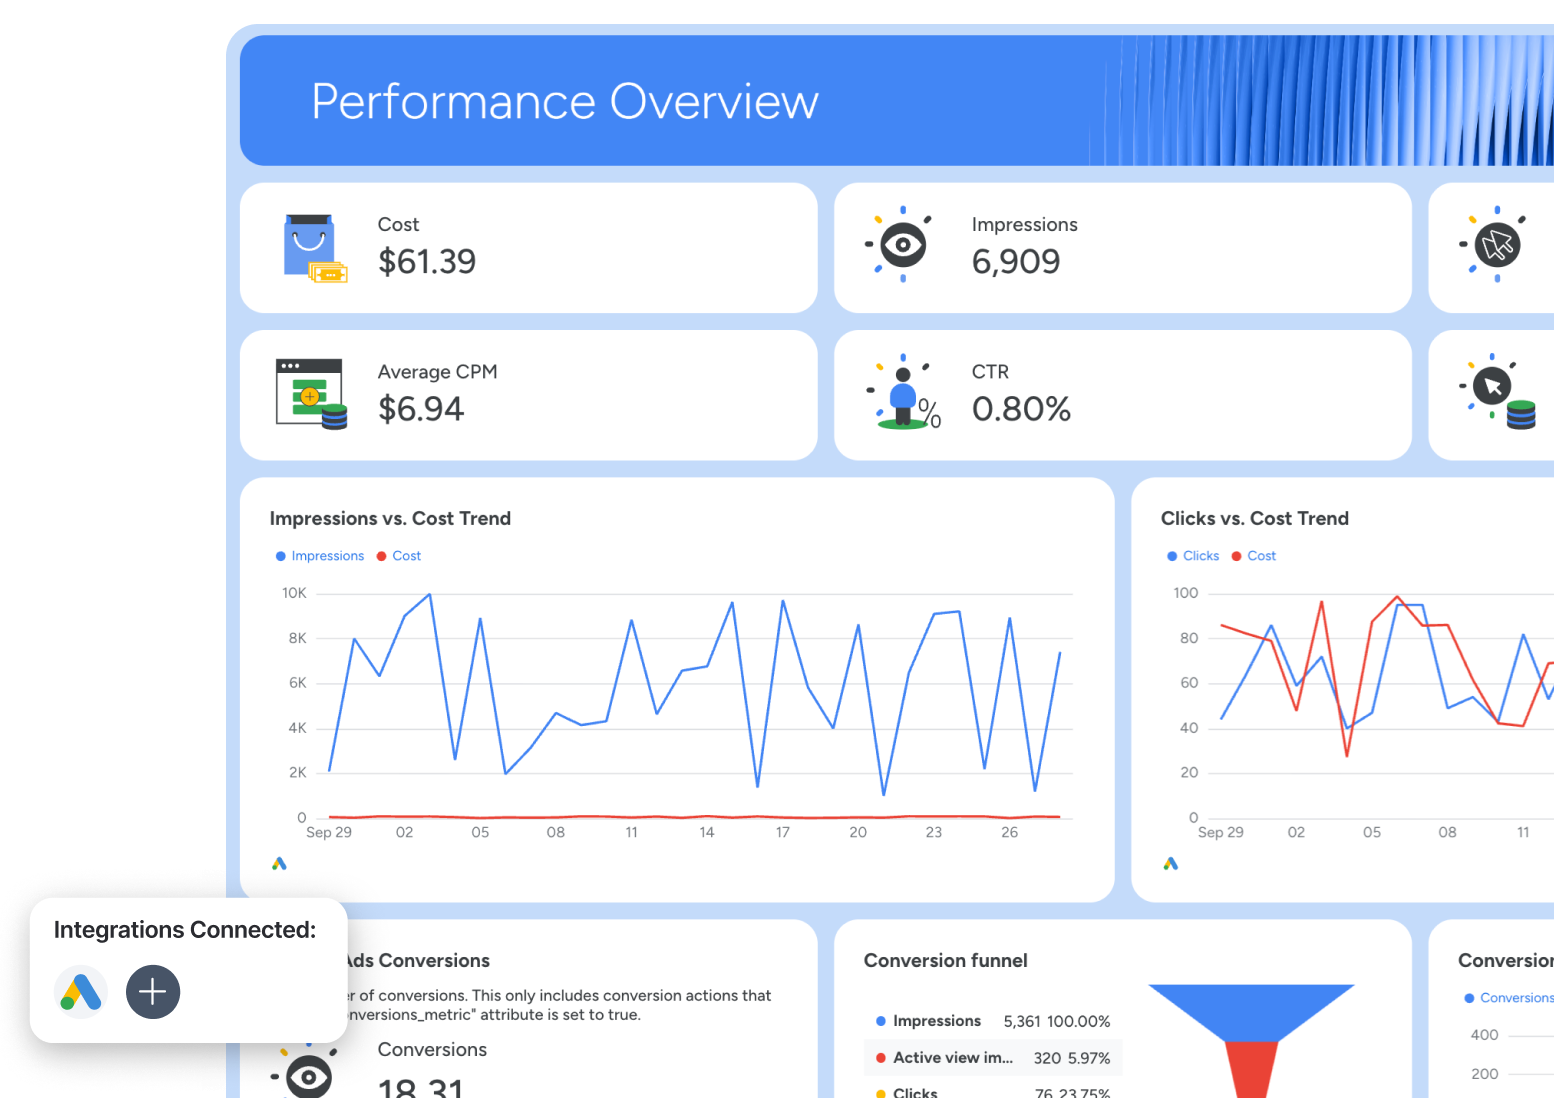
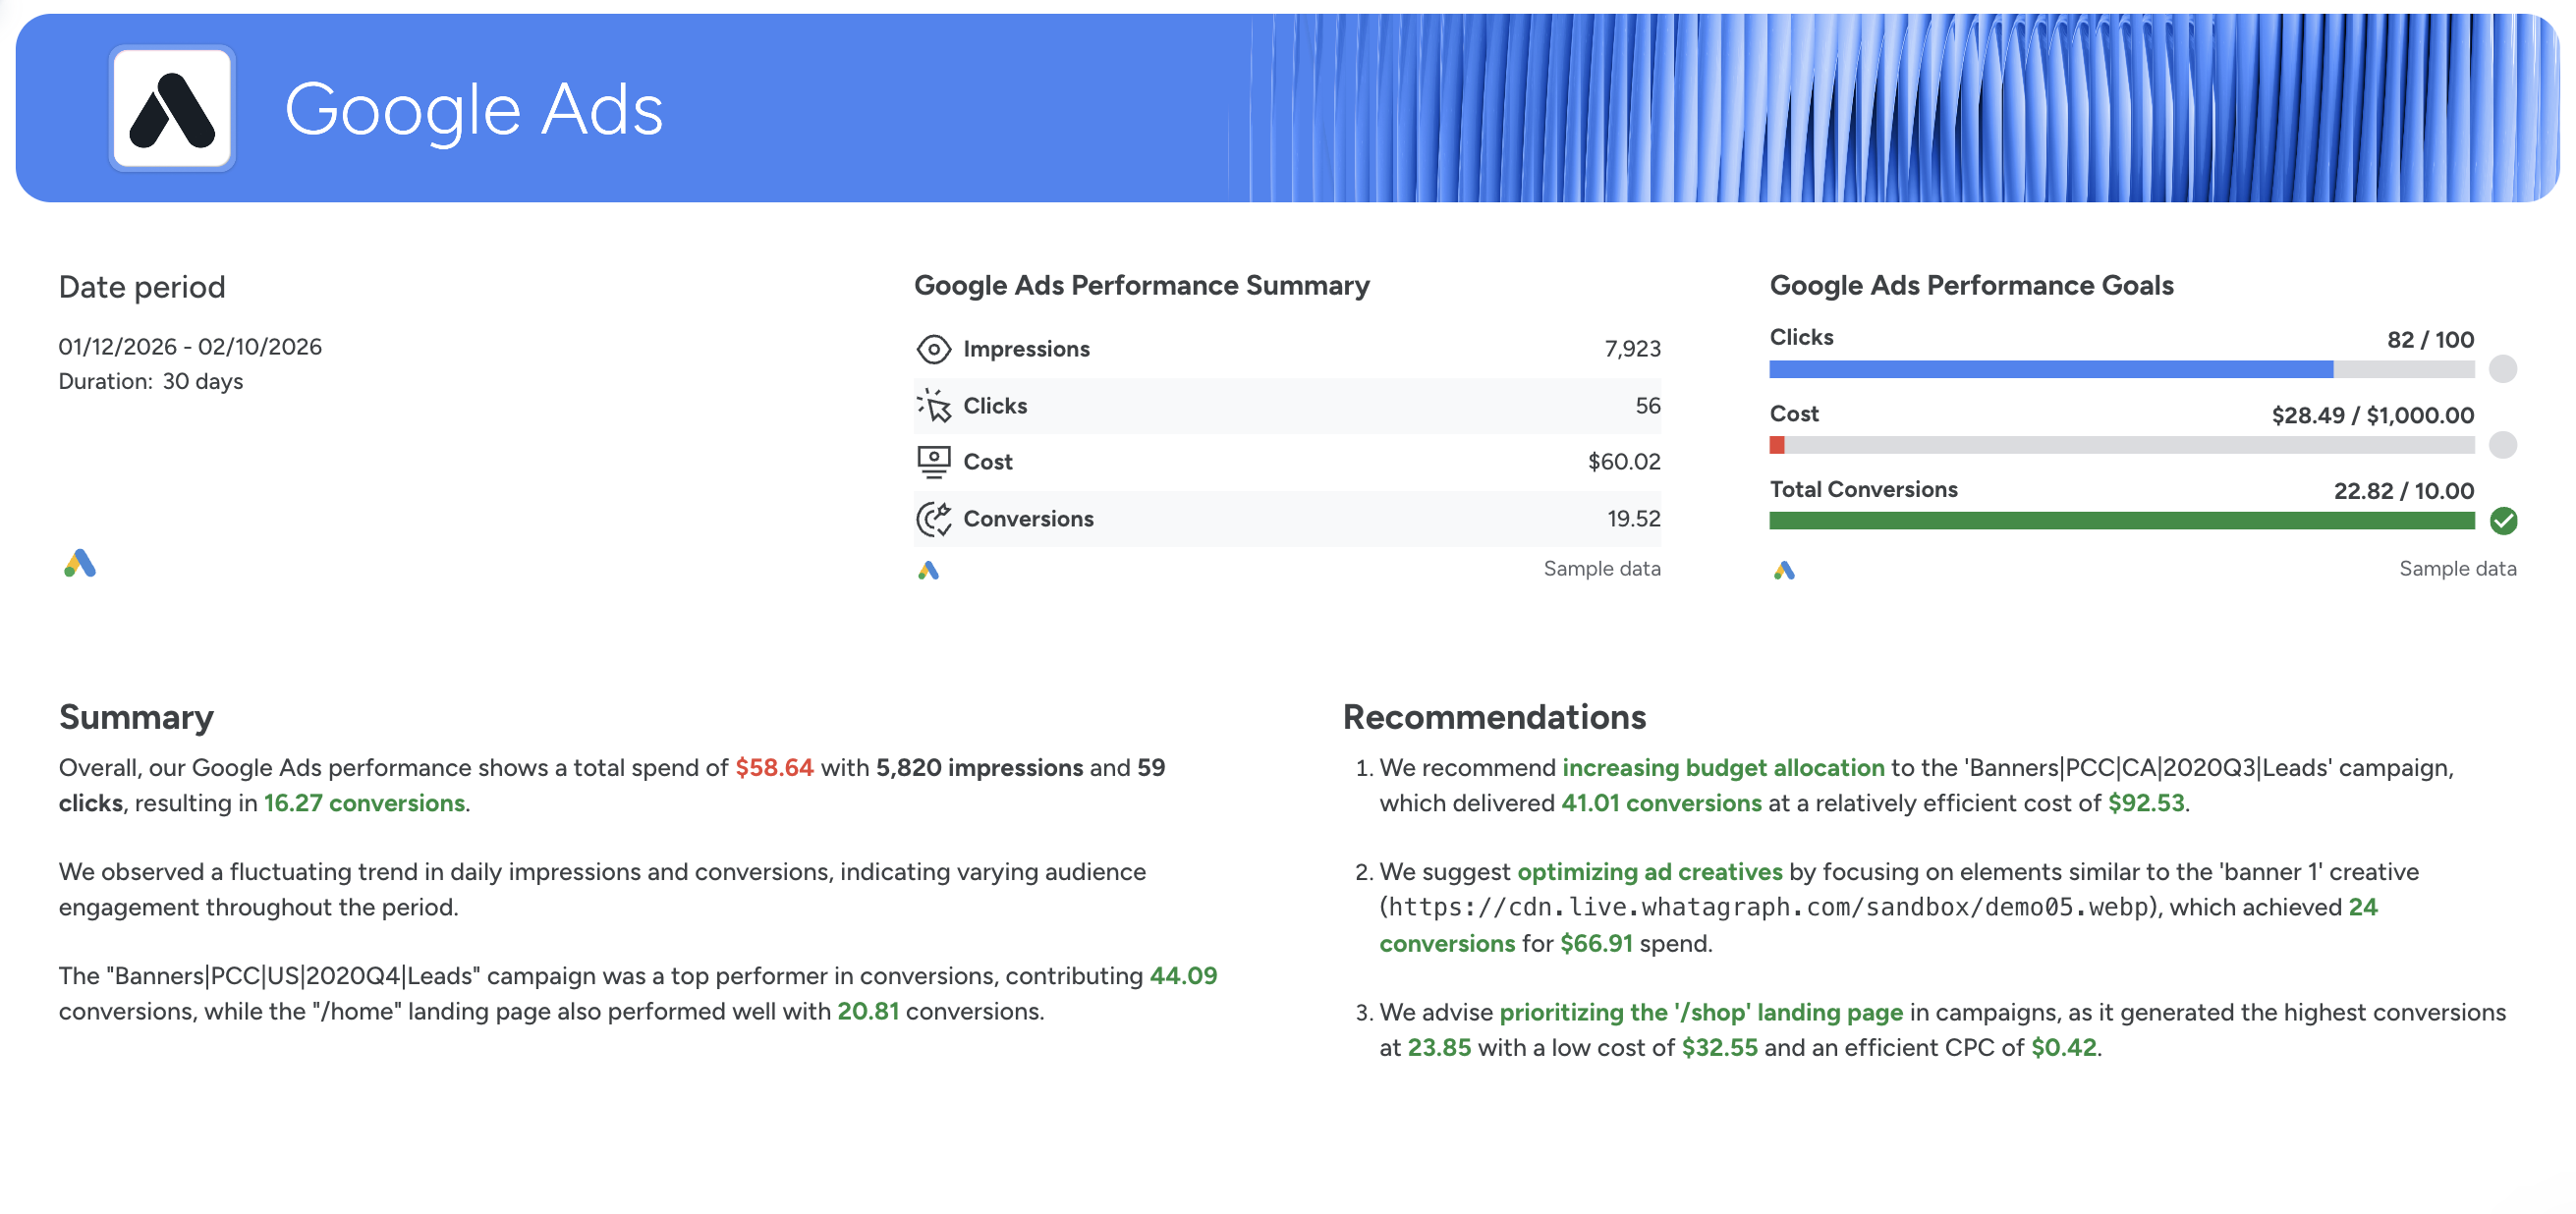
A Google Ads report template shows exactly how your ad spend turns into clicks, conversions, and revenue. It breaks down campaign, keyword, landing page, and creative performance so you know where to scale, and where to cut.
How to use:
Metrics to visualize:
- Impressions
- Clicks
- Cost
- Conversions and Conversion rate
- CTR (click-through rate)
- Average CPC
- Average CPM
- Cost per conversion
- Ad network performance (Search vs Display)
- Ad creative performance
- Ad format performance
- Keyword performance
- Landing page performance
Best practices:
✅ Start with a Google Ads Performance Summary showing total impressions, clicks, cost, and conversions
✅ Add a goal pacing section (Clicks vs Goal, Cost vs Budget, Conversions vs Target) at the top of the report
 ✅ Break performance down into clear sections: Campaign → Ad Network → Ad Creative → Keyword → Landing Page
✅ Include a funnel view to quickly spot drop-offs between impressions, clicks, and conversions
✅ Highlight top-performing campaigns and creatives with clear scaling recommendations
7. Email Marketing Report Template
 Use this template for free with your data
Who it’s for:
- Email marketing managers
- CRM and lifecycle marketing teams
- Agencies reporting email campaign performance to clients
Channels connected: Google Analytics 4, HubSpot, Mailchimp, ActiveCampaign
An email marketing report template shows how your email campaigns drive engagement, deals, and revenue. It connects opens, clicks, replies, and conversions to real business impact.
How to use:
Metrics to visualize:
- Contact count
- List growth rate
- Total emails sent
- Opens and open rate
- Link clicks
- Click-through rate
- Unsubscribes and unsubscribe rate
- Replies
- Deals count and deals value
- Email revenue
- Ecommerce conversion rate
- Transactions
- Average order value
- Refunds
Best practices:
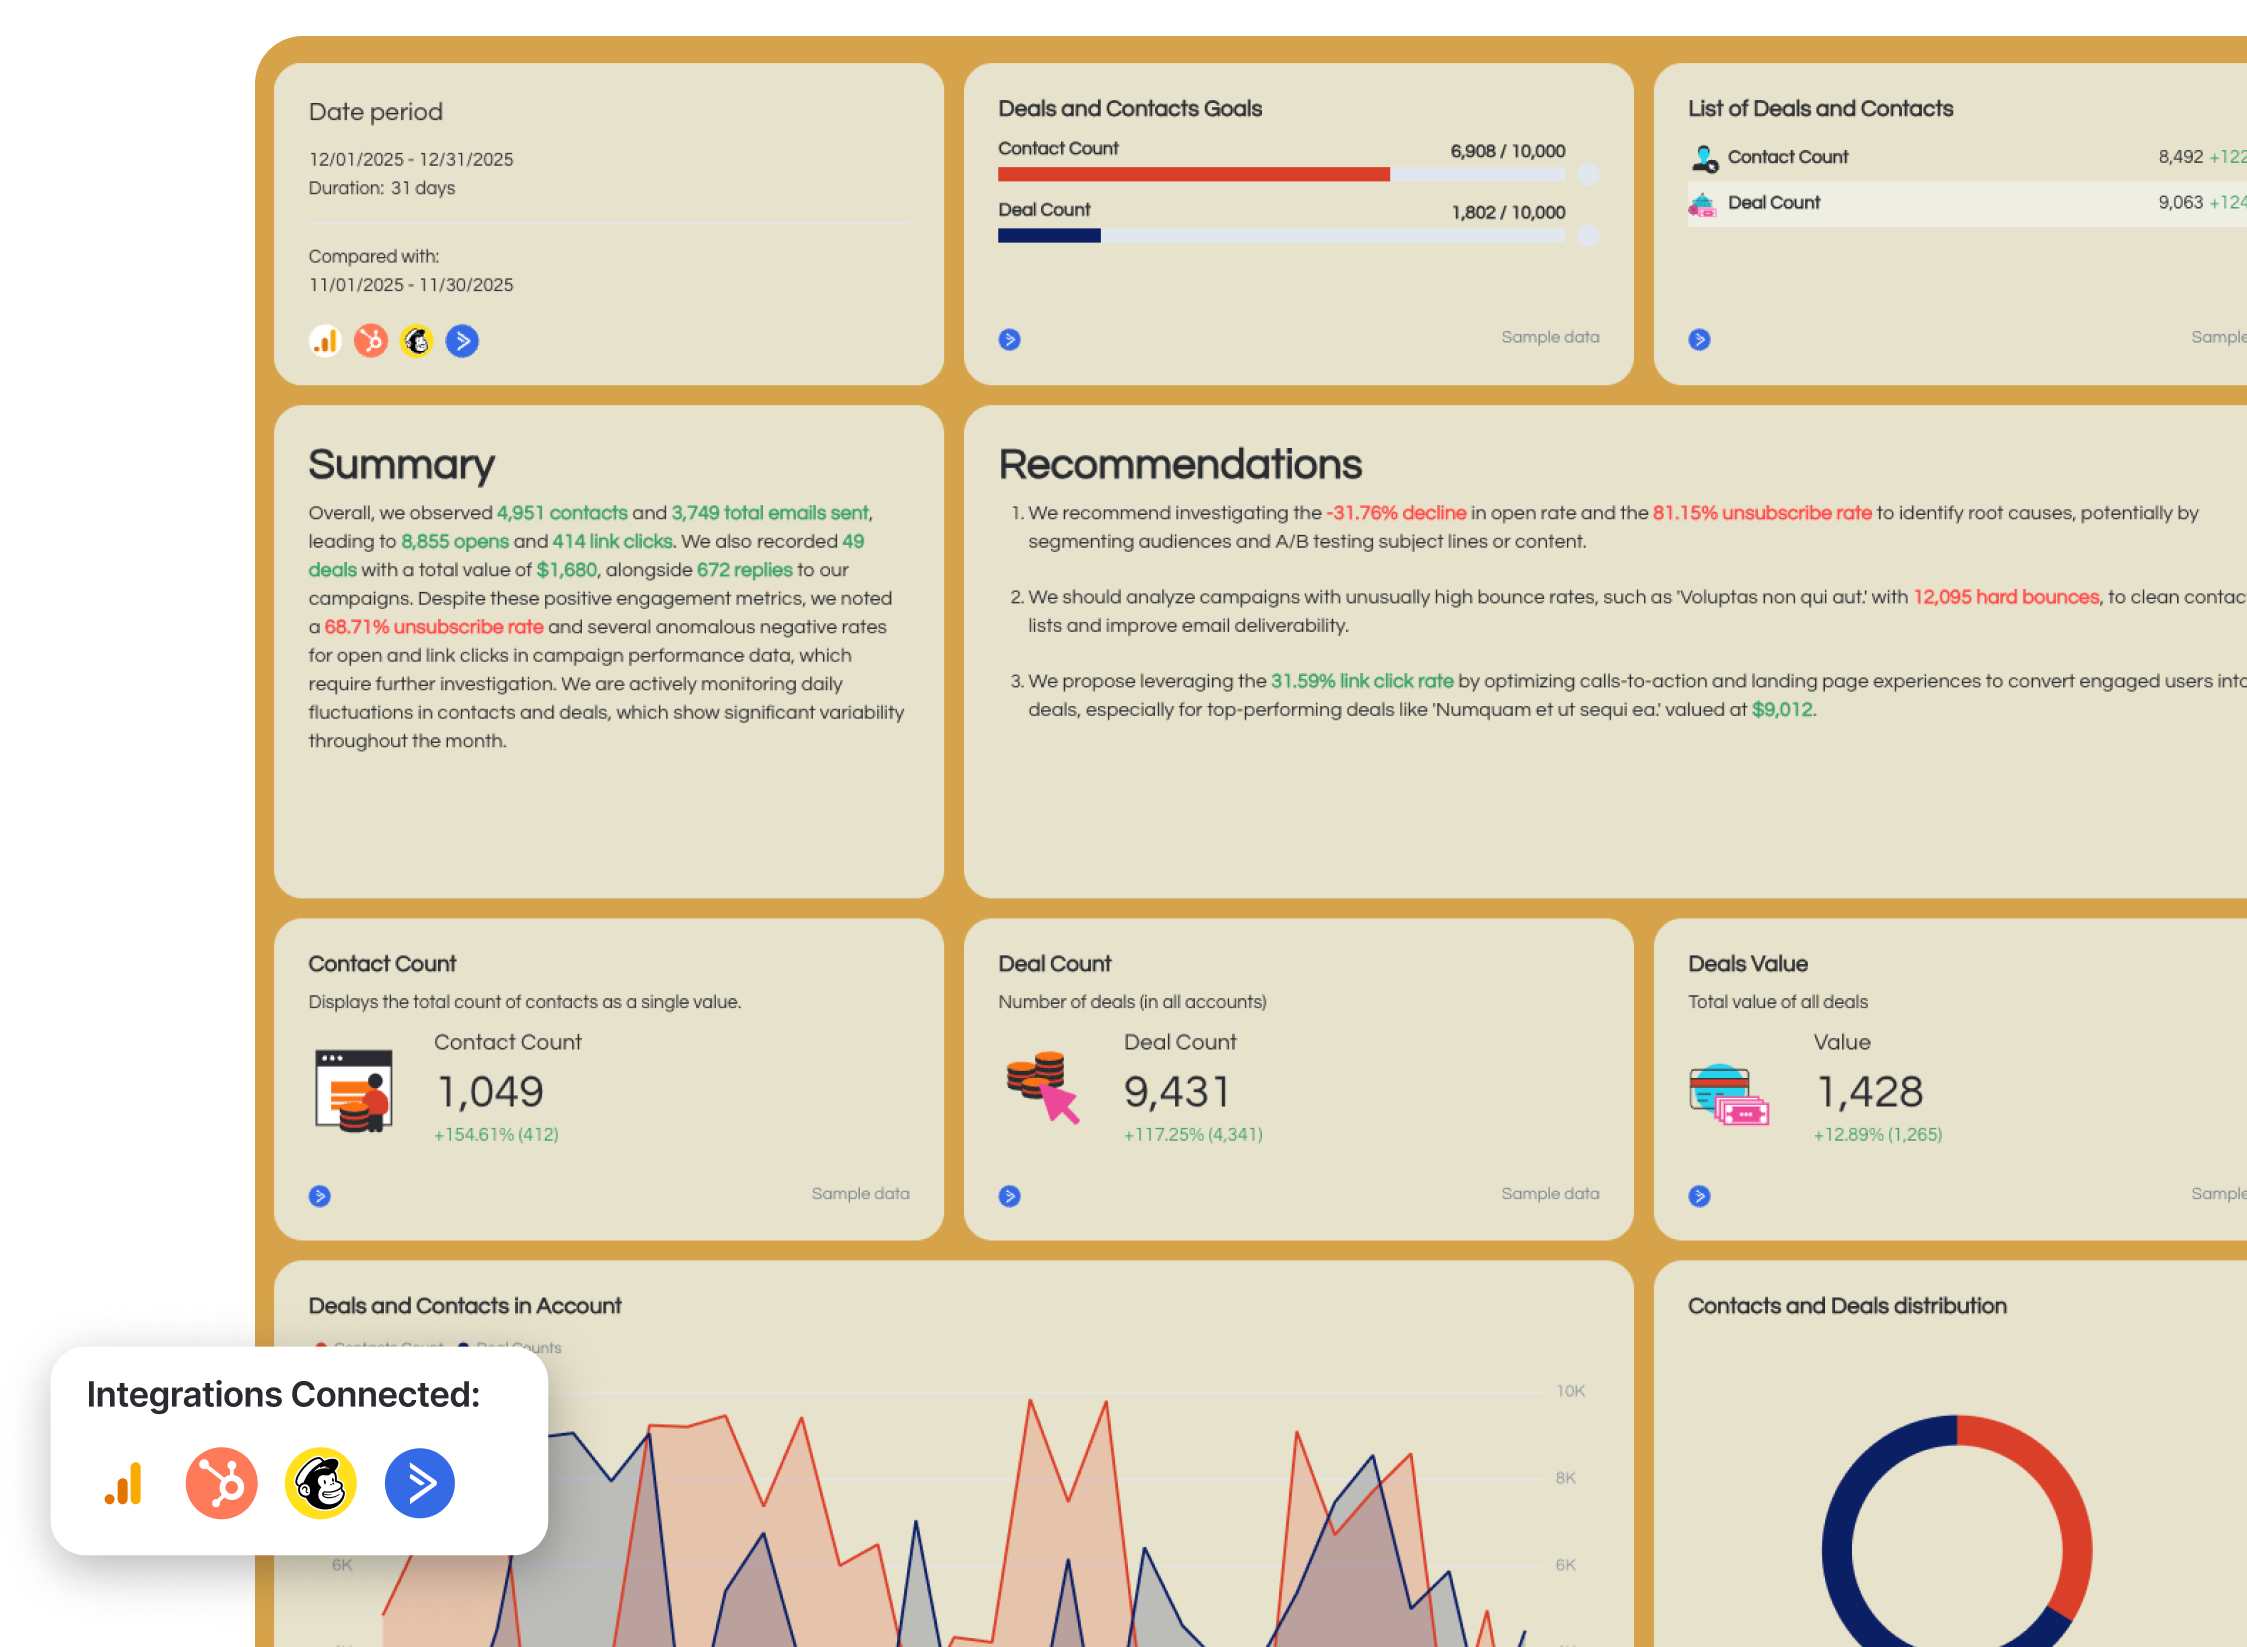
✅ Start with an executive summary showing total emails sent, total opens, total clicks, deals, and revenue
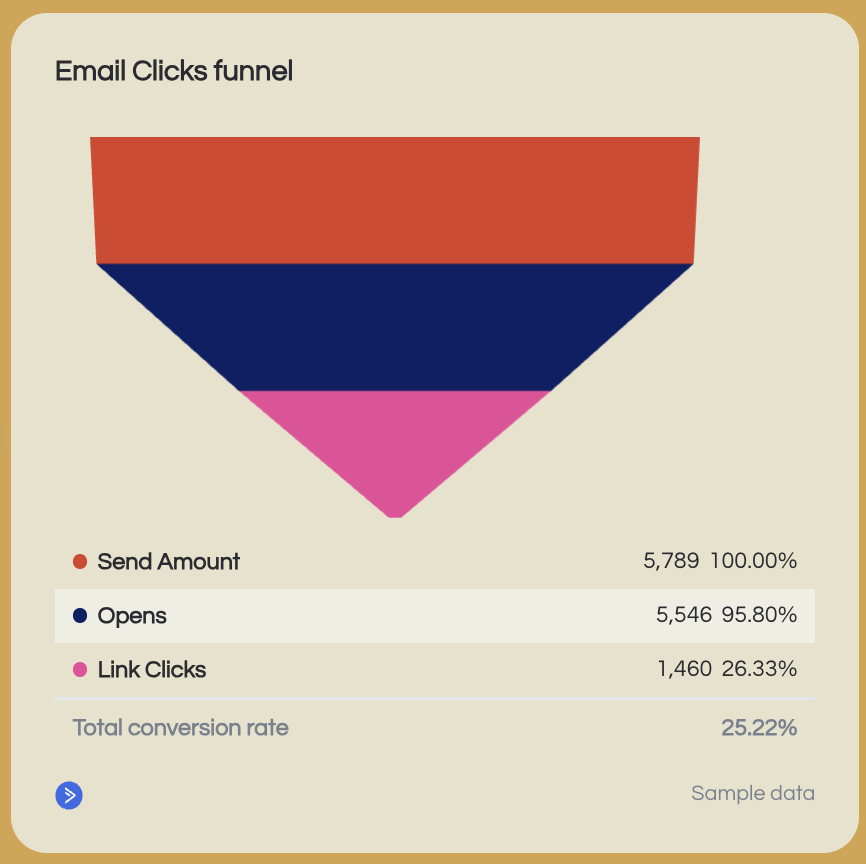
✅ Include a funnel view (Sent → Opens → Clicks → Conversions) to quickly identify engagement drop-offs
✅ Separate lifecycle emails (nurture, newsletter) from promotional campaigns to analyze performance properly
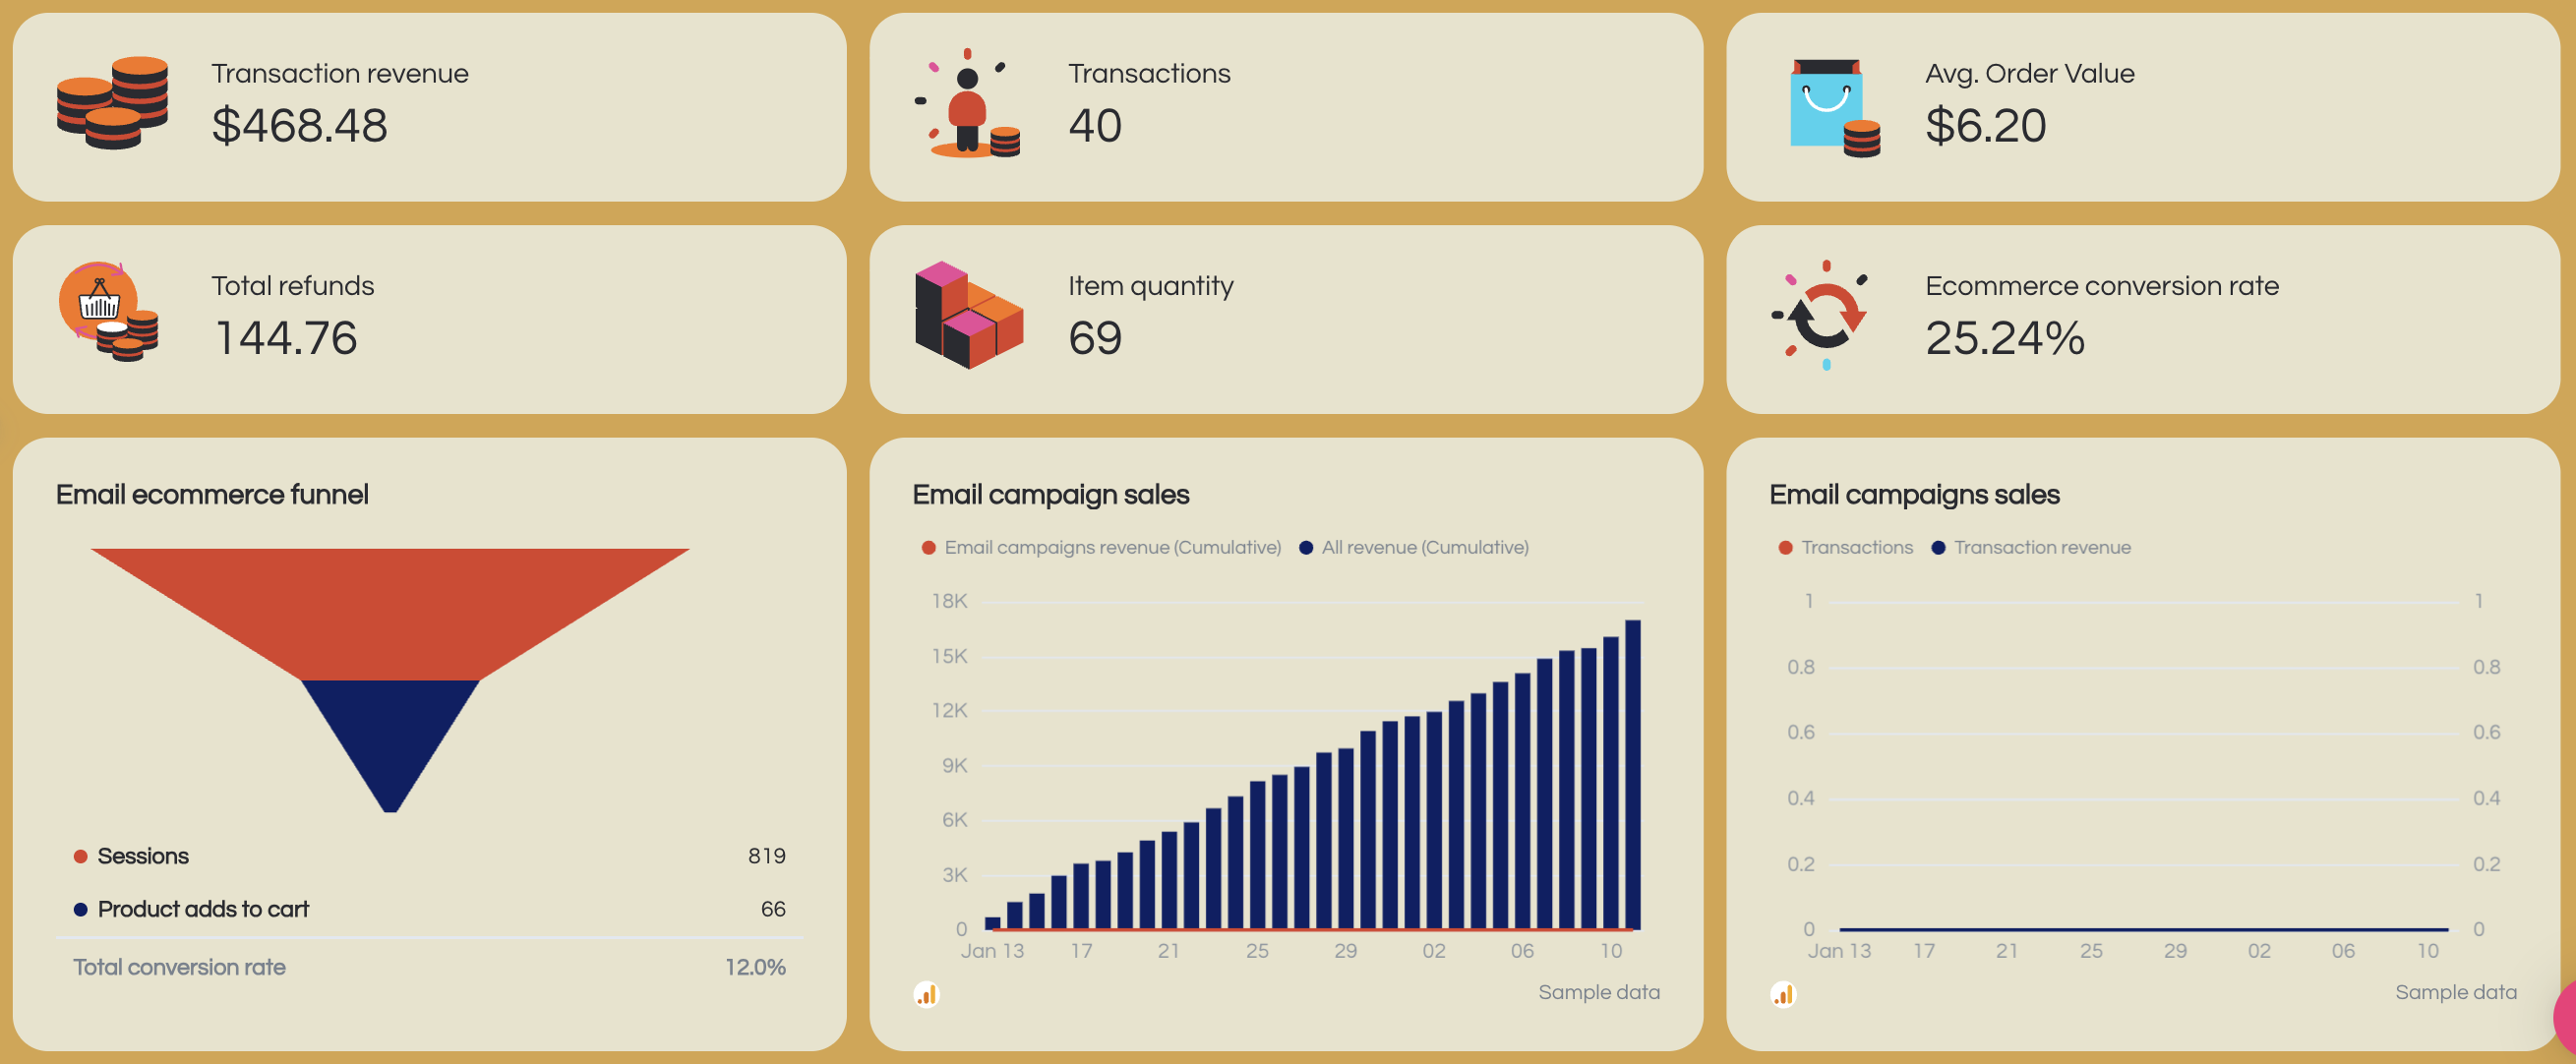
✅ Add revenue and ecommerce metrics if email drives direct sales, not just engagement and break down revenue by campaign, product, and product category
 ✅ Monitor unsubscribe rate and bounce rate trends to protect deliverability
✅ End each report with 3–5 concrete actions (subject line testing, segmentation updates, CTA optimization, list cleaning)
8. Facebook Ads Report Template
 Use this template for free with your data
Who it’s for:
- Paid social specialists
- Agencies reporting Meta performance to clients
- Marketing teams optimizing audience targeting and creative
Channels connected: Facebook Ads
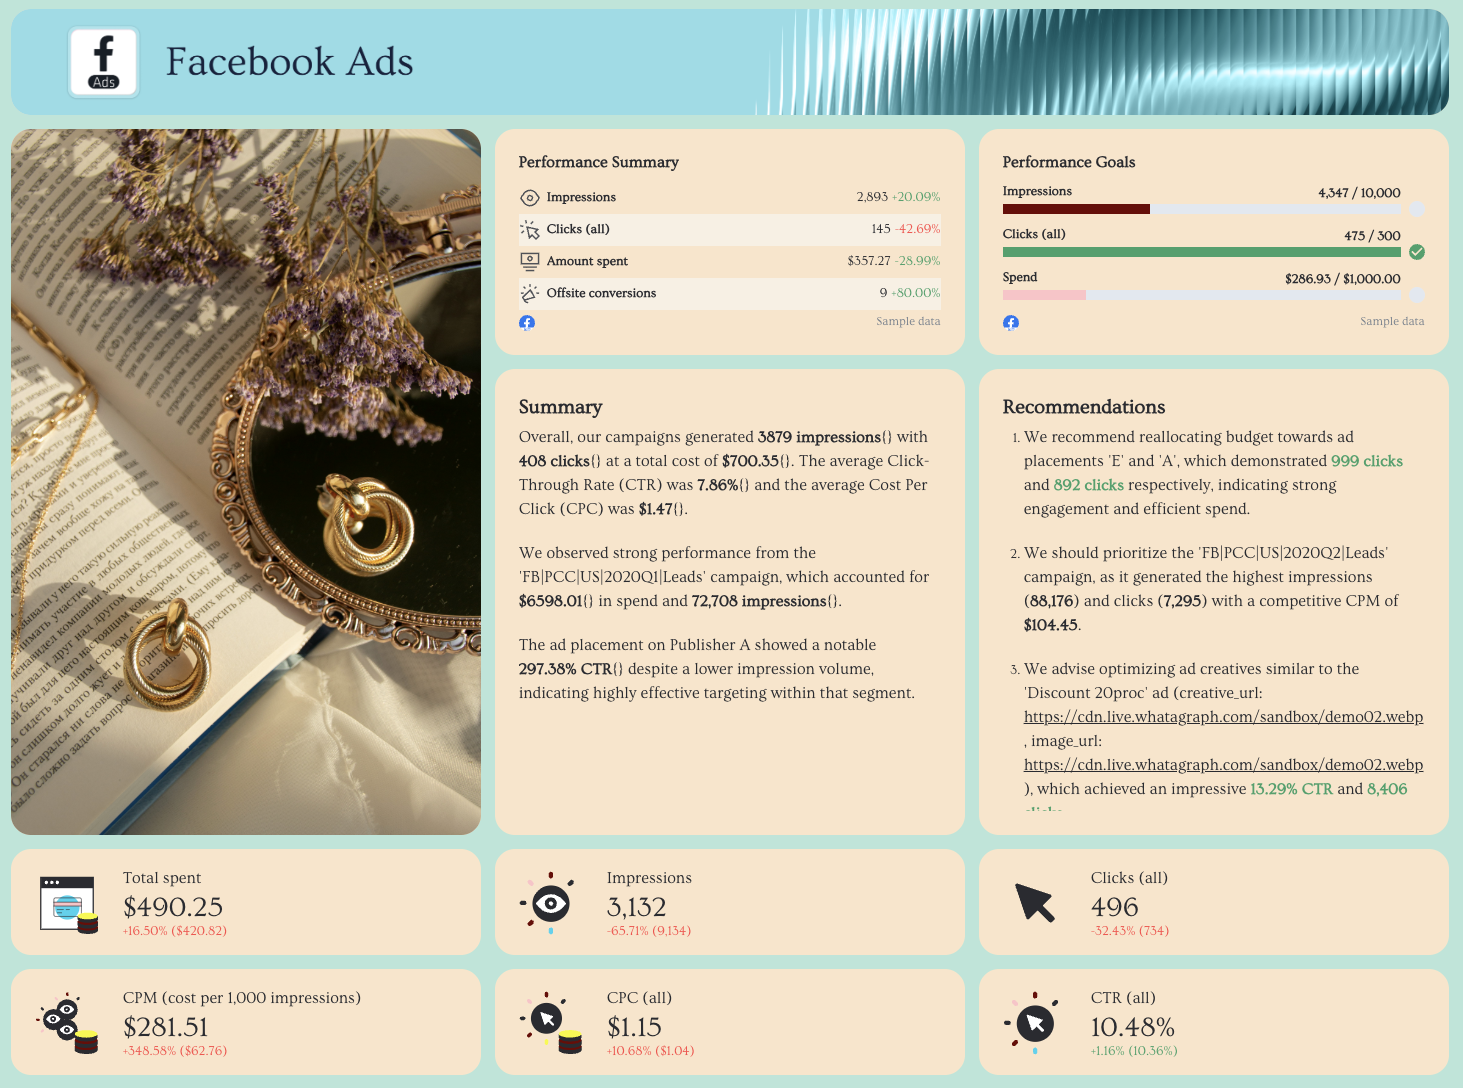
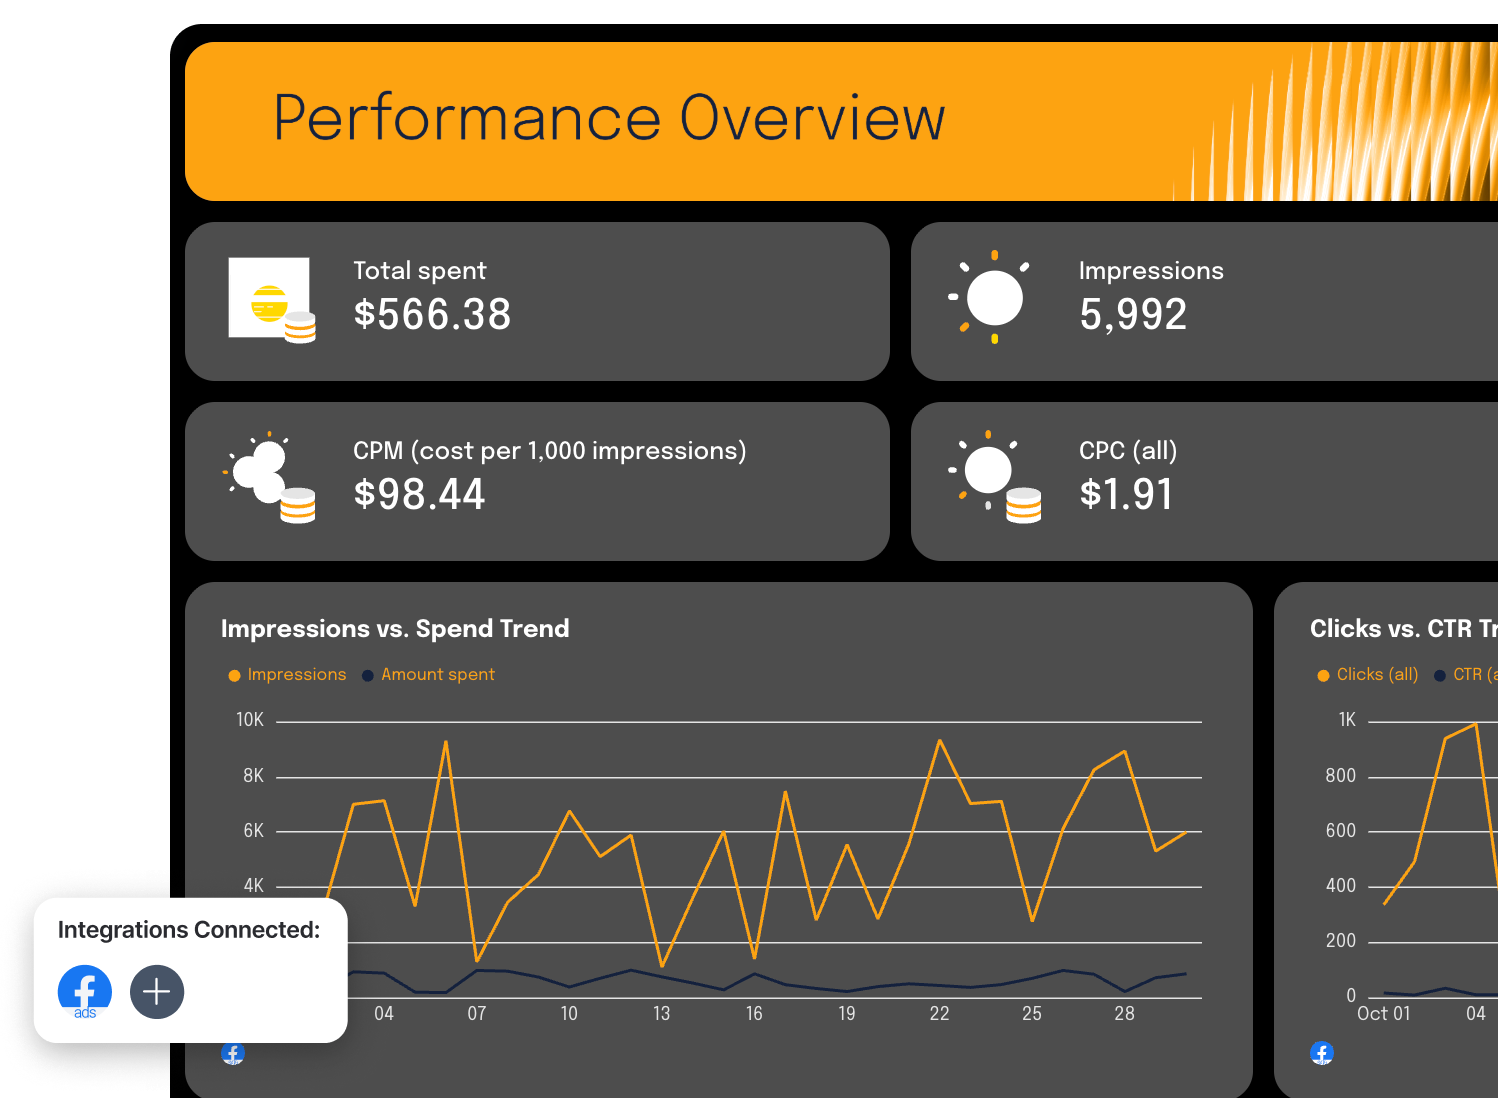
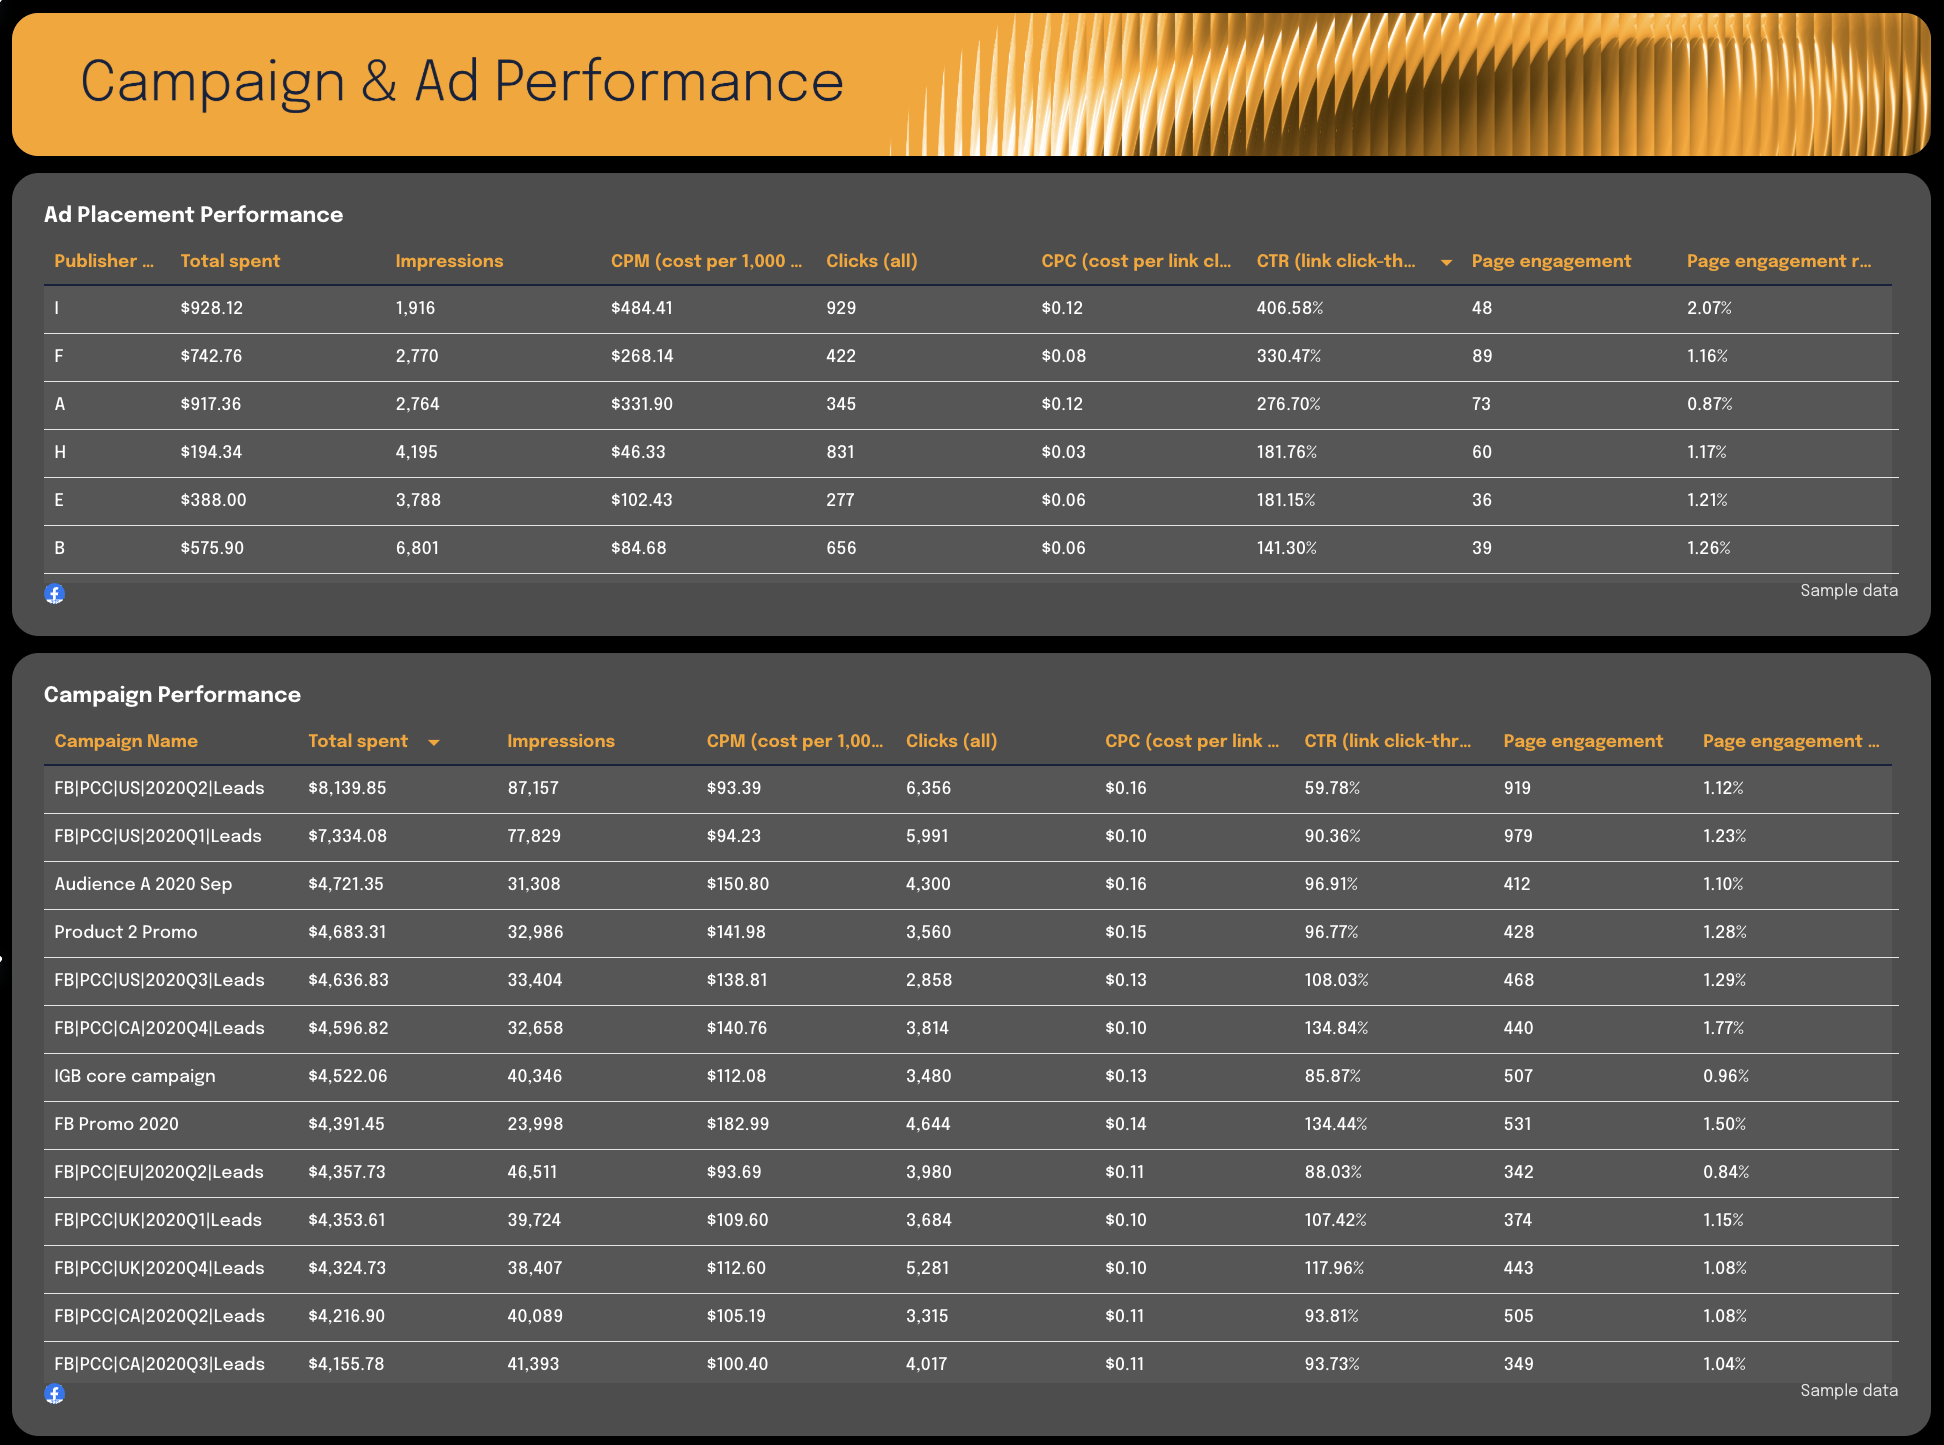
A Facebook Ads report template shows how your Meta ad spend translates into reach, clicks, engagement, and conversions. It breaks down campaign, ad, placement, and demographic performance so you know exactly where to scale.
How to use:
Metrics to visualize:
- Impressions
- Reach
- Clicks (all)
- CTR (click-through rate)
- CPC (cost per click)
- CPM (cost per 1,000 impressions)
- Total spend
- Offsite conversions
- Conversion rate
- Conversion funnel (Reach → Clicks → Conversions)
- Campaign performance (Spend, Impressions, CTR, CPC)
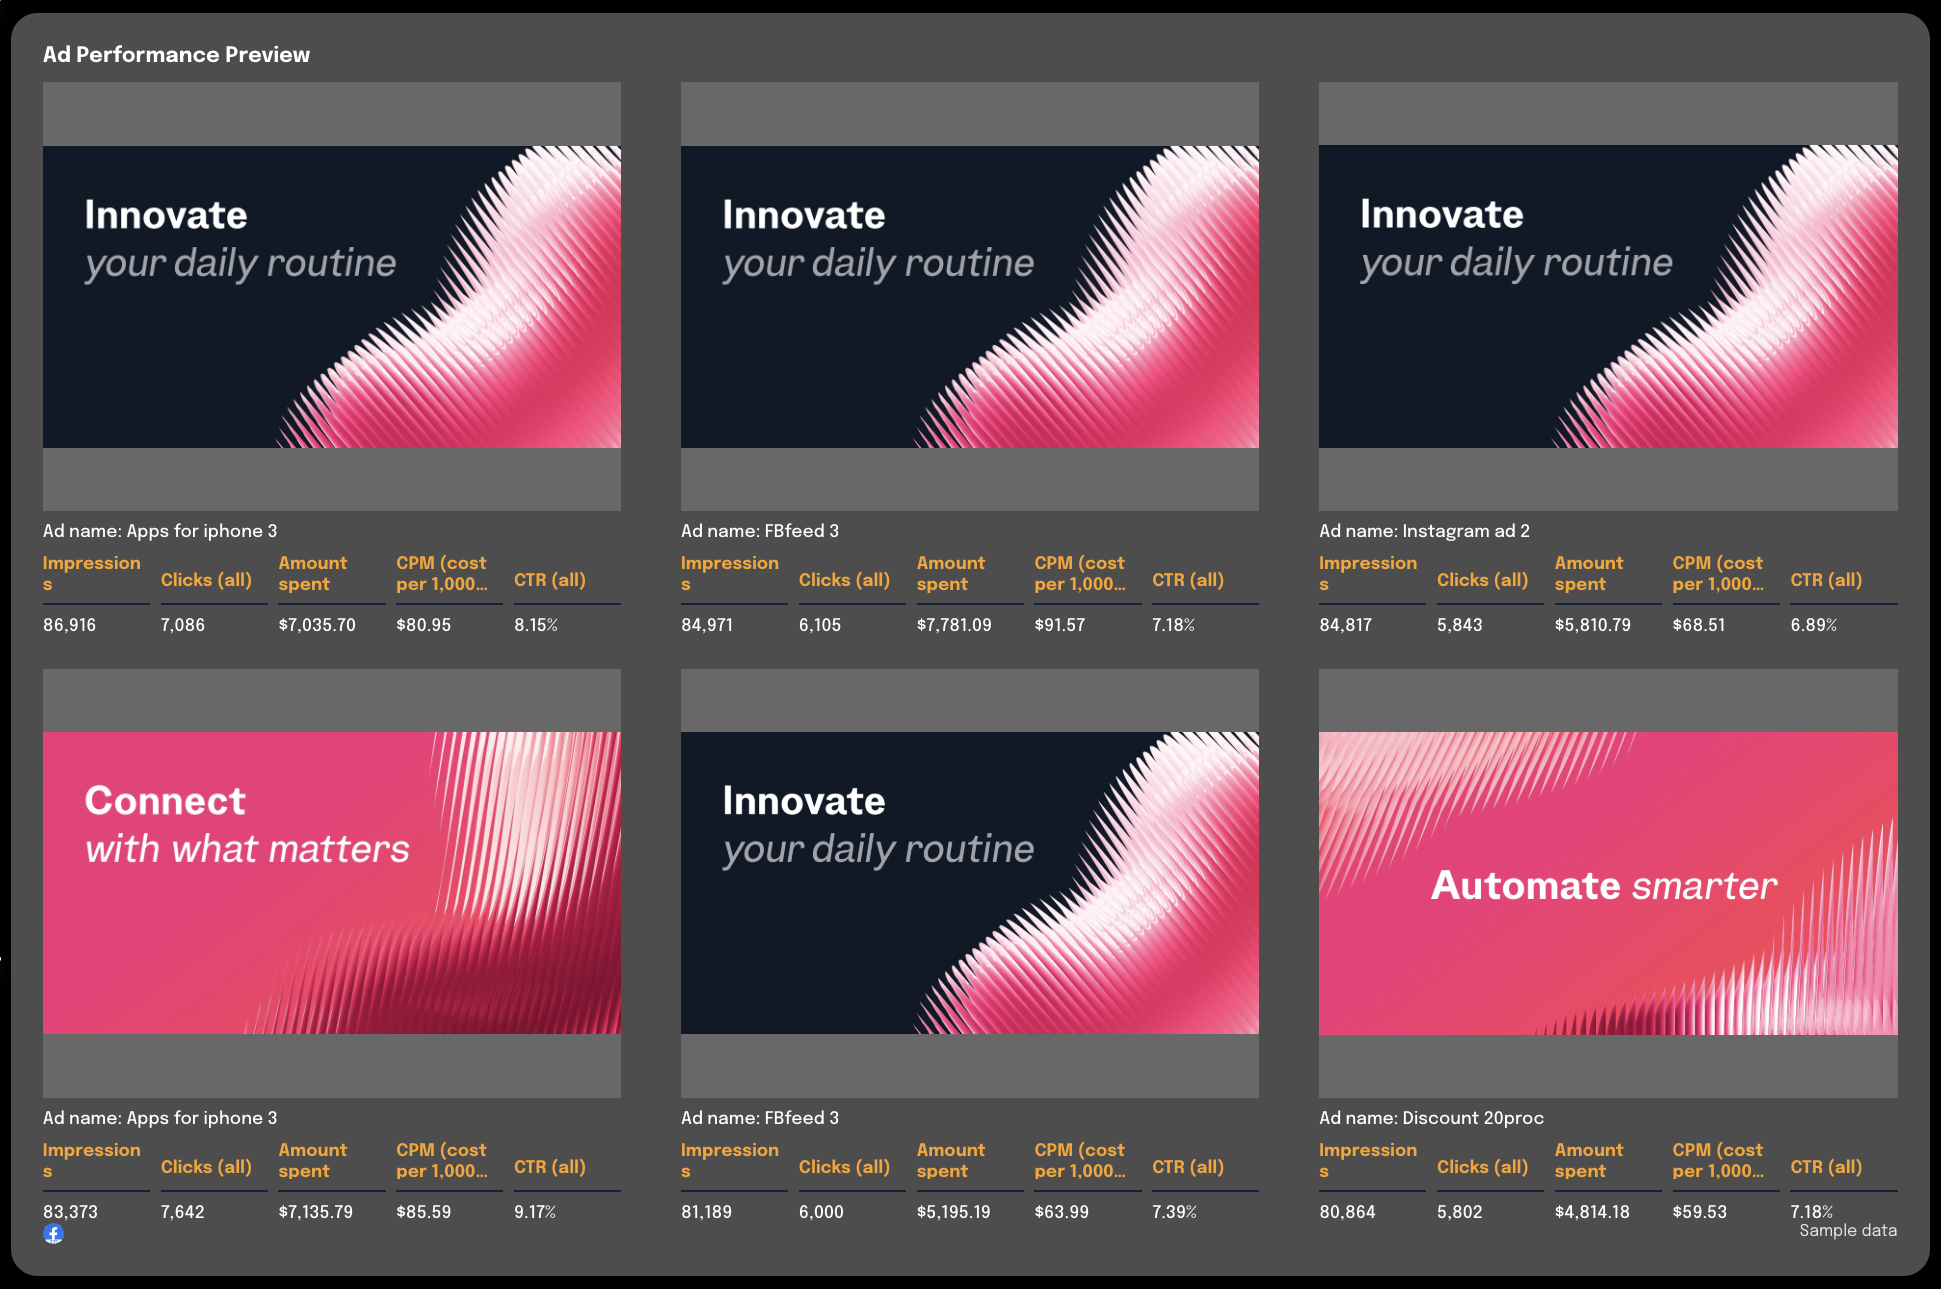
- Ad performance (creative-level breakdown)
- Ad placement performance
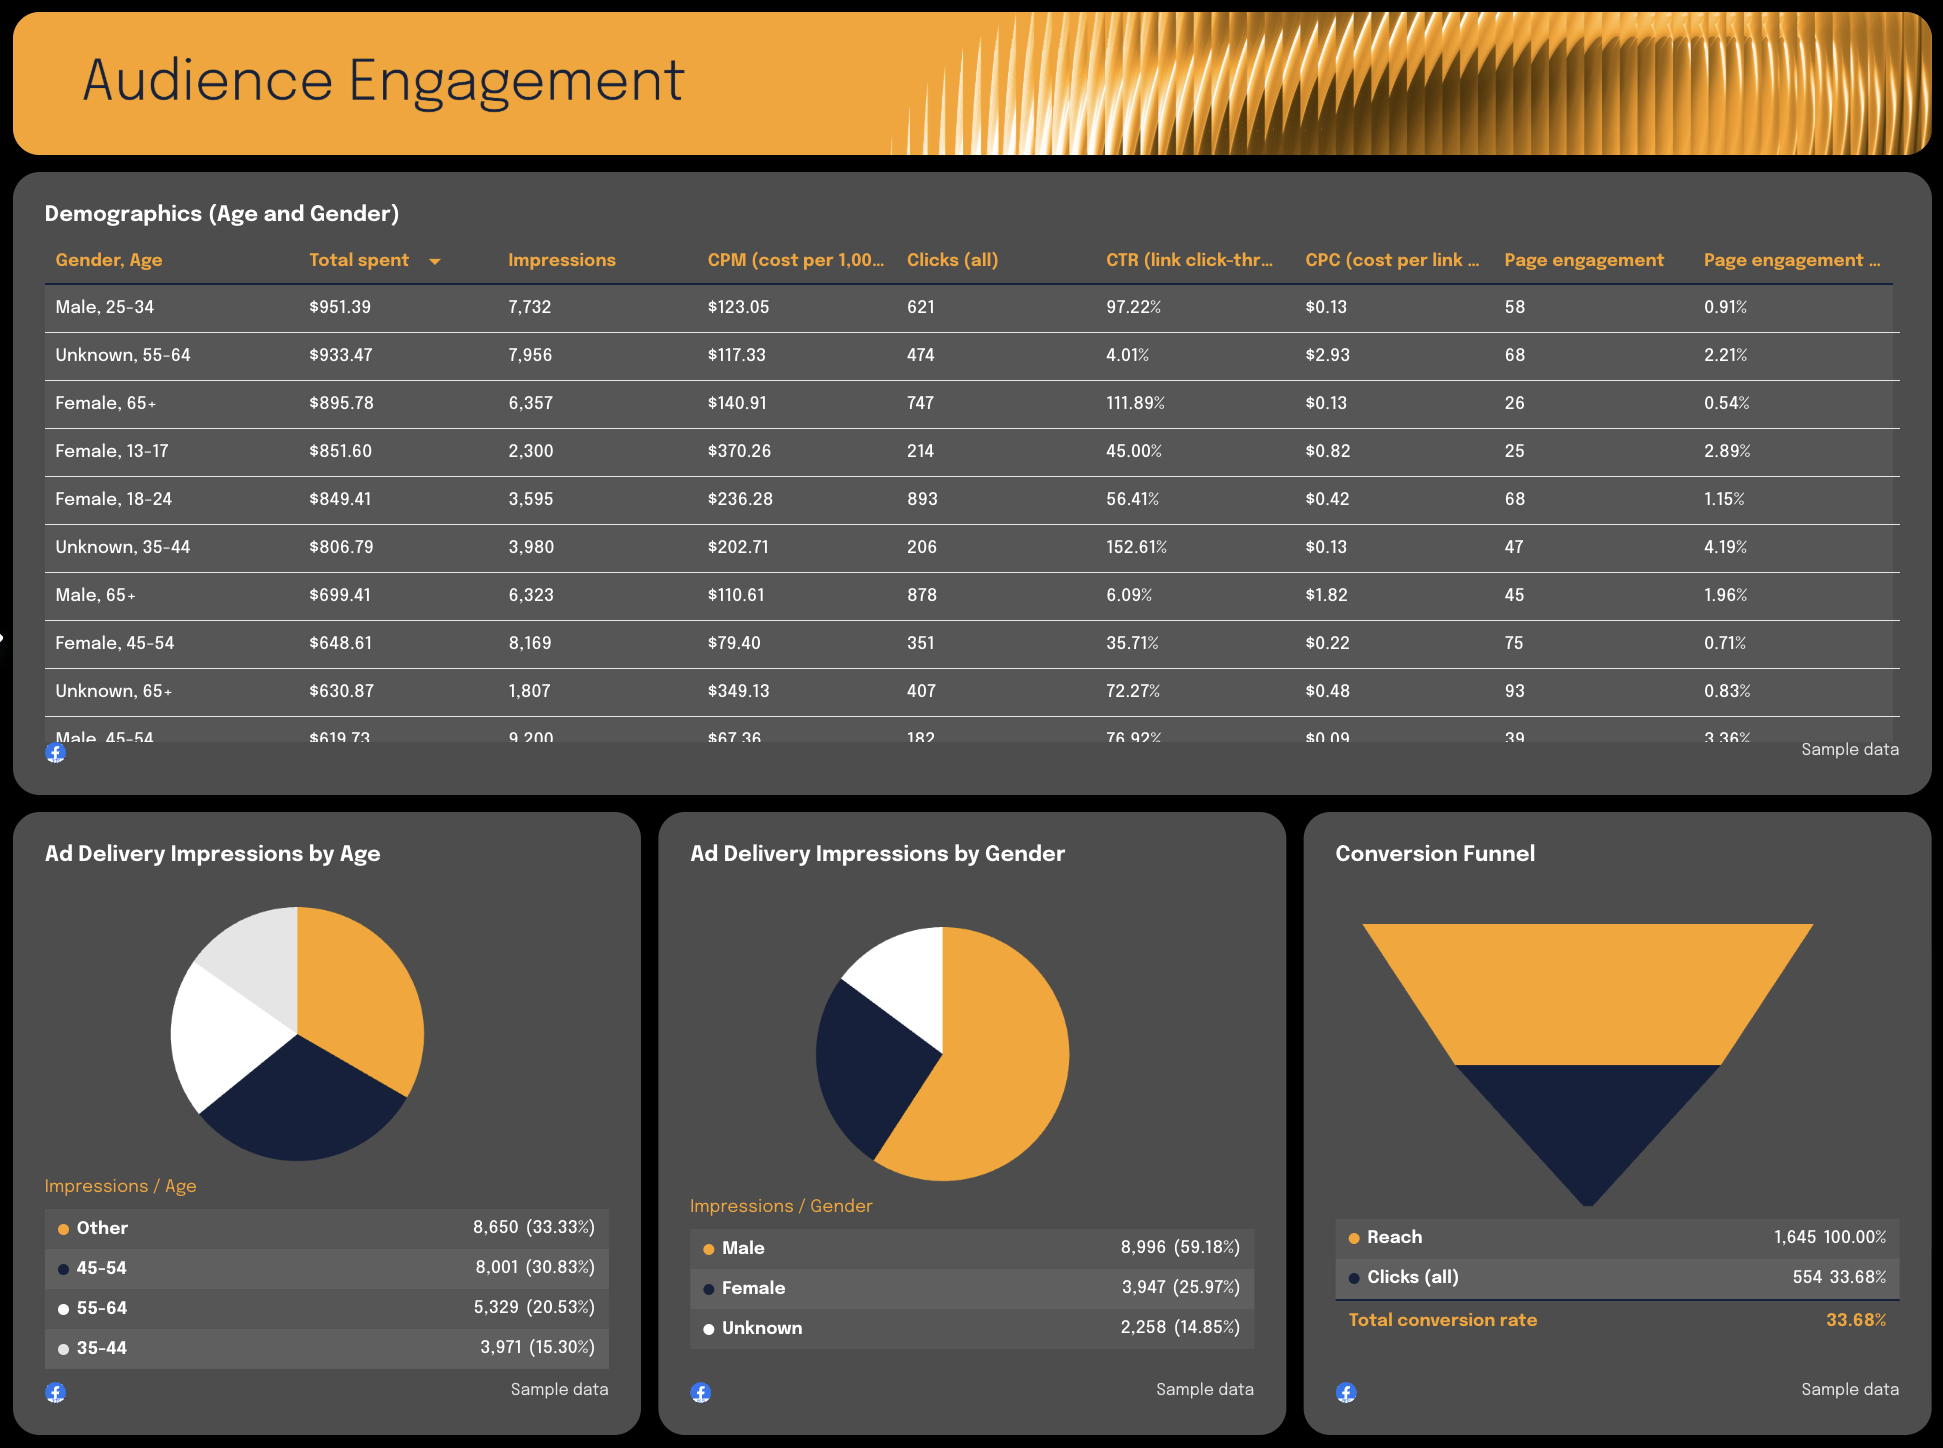
- Demographics (Age & Gender performance)
- Page engagement
Best practices:
✅ Start with a performance summary showing total spend, impressions, clicks, CTR, and conversions
✅ Break performance into three clear layers: Campaign → Ad → Placement
 ✅ Include demographic breakdowns (Age + Gender) to guide audience optimization
 ✅ Highlight top-performing ads and creatives to identify scaling opportunities
 ✅ End the report with clear budget reallocation and targeting recommendations
9. Google Analytics GA4 Report Template
 Use this template for free with your data
Who it’s for:
- Marketing managers tracking website performance
- Growth teams analyzing traffic quality
- Agencies delivering GA4 performance reports to clients
Channels connected: Google Analytics 4, (Optional) Google Ads, Meta, and other campaign-tagged sources
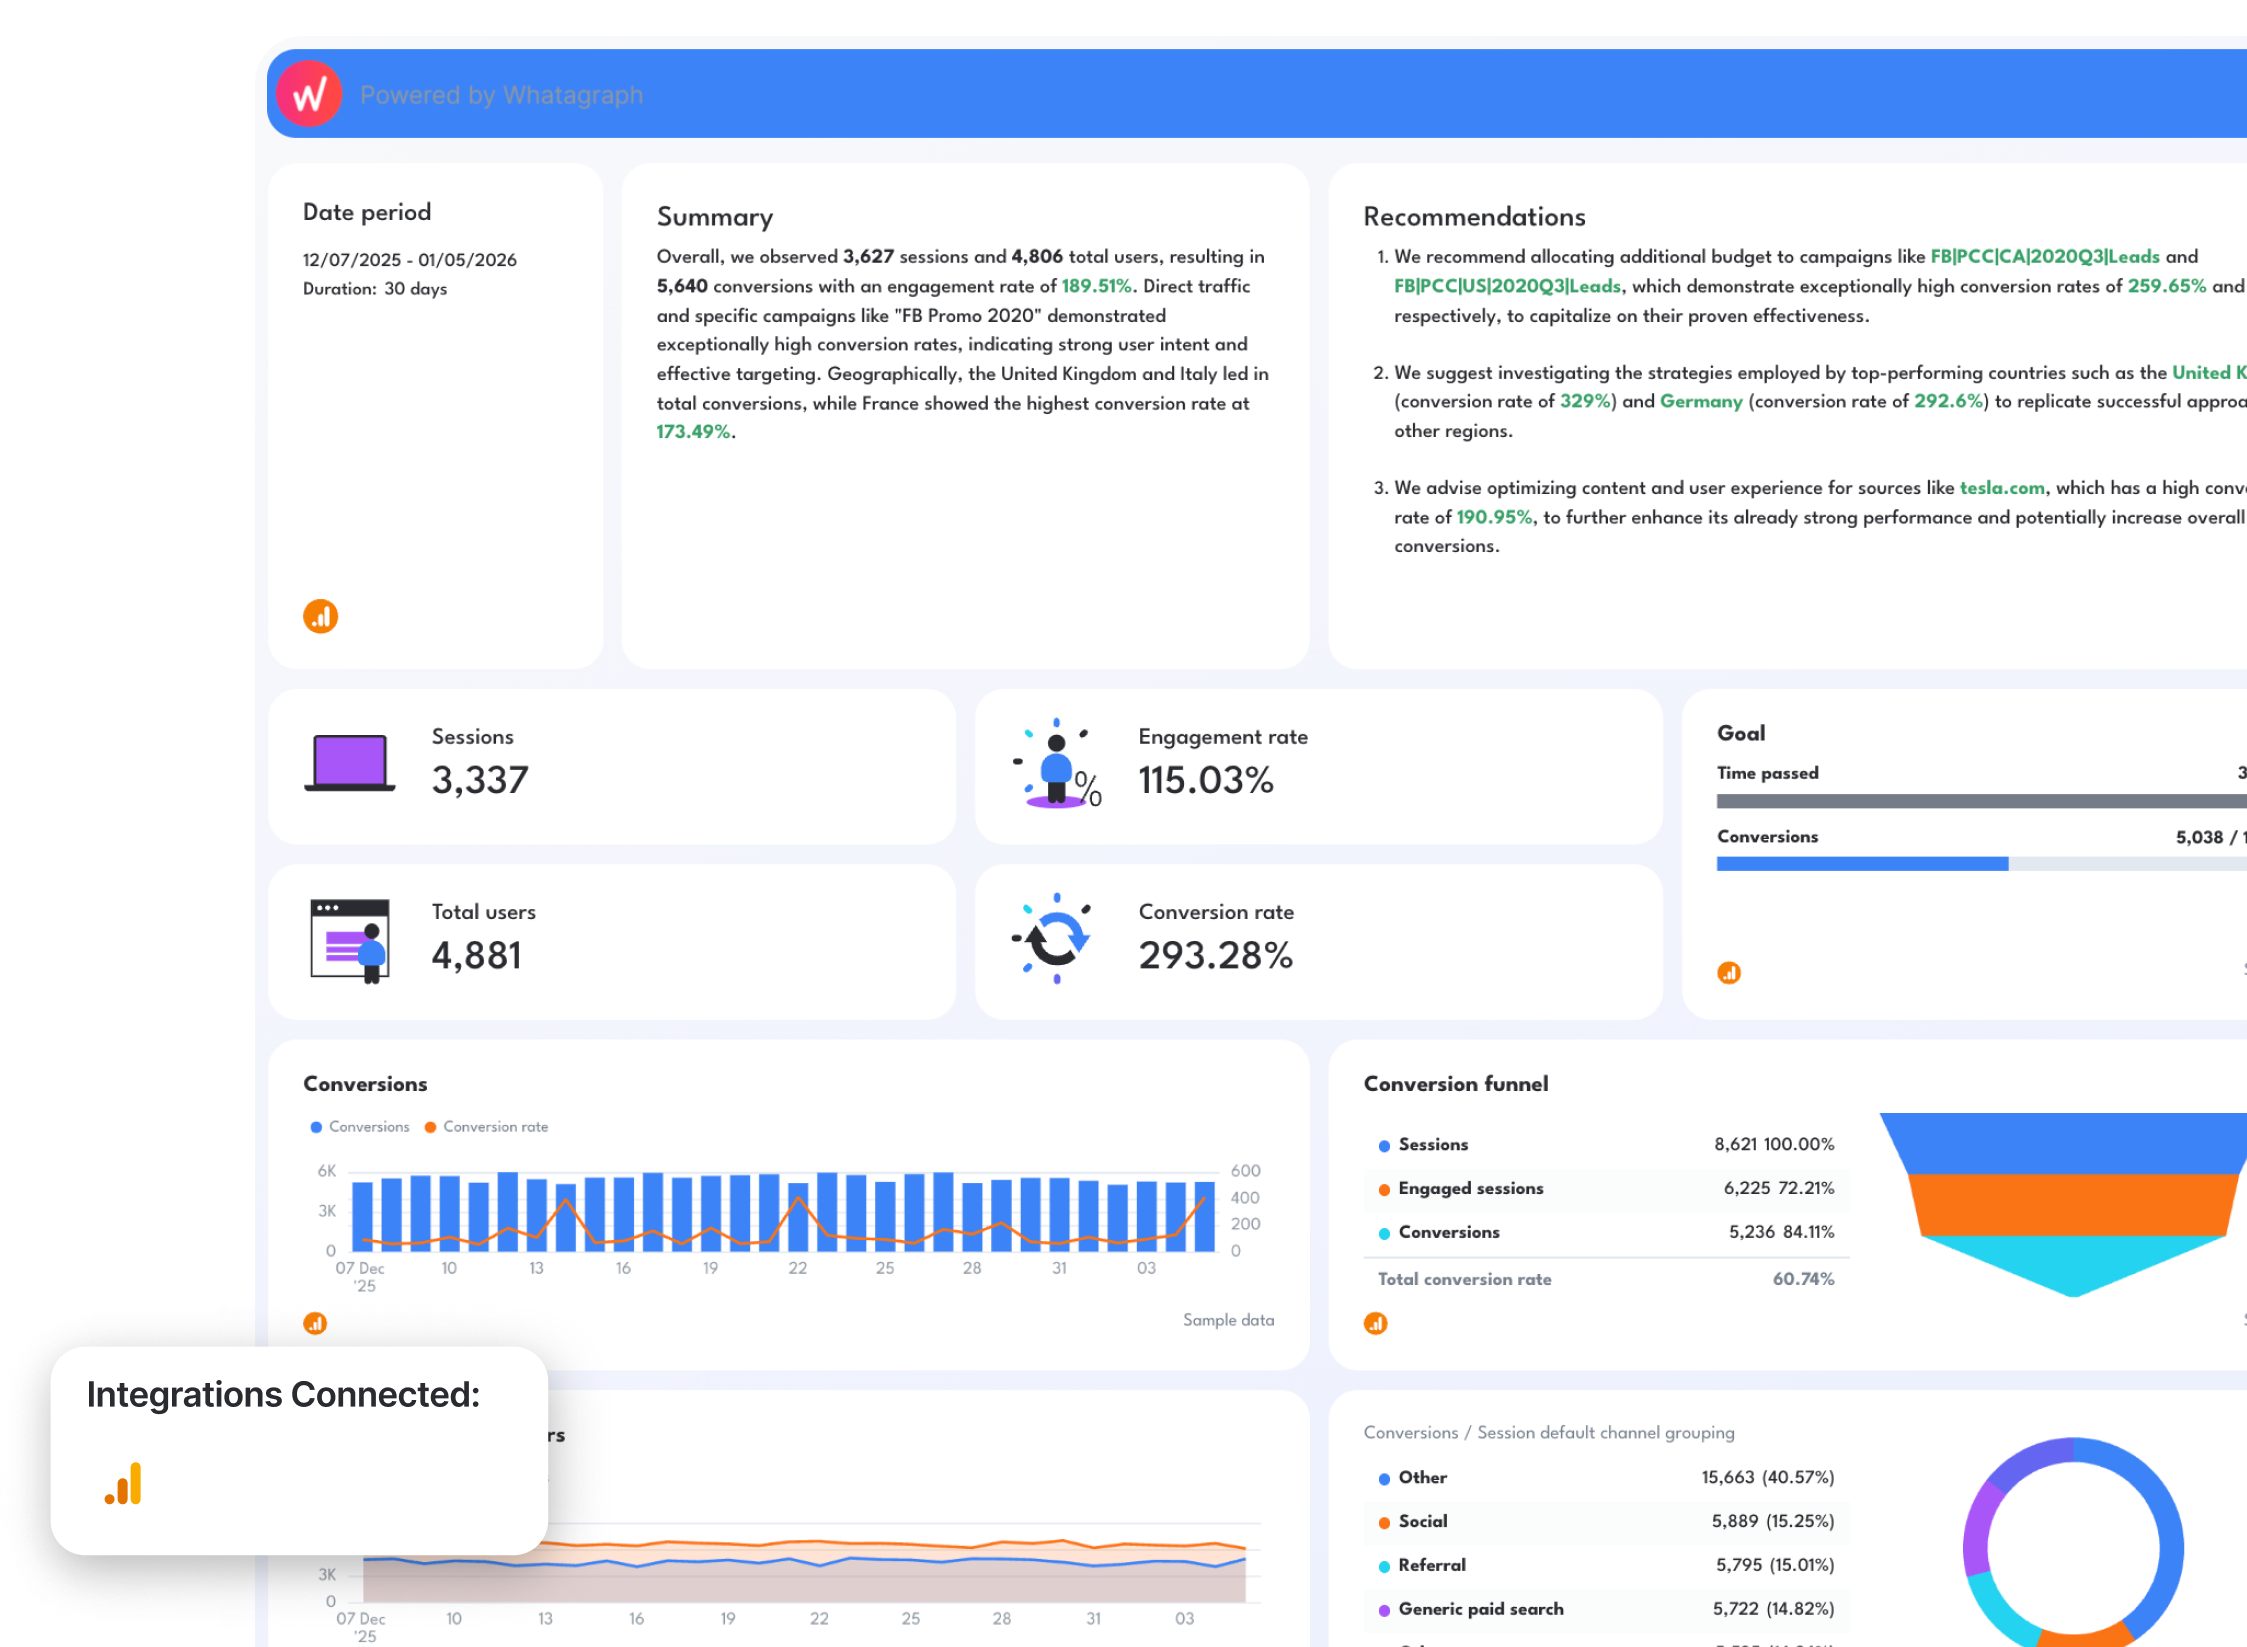
A Google Analytics 4 report template shows how users interact with your website, and which traffic sources actually drive conversions. It connects sessions, engagement, campaigns, countries, and revenue into one clear performance view.
How to use:
Metrics to visualize:
- Sessions
- Total users and New users
- Engaged sessions
- Engagement rate
- Conversions and Conversion rate
- Goal pacing (Conversions vs Target)
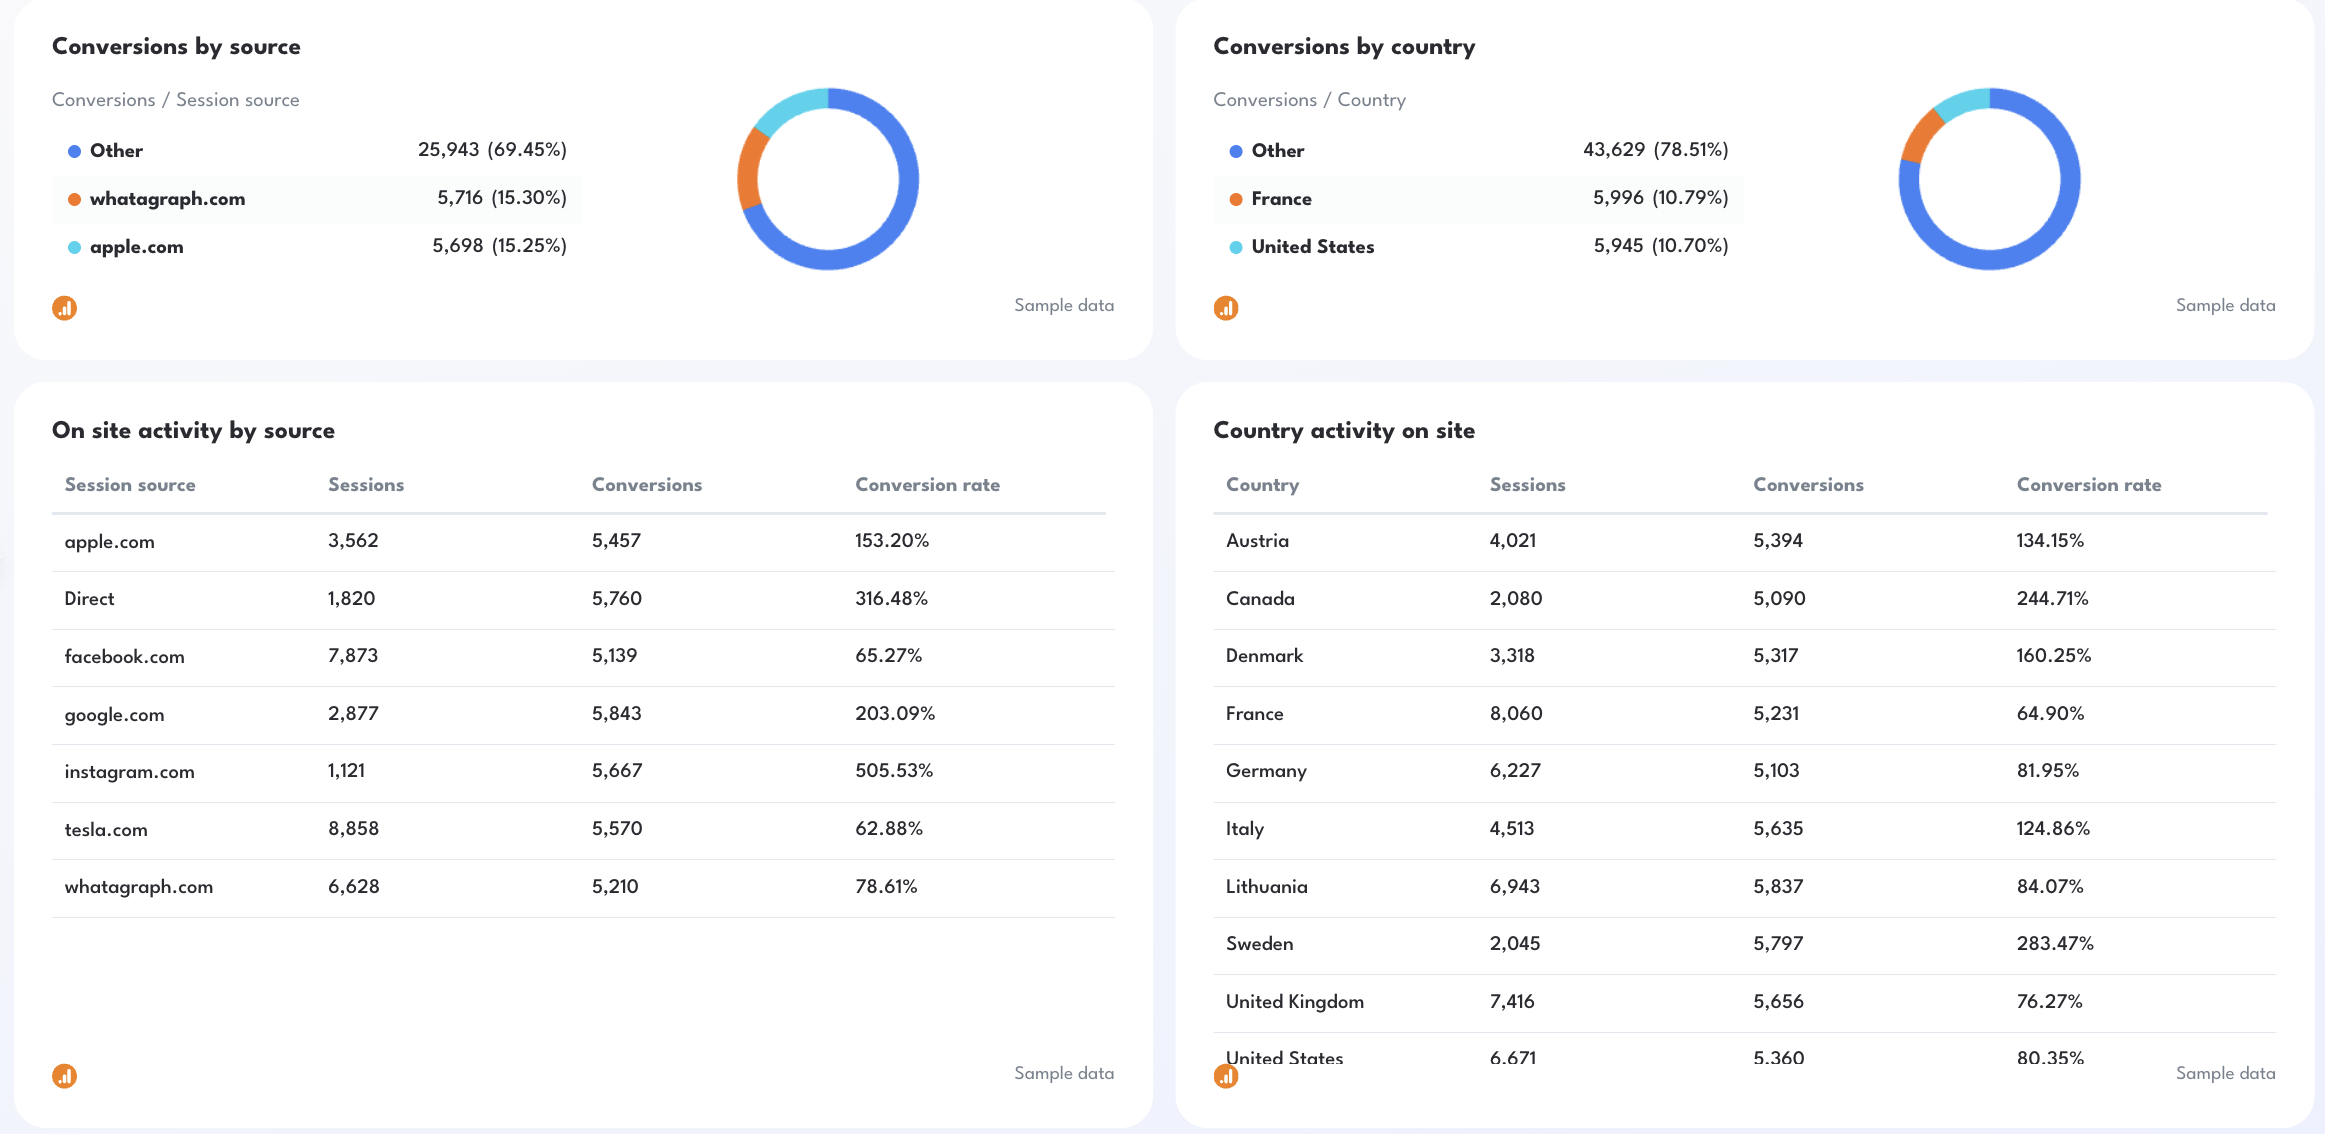
- Conversions by source
- Conversions by default channel grouping (Organic, Direct, Social, Email), campaign, and country
- On-site activity by source, campaign, and day
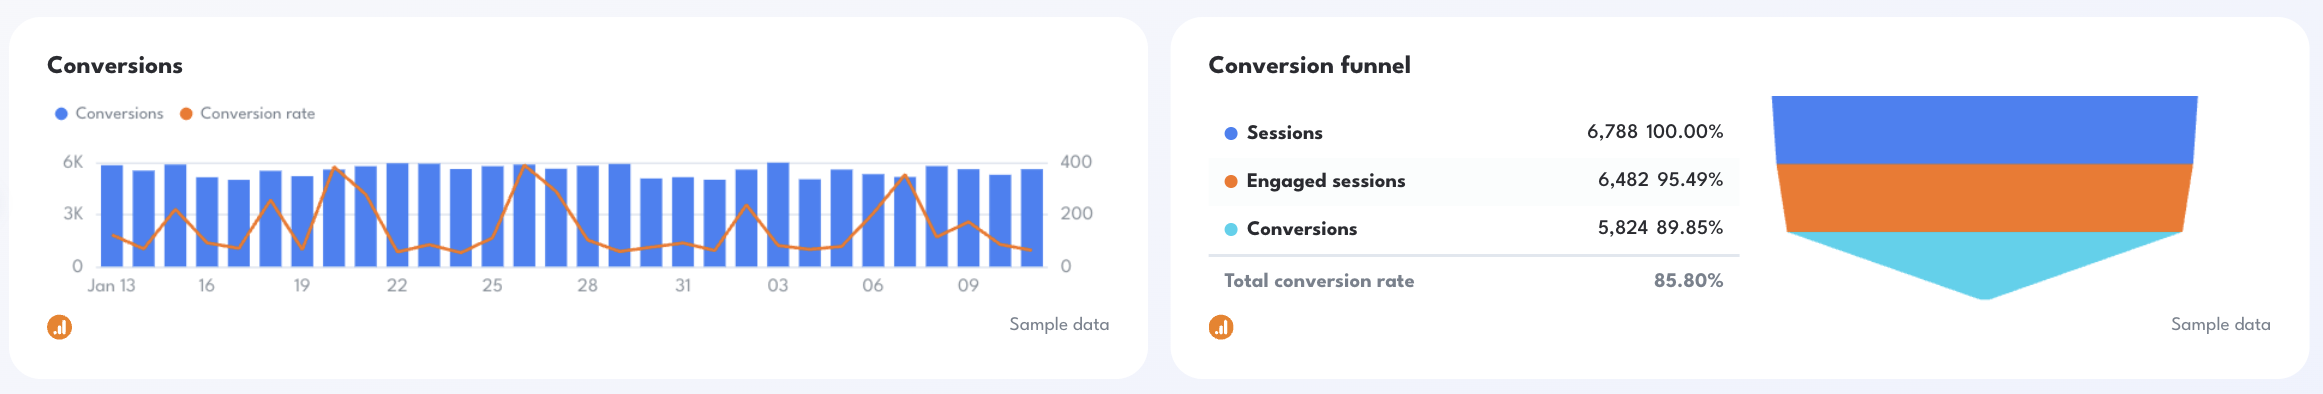
- Conversion funnel (Sessions → Engaged Sessions → Conversions)
Best practices:
✅ Start with a performance summary showing sessions, total users, engagement rate, conversions, and conversion rate
✅ Add a goal pacing widget (Conversions vs Monthly Target) to keep reporting aligned with business objectives
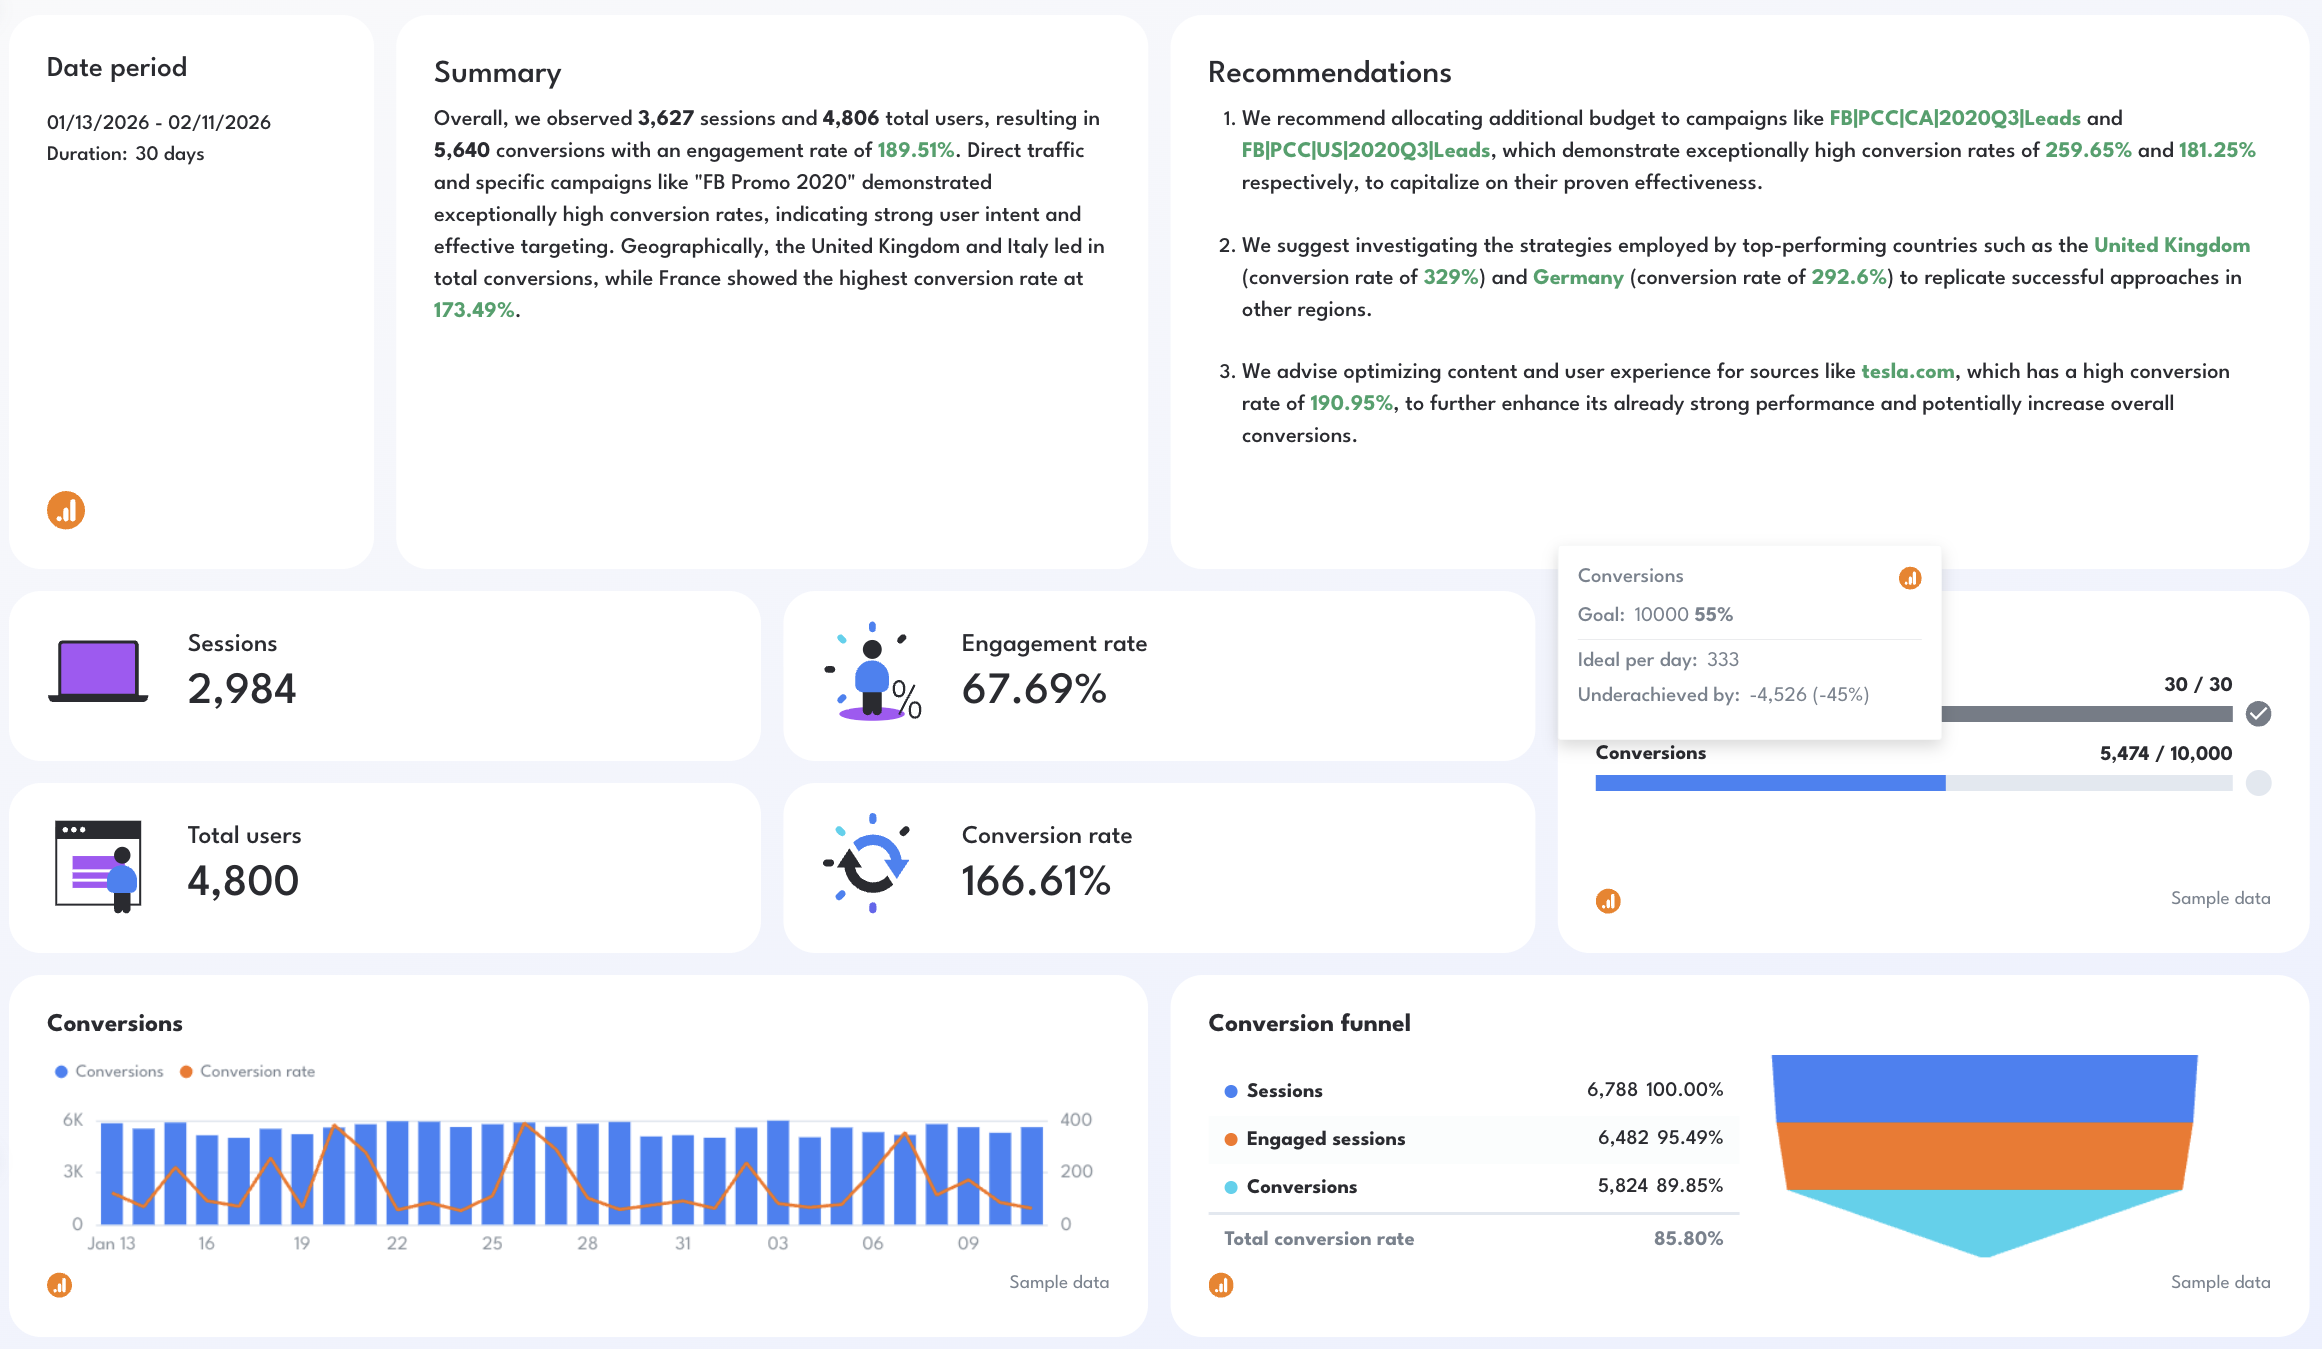 ✅ Break down performance by source, country, and campaign to identify high-intent traffic
✅ Use funnel visualization to quickly spot drop-offs between sessions and conversions
Published on Feb 12 2026
WRITTEN BY
YamonYamon is a Senior Content Marketing Manager at Whatagraph. With an eye for detail and a knack for always considering context, audience, and business goals to guide the narrative, she's on a mission to create genuinely helpful content for marketers. When she’s not working, she’s hiking, meditating, or practicing yoga.