7 Google Analytics Dashboard Examples & Free Templates
Overwhelmed by all the report types and metrics on Google Analytics 4?
Want to track Google Analytics and other marketing data in one dashboard?
Or just want some ✨ aesthetic ✨ dashboard examples to inspire you?
We’ve got you.

Mar 16 2026●8 min read


In this article, we featured 7 best Google Analytics dashboard examples recreated from actual dashboards marketers have built on Whatagraph.
Each dashboard focuses on a specific use case, from marketing performance and SEO to ecommerce and paid campaigns, so you can quickly find a layout that fits your reporting needs.
You’ll also find Google Analytics dashboard templates that you can get started for free in seconds.
7 Google Analytics Dashboard Examples
Jump to the dashboard example you’d like to see:
- Google Analytics dashboard
- Google Analytics marketing dashboard
- Google Analytics SEO dashboard
- Content marketing dashboard Google Analytics
- Google Analytics PPC dashboard
- Social media dashboard Google Analytics
- Ecommerce Google Analytics dashboard
1. Google Analytics Dashboard Example
Use this GA4 dashboard template for free with your data
Who it’s for: Marketing managers, founders, and agencies who need a simple way to understand overall website performance without having to figure out GA4
Channels connected: Google Analytics 4
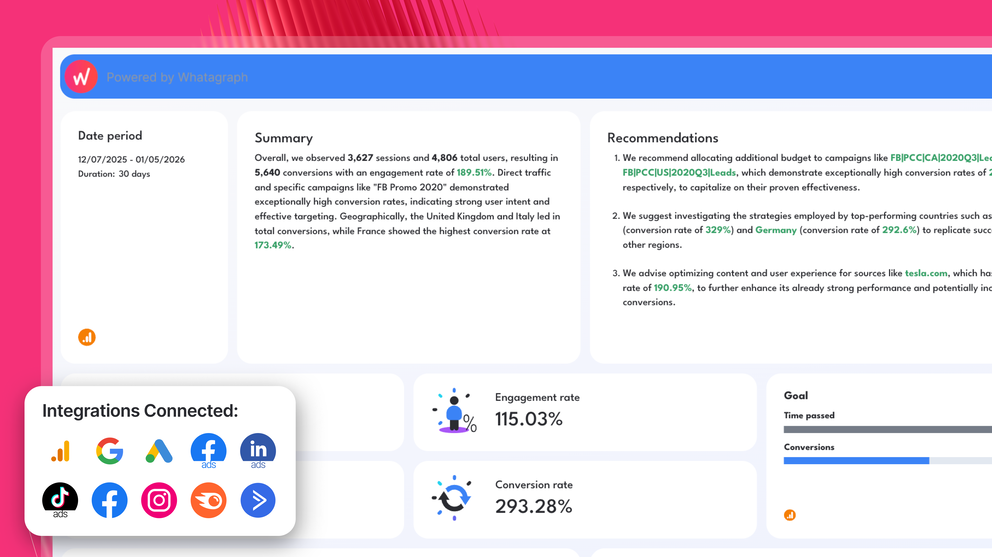
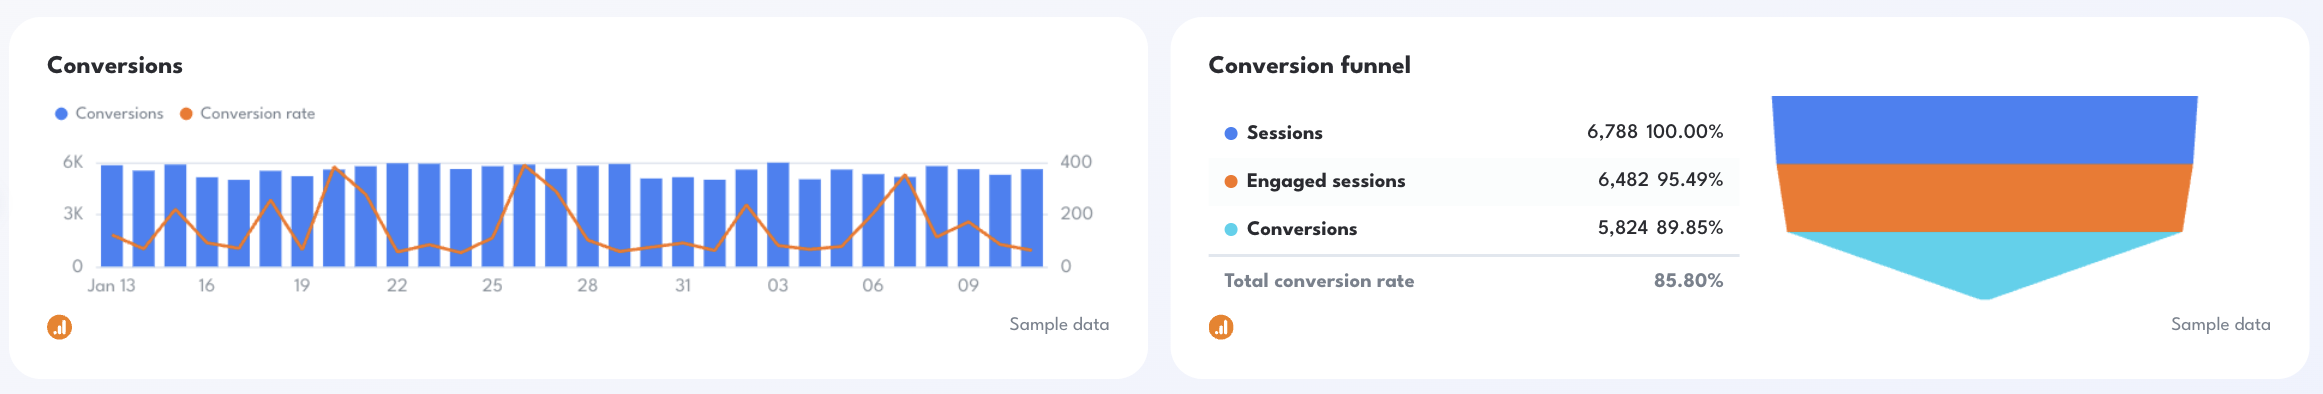
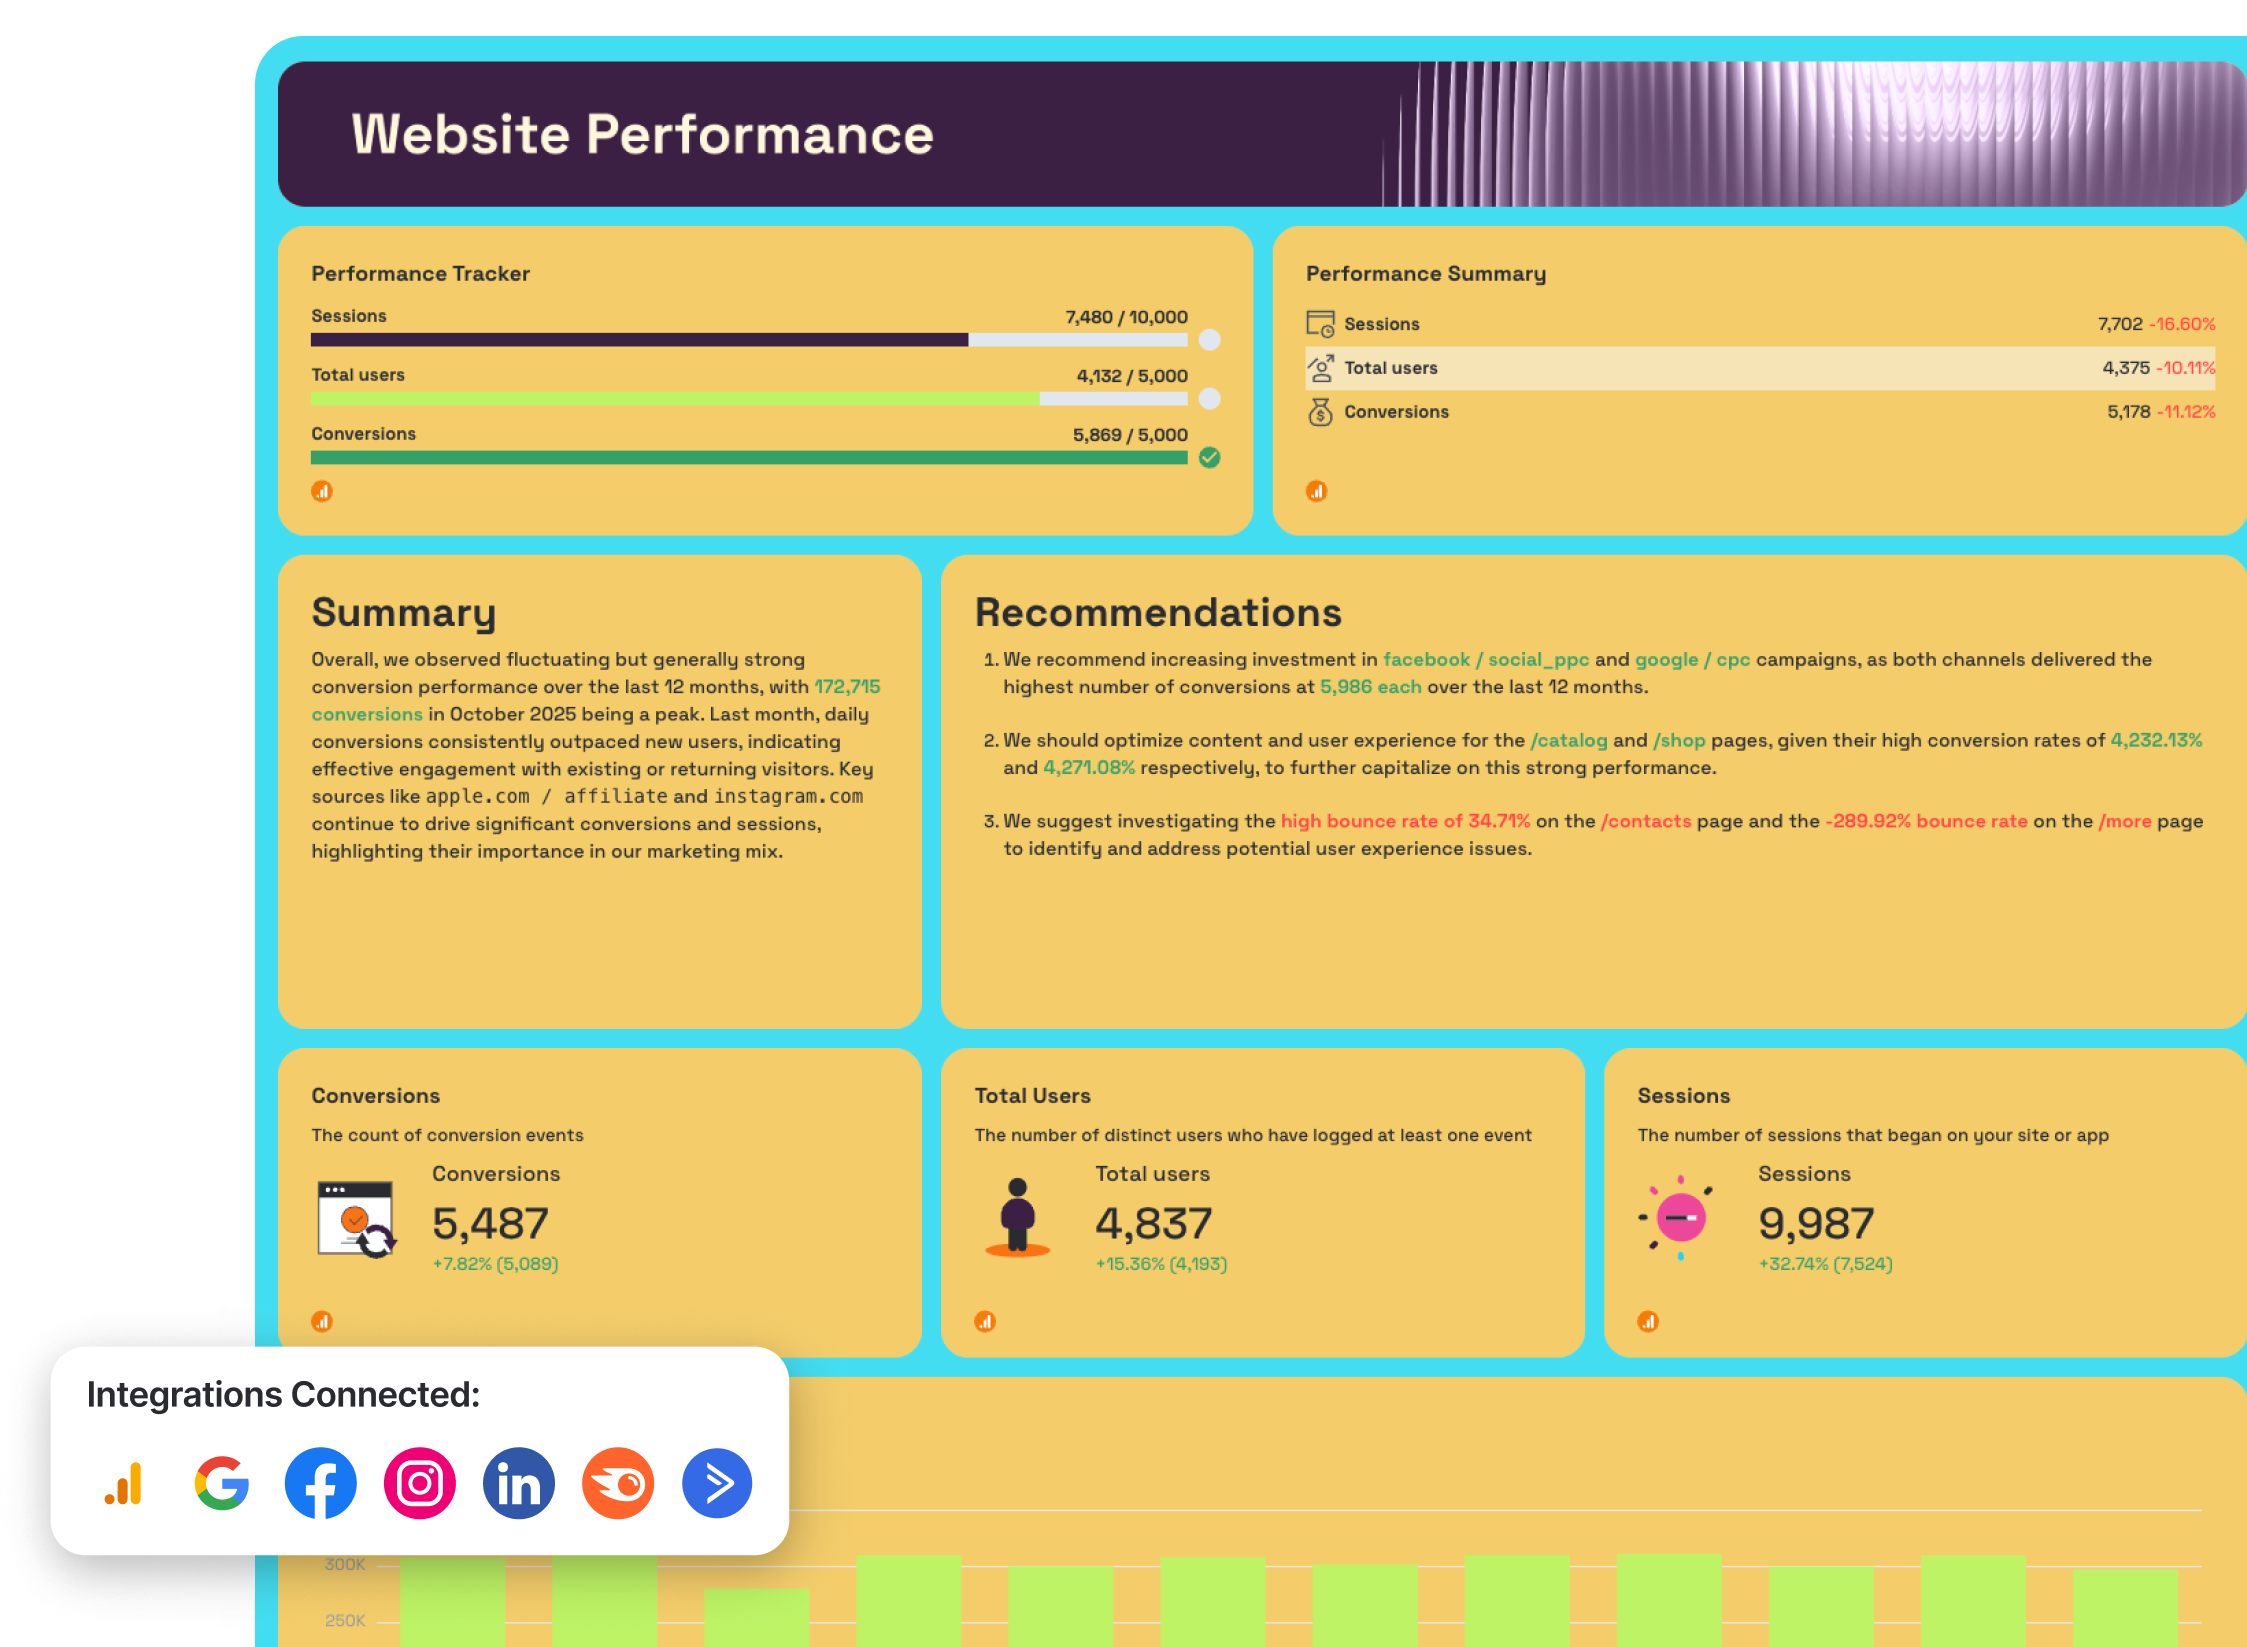
This Google Analytics dashboard example gives you a high-level view of how your website is performing across traffic, engagement, and conversions, so you can quickly understand what’s driving growth and what needs attention.
It makes the main numbers easy to understand and quickly points out which Google Analytics metrics need attention first.
See also: 6 best web analytics dashboard examples
How to use this GA4 custom dashboard:
Key metrics to visualize:
- Sessions
- Total users
- New users
- Engaged sessions
- Engagement rate
- Conversions
- Conversion rate
- Conversions by source, channel, campaign, country
- Sessions by source, campaign
Best practices:
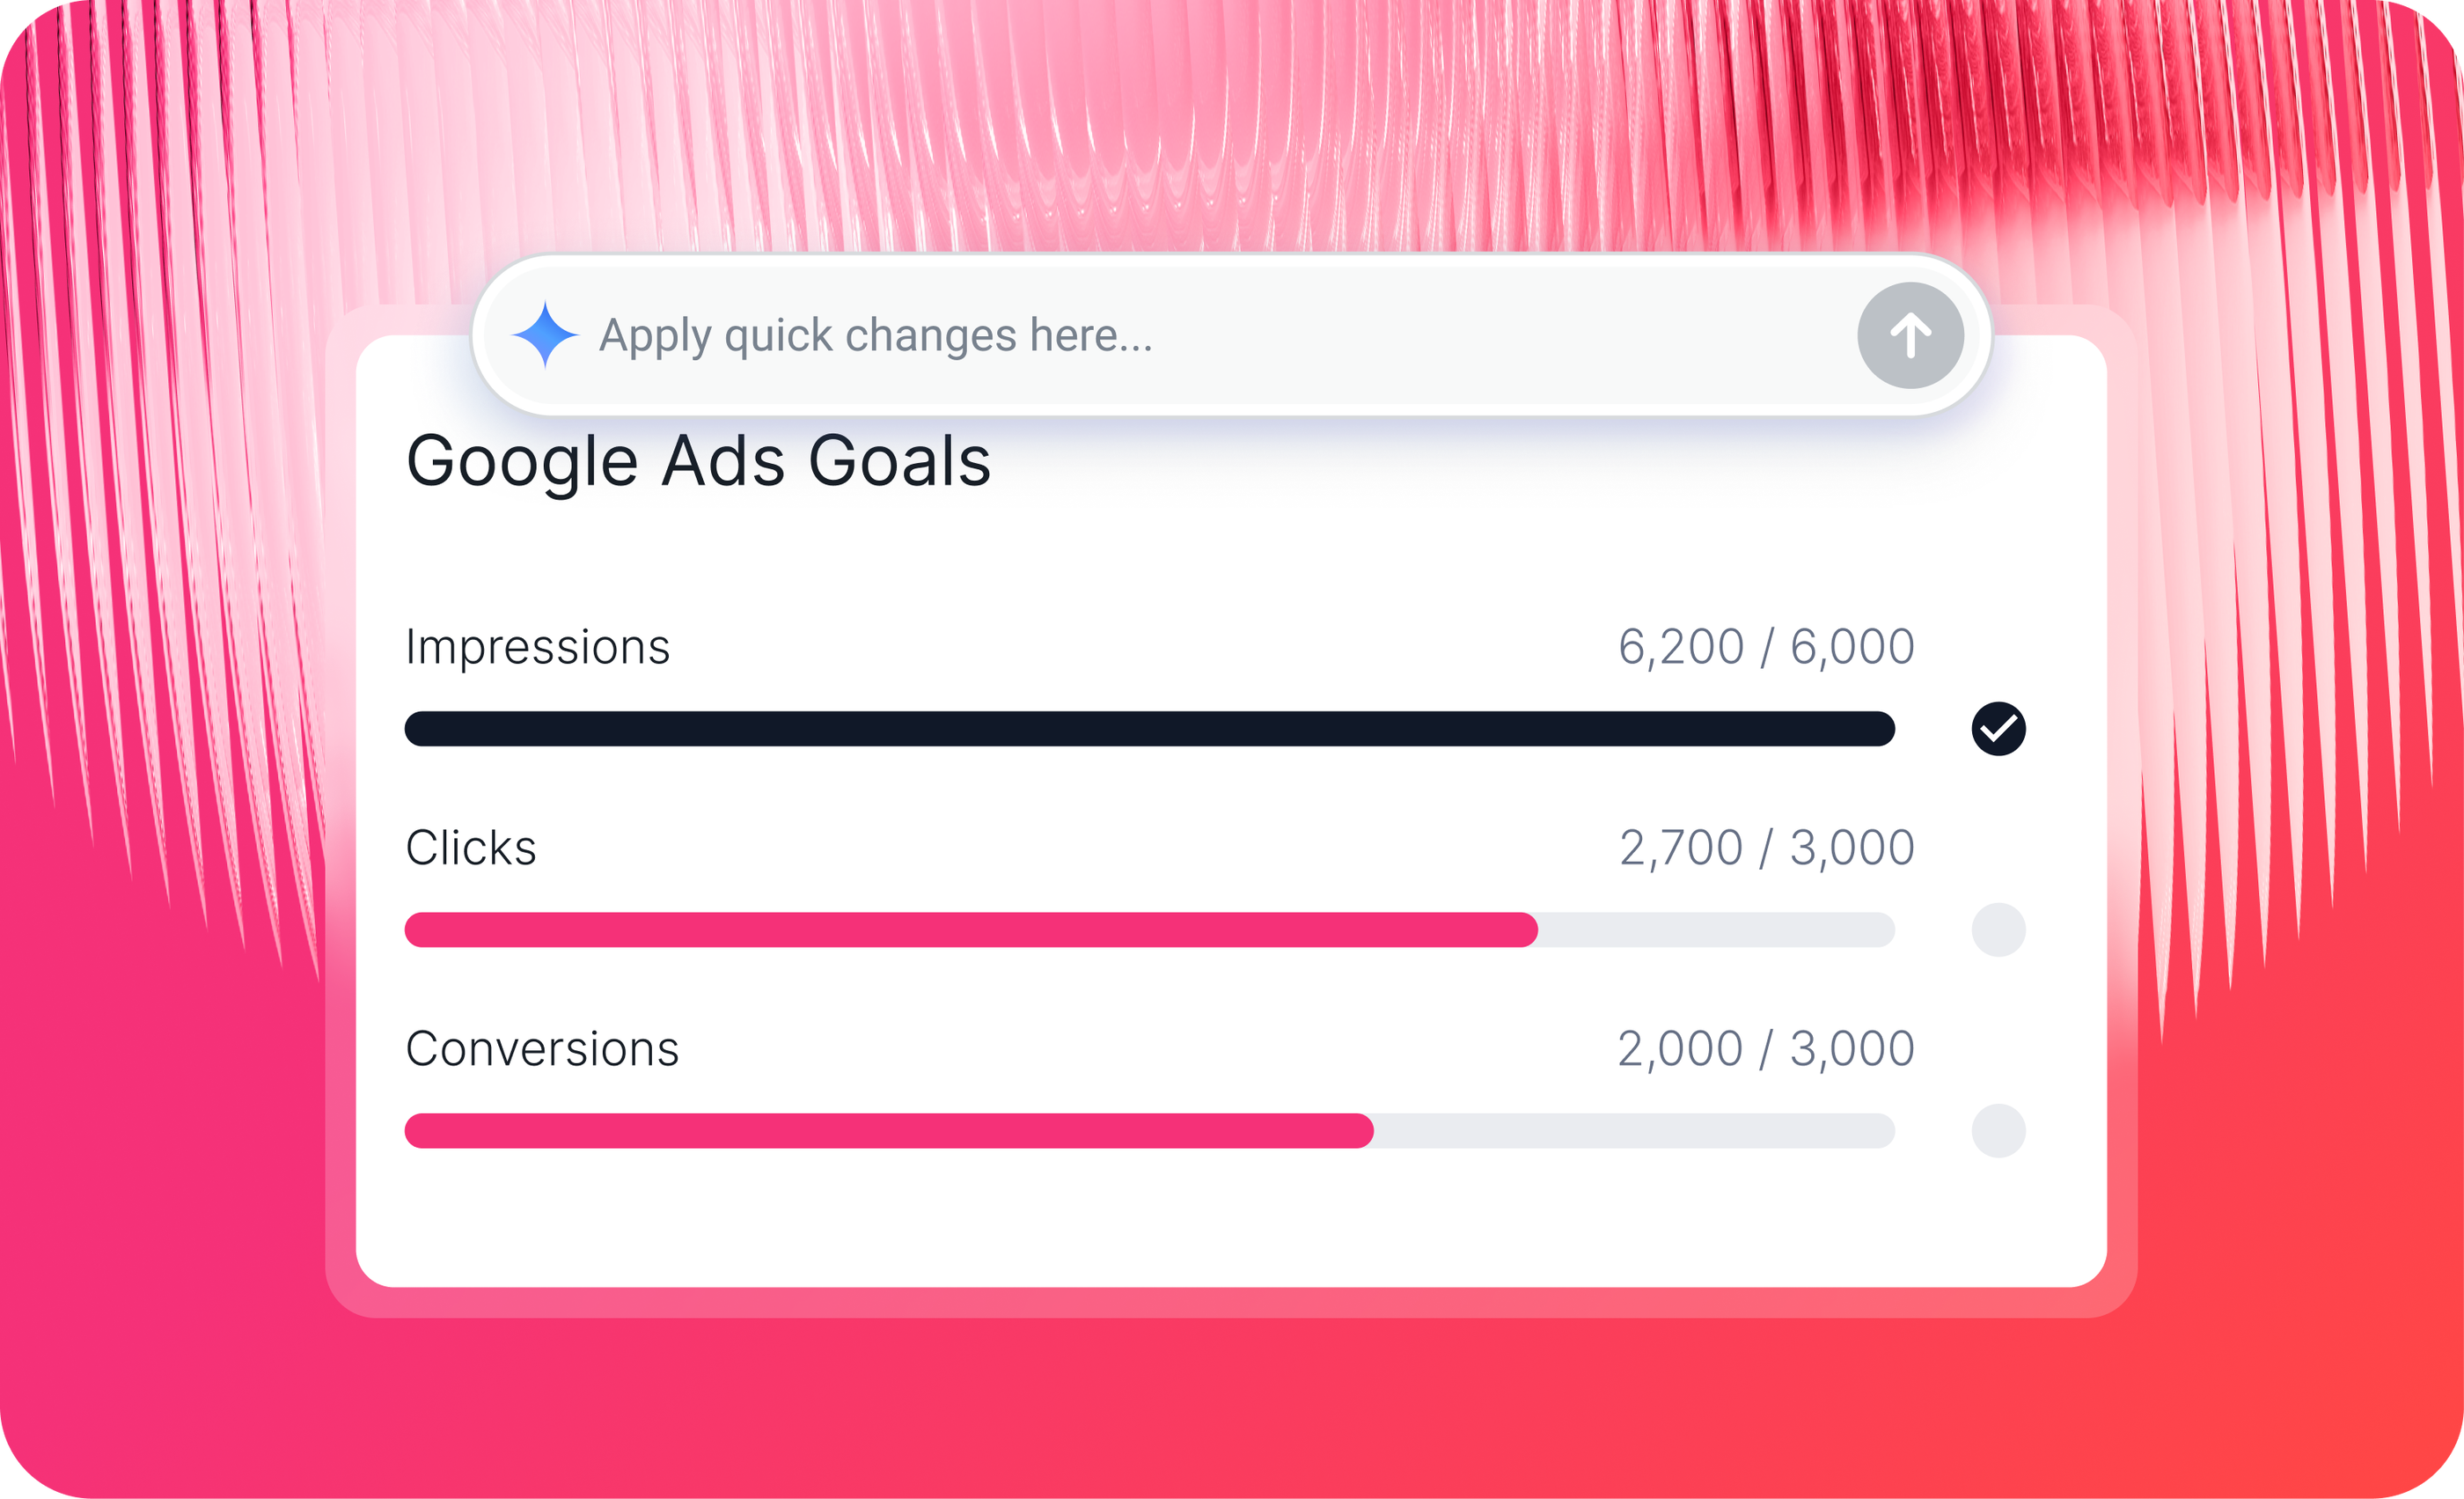
✅ Add a goal widget to show stakeholders at a glance how you’re pacing towards website traffic goals.
✅ Use Whatagraph IQ Summary to turn this Google Analytics dashboard into a short update for stakeholders. Ask it to summarize performance, highlight wins, and suggest next steps based on this Google Analytics dashboard.
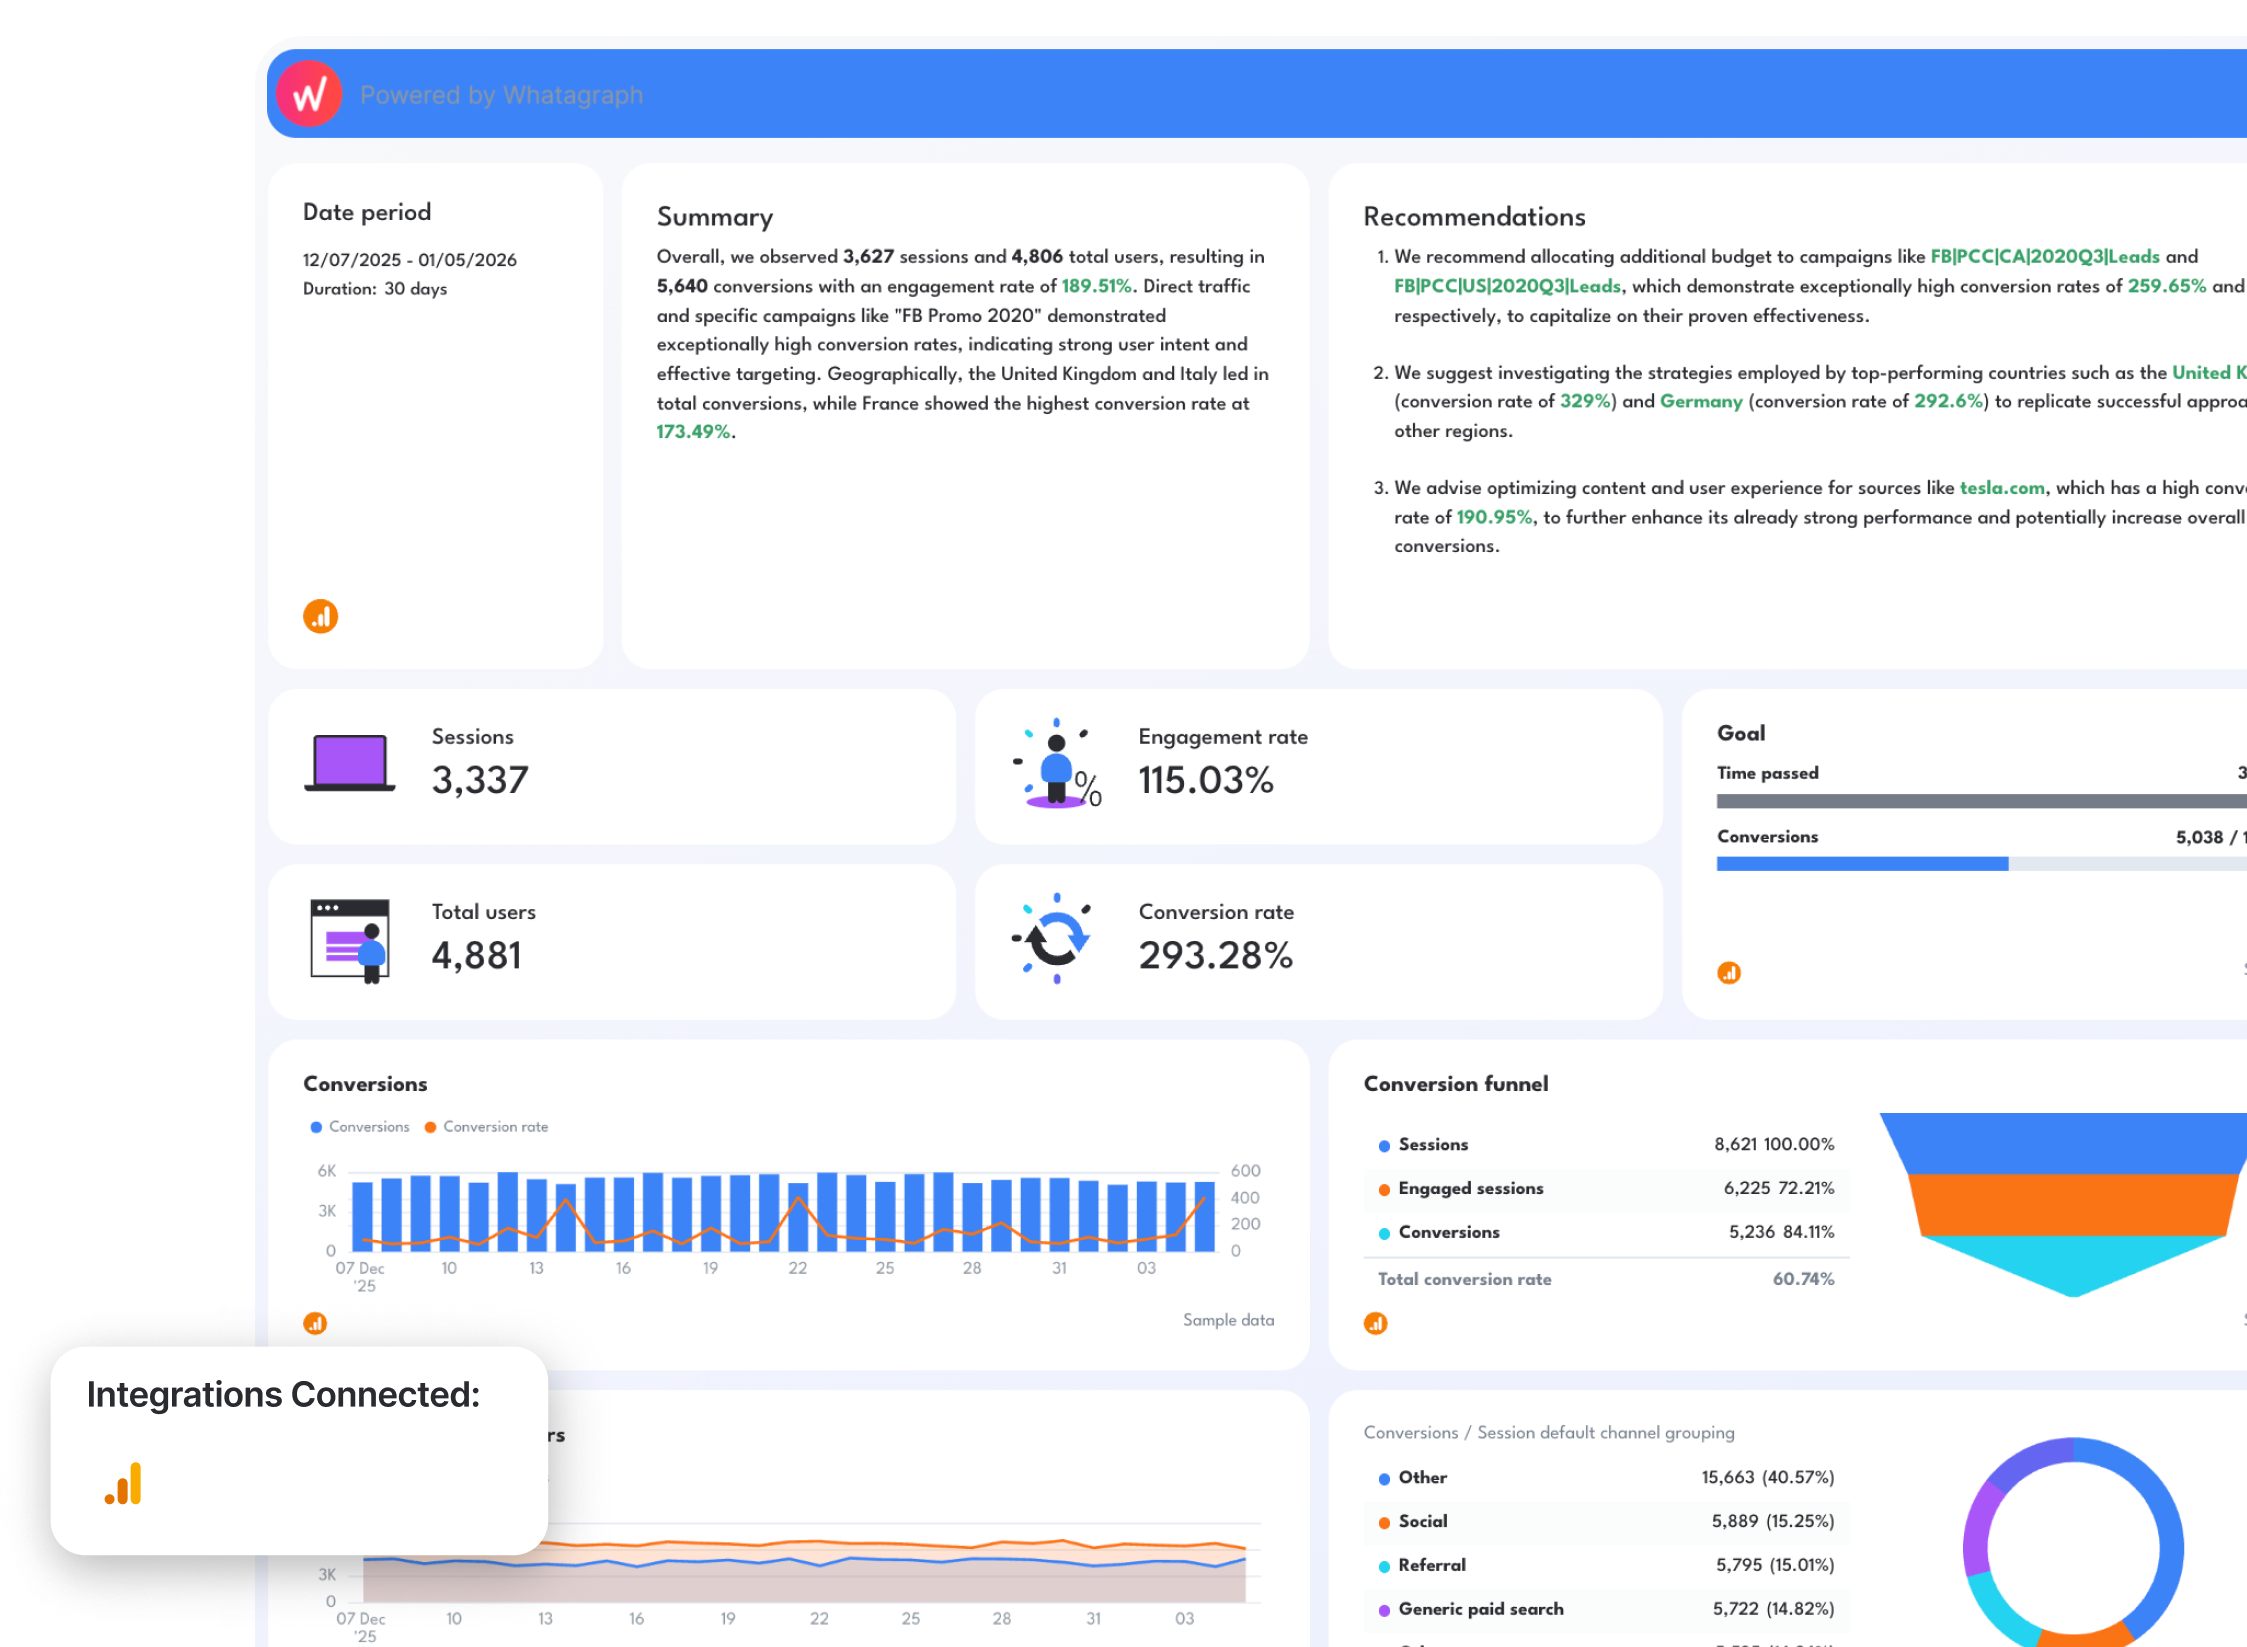
✅ Start the dashboard with four or five key KPI scorecards (sessions, users, engagement rate, conversion rate). This instantly tells stakeholders whether traffic and conversions are trending up or down.
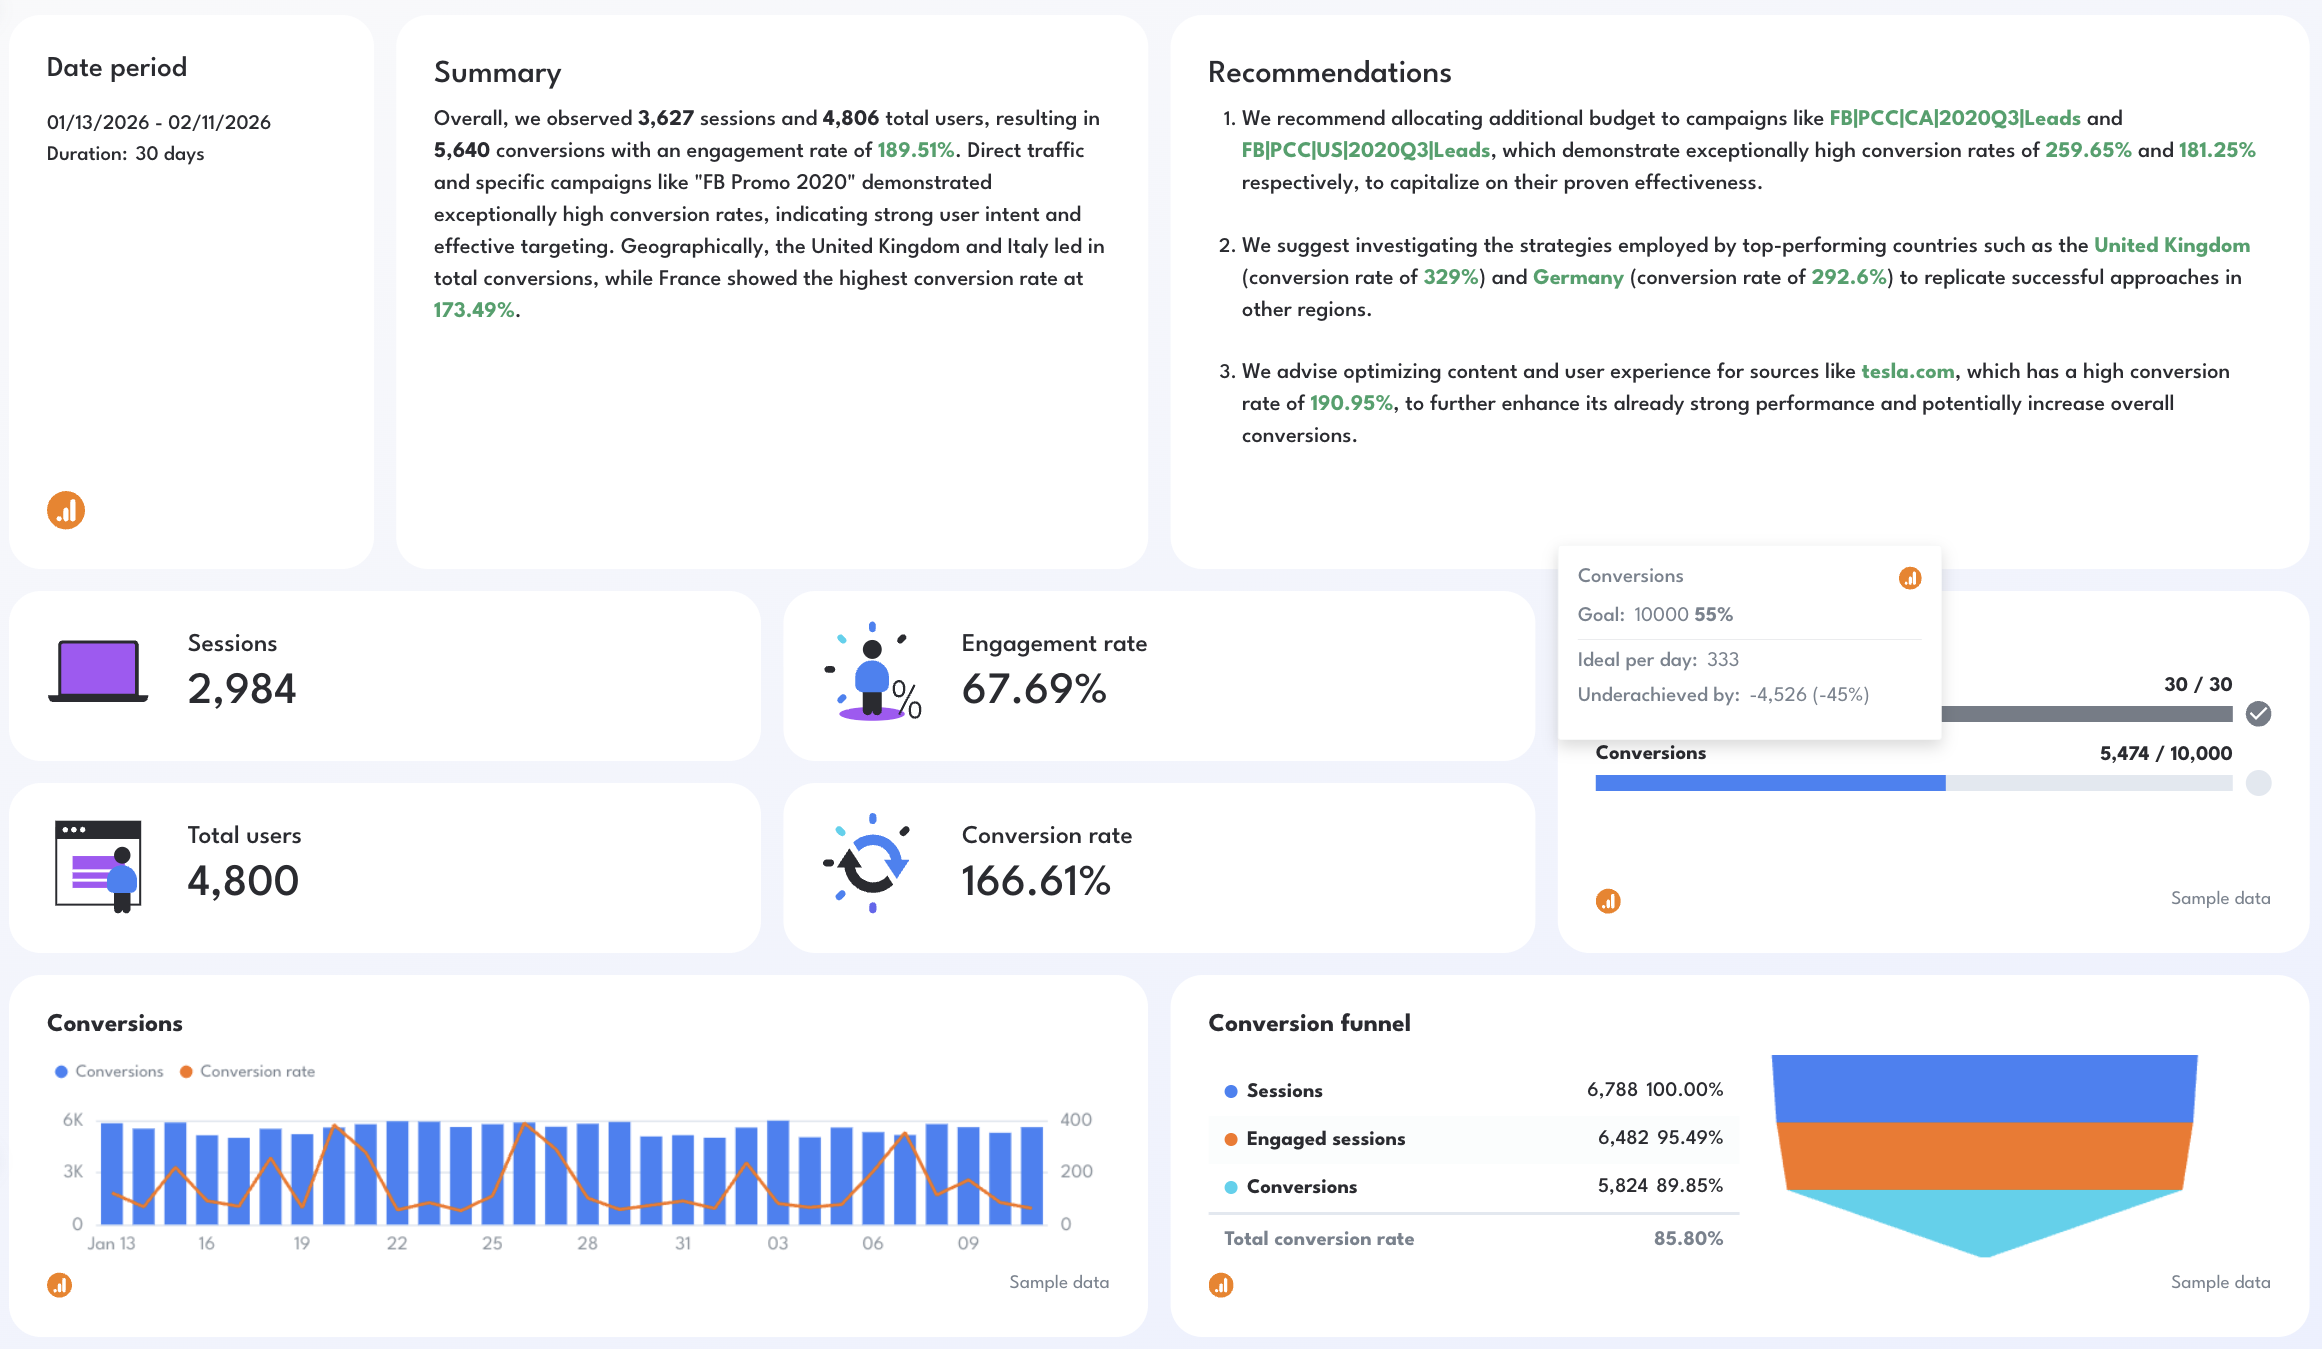
✅ Add a traffic and engagement trend chart to show how users interact with your site over time. This makes it easier to identify spikes from campaigns, launches, or seasonality.
✅ Include a conversion funnel visualization (sessions → engaged sessions → conversions). This helps teams quickly understand where users drop off in the journey.
✅ Use traffic source and campaign tables to compare which channels and campaigns generate the most conversions and highest conversion rates.
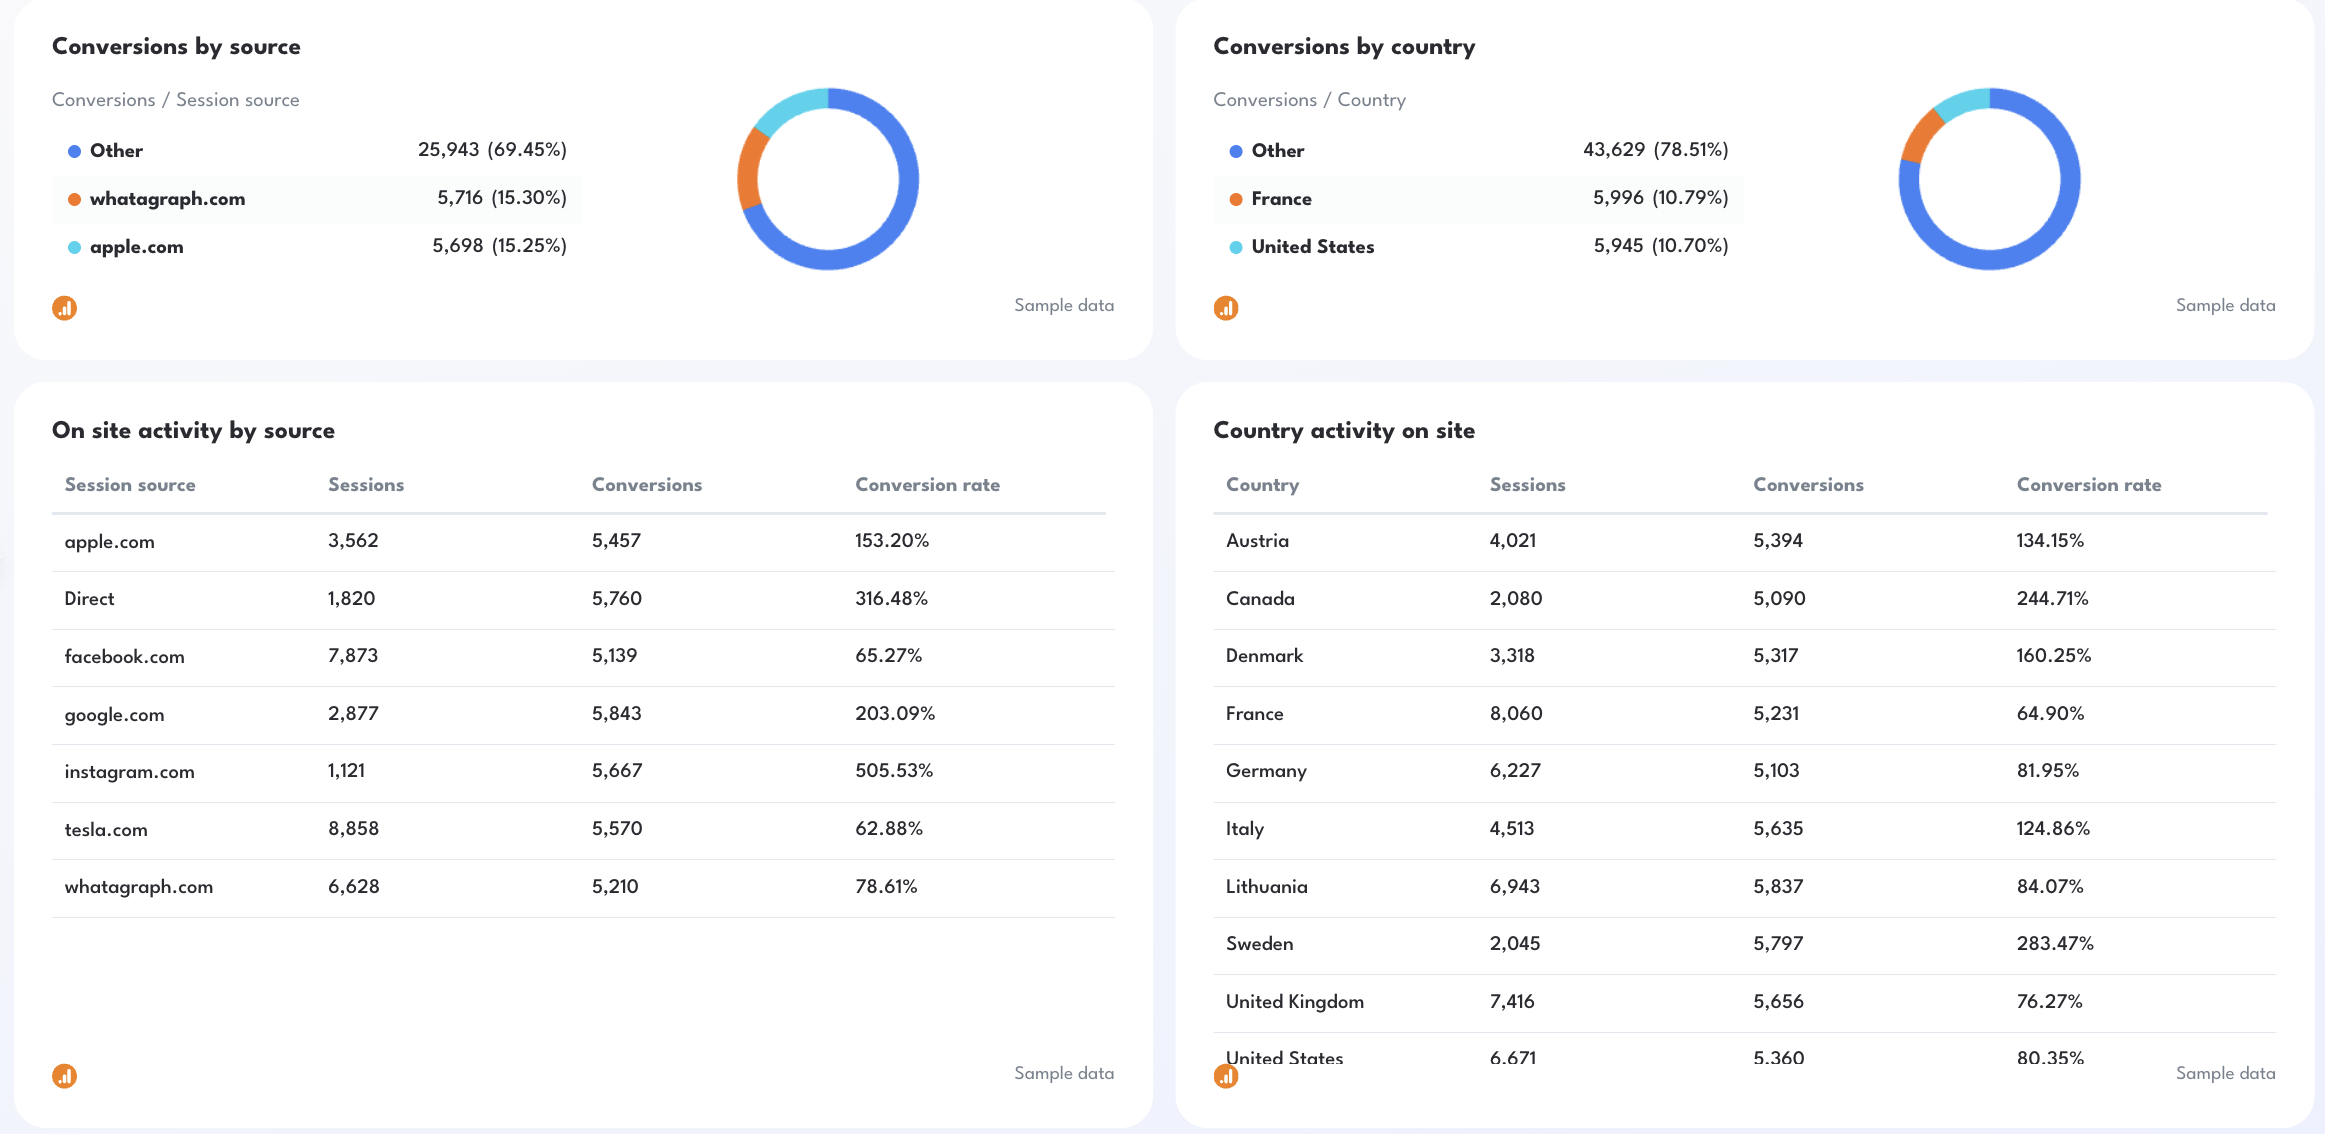
✅ Break down performance by country or region to identify high-converting markets and opportunities for geographic targeting.
2. Google Analytics Marketing Dashboard

Use this example for free with your data
Who it’s for: Marketing managers, CMOs, and agencies running multiple channels who want one unified view of how their marketing efforts contribute to traffic, leads, and revenue.
Channels connected: Google Analytics 4, Google Search Console, Google My Business, Google Ads, Facebook Ads, Facebook, Instagram, Semrush, ActiveCampaign
This Google Analytics marketing dashboard consolidates performance data from all major marketing channels into one place. Instead of reviewing SEO, paid ads, social media, and email performance separately, this dashboard shows how each channel contributes to website traffic, engagement, and conversions.
It allows marketers to compare traffic sources and campaign performance in one Google Analytics dashboard, making it easier to identify which channels drive the most value and which campaigns need optimization.
This dashboard is typically used as a monthly or weekly marketing performance report, helping teams quickly understand marketing impact without manually exporting data from multiple tools.
See also: 9 free digital marketing report templates
How to use:
Metrics to visualize (broken down by dashboard tab):
1️⃣ Marketing Summary
- Total website sessions
- Total users
- Total conversions
- Conversion rate
- Total revenue
- Total ad spend
- Cost per conversion
- Return on ad spend (ROAS)
- Traffic by channel
- Conversions by channel
- Revenue by channel
2️⃣ Website performance
- Total sessions
- Total users
- New users
- Engaged sessions
- Engagement rate
- Average engagement time
- Conversions
- Conversion rate
- Sessions by channel
- Sessions by device
- Top landing pages
- Bounce rate
- User trends over time
3️⃣ SEO
- Organic sessions
- Organic users
- Impressions
- Clicks
- Average search position
- Click-through rate (CTR)
- Top landing pages from organic search
- Organic conversions
- Conversions from organic traffic
- Branded vs non-branded search performance
4️⃣ Google My Business
- Profile views
- Search views
- Map views
- Website clicks
- Direction requests
- Phone calls
- Customer actions over time
- Reviews and ratings
- Engagement by location
5️⃣ Google Ads
- Ad spend
- Impressions
- Clicks
- Click-through rate (CTR)
- Cost per click (CPC)
- Conversions
- Cost per conversion
- Conversion rate
- Campaign performance
- Top performing ads
- Top performing keywords
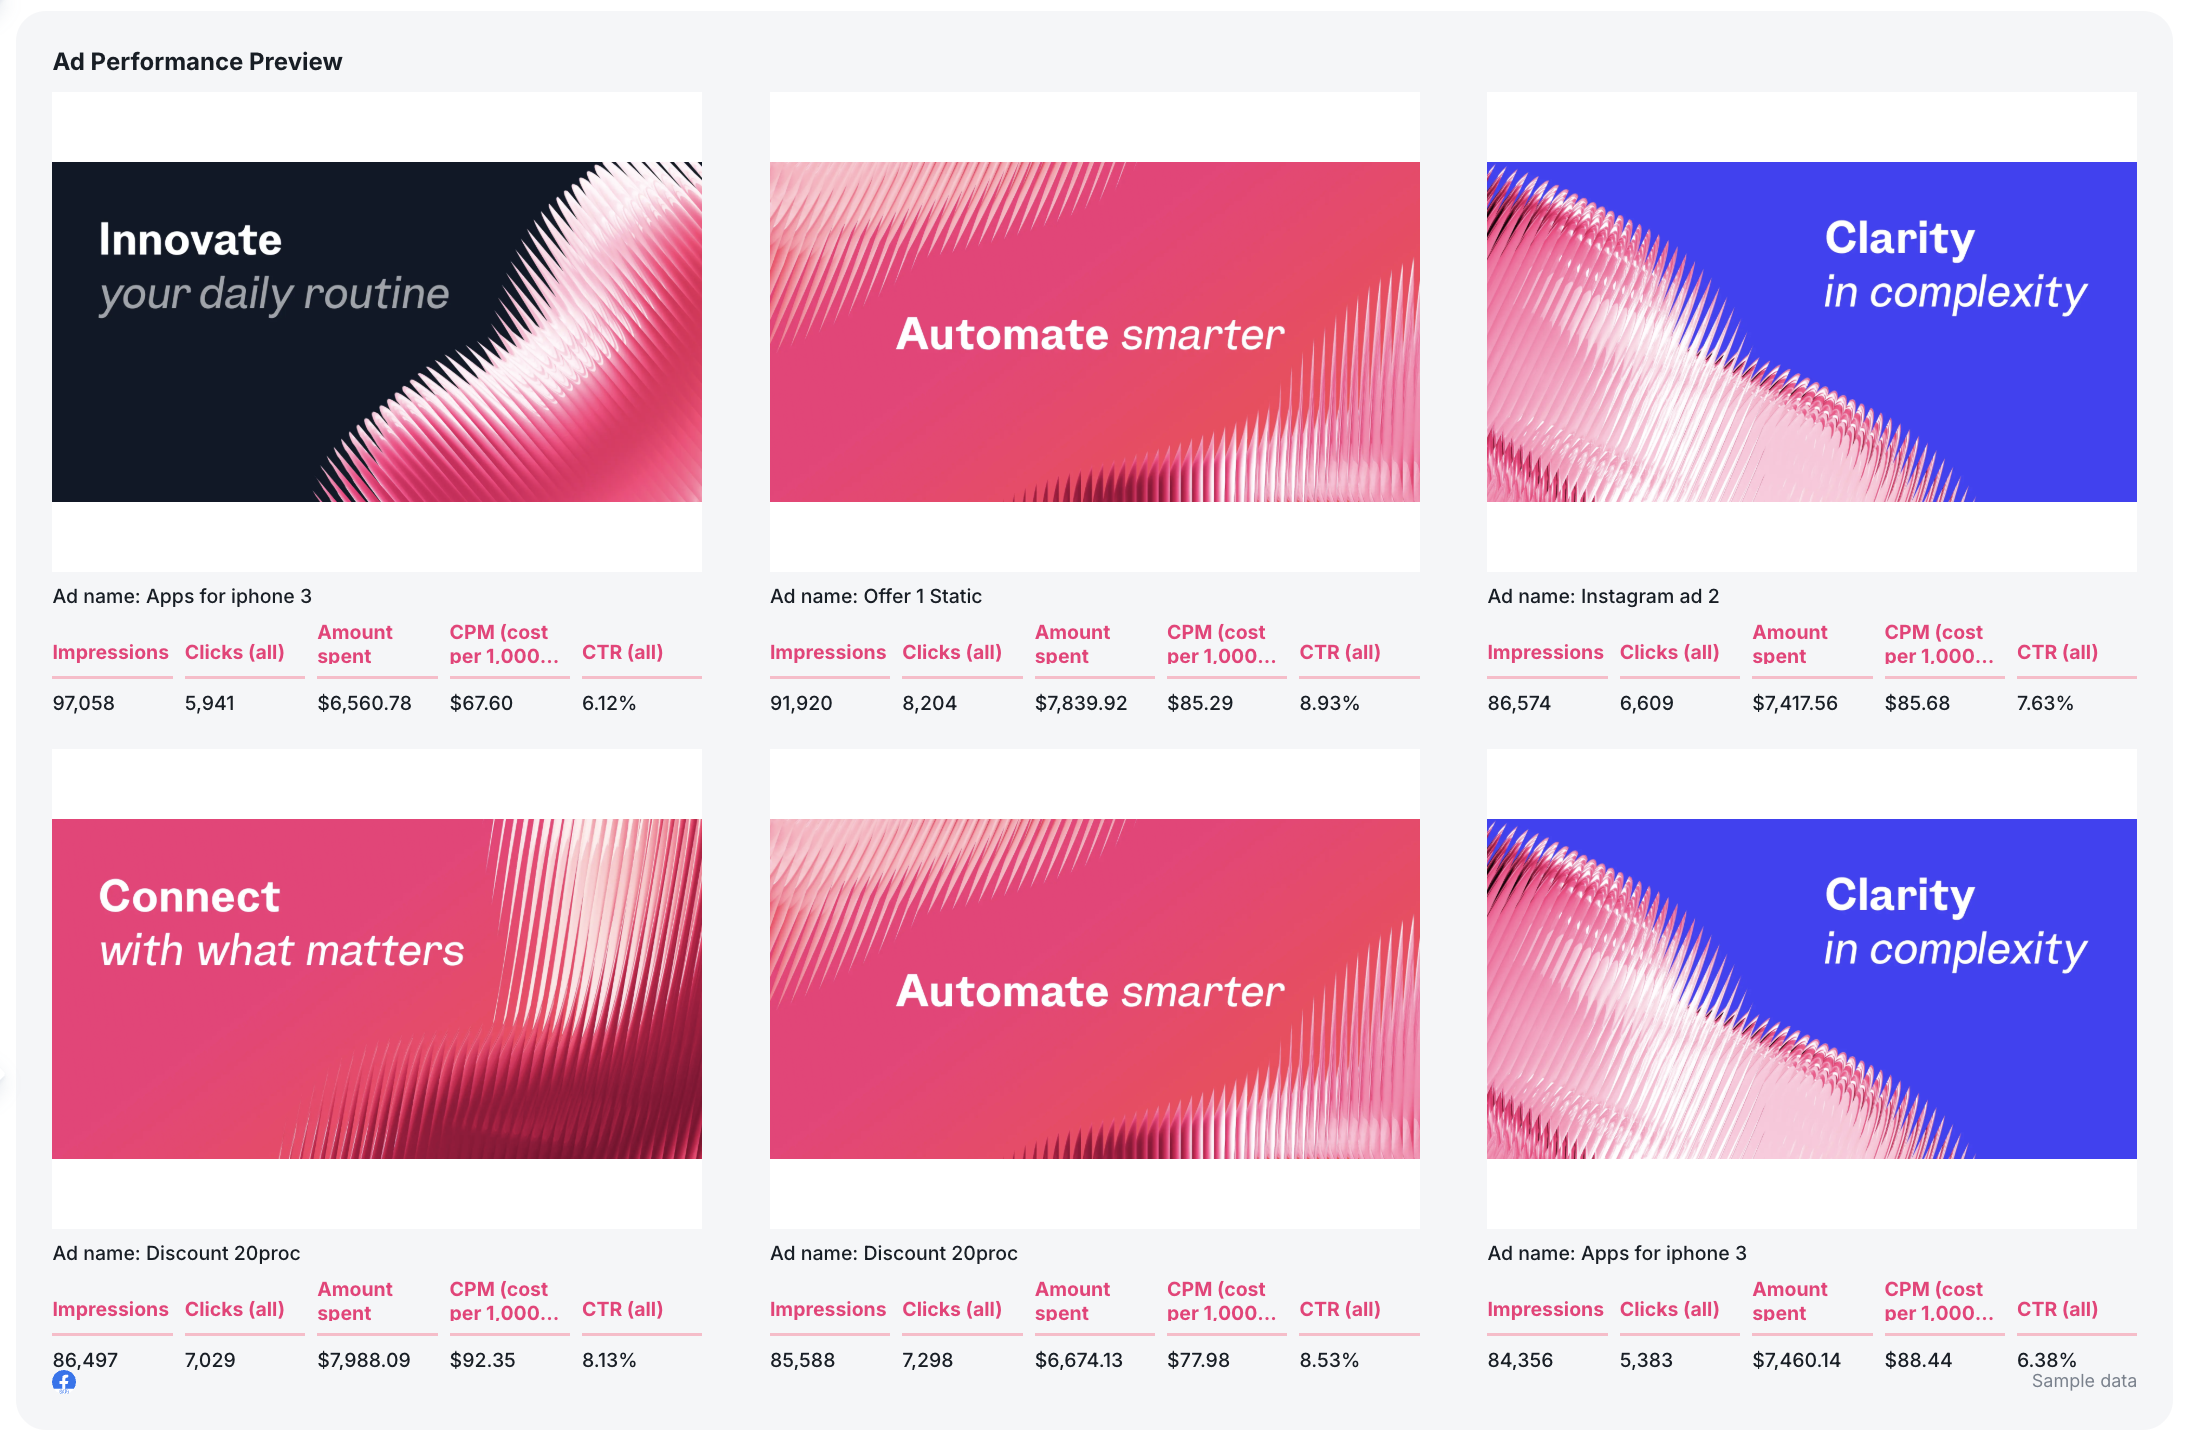
6️⃣ Facebook Ads
- Ad spend
- Impressions
- Reach
- Clicks
- Click-through rate (CTR)
- Cost per click (CPC)
- Conversions
- Cost per conversion
- Conversion rate
- Campaign performance
- Top performing ad sets
7️⃣ Organic social media
- Followers growth
- Reach
- Impressions
- Engagement
- Engagement rate
- Link clicks
- Website traffic from social media
- Top performing posts
- Traffic by social platform
This section helps marketers compare social traffic and engagement across platforms in Google Analytics, identifying which social channels contribute the most website visits and conversions.
8️⃣ Email marketing
- Emails sent
- Open rate
- Click-through rate
- Email clicks
- Website sessions from email
- Conversions from email traffic
- Revenue from email campaigns
- Subscriber growth
- Top performing email campaigns
Best practices:
✅ Agree on key performance indicators with stakeholders before reporting and show these KPIs front and center in the first page of your report.
✅ Separate each marketing channel you're present on into individual tabs so stakeholders can quickly navigate to the channels they care about without scrolling through one long report.
✅ Use Whatagraph IQ Chat to analyze your marketing data in seconds. Just ask any questions you want in natural language and get back instant answers based on your connected data (no hallucinations). Turn IQ Chat on for stakeholders so they can also chat with the data.
✅ Always show traffic, engagement, and conversions together to connect marketing activity with real business results.
✅ Use trend charts and comparison periods (month-over-month over the last 365 days) so marketers can quickly see how campaigns perform over time.
3. Google Analytics SEO Dashboard
Use this example for free with your data
Who it’s for: SEO specialists, content marketers, and agencies that need to track organic search visibility, website traffic, and revenue generated from SEO.
Channels connected: Google Analytics 4, Google Search Console
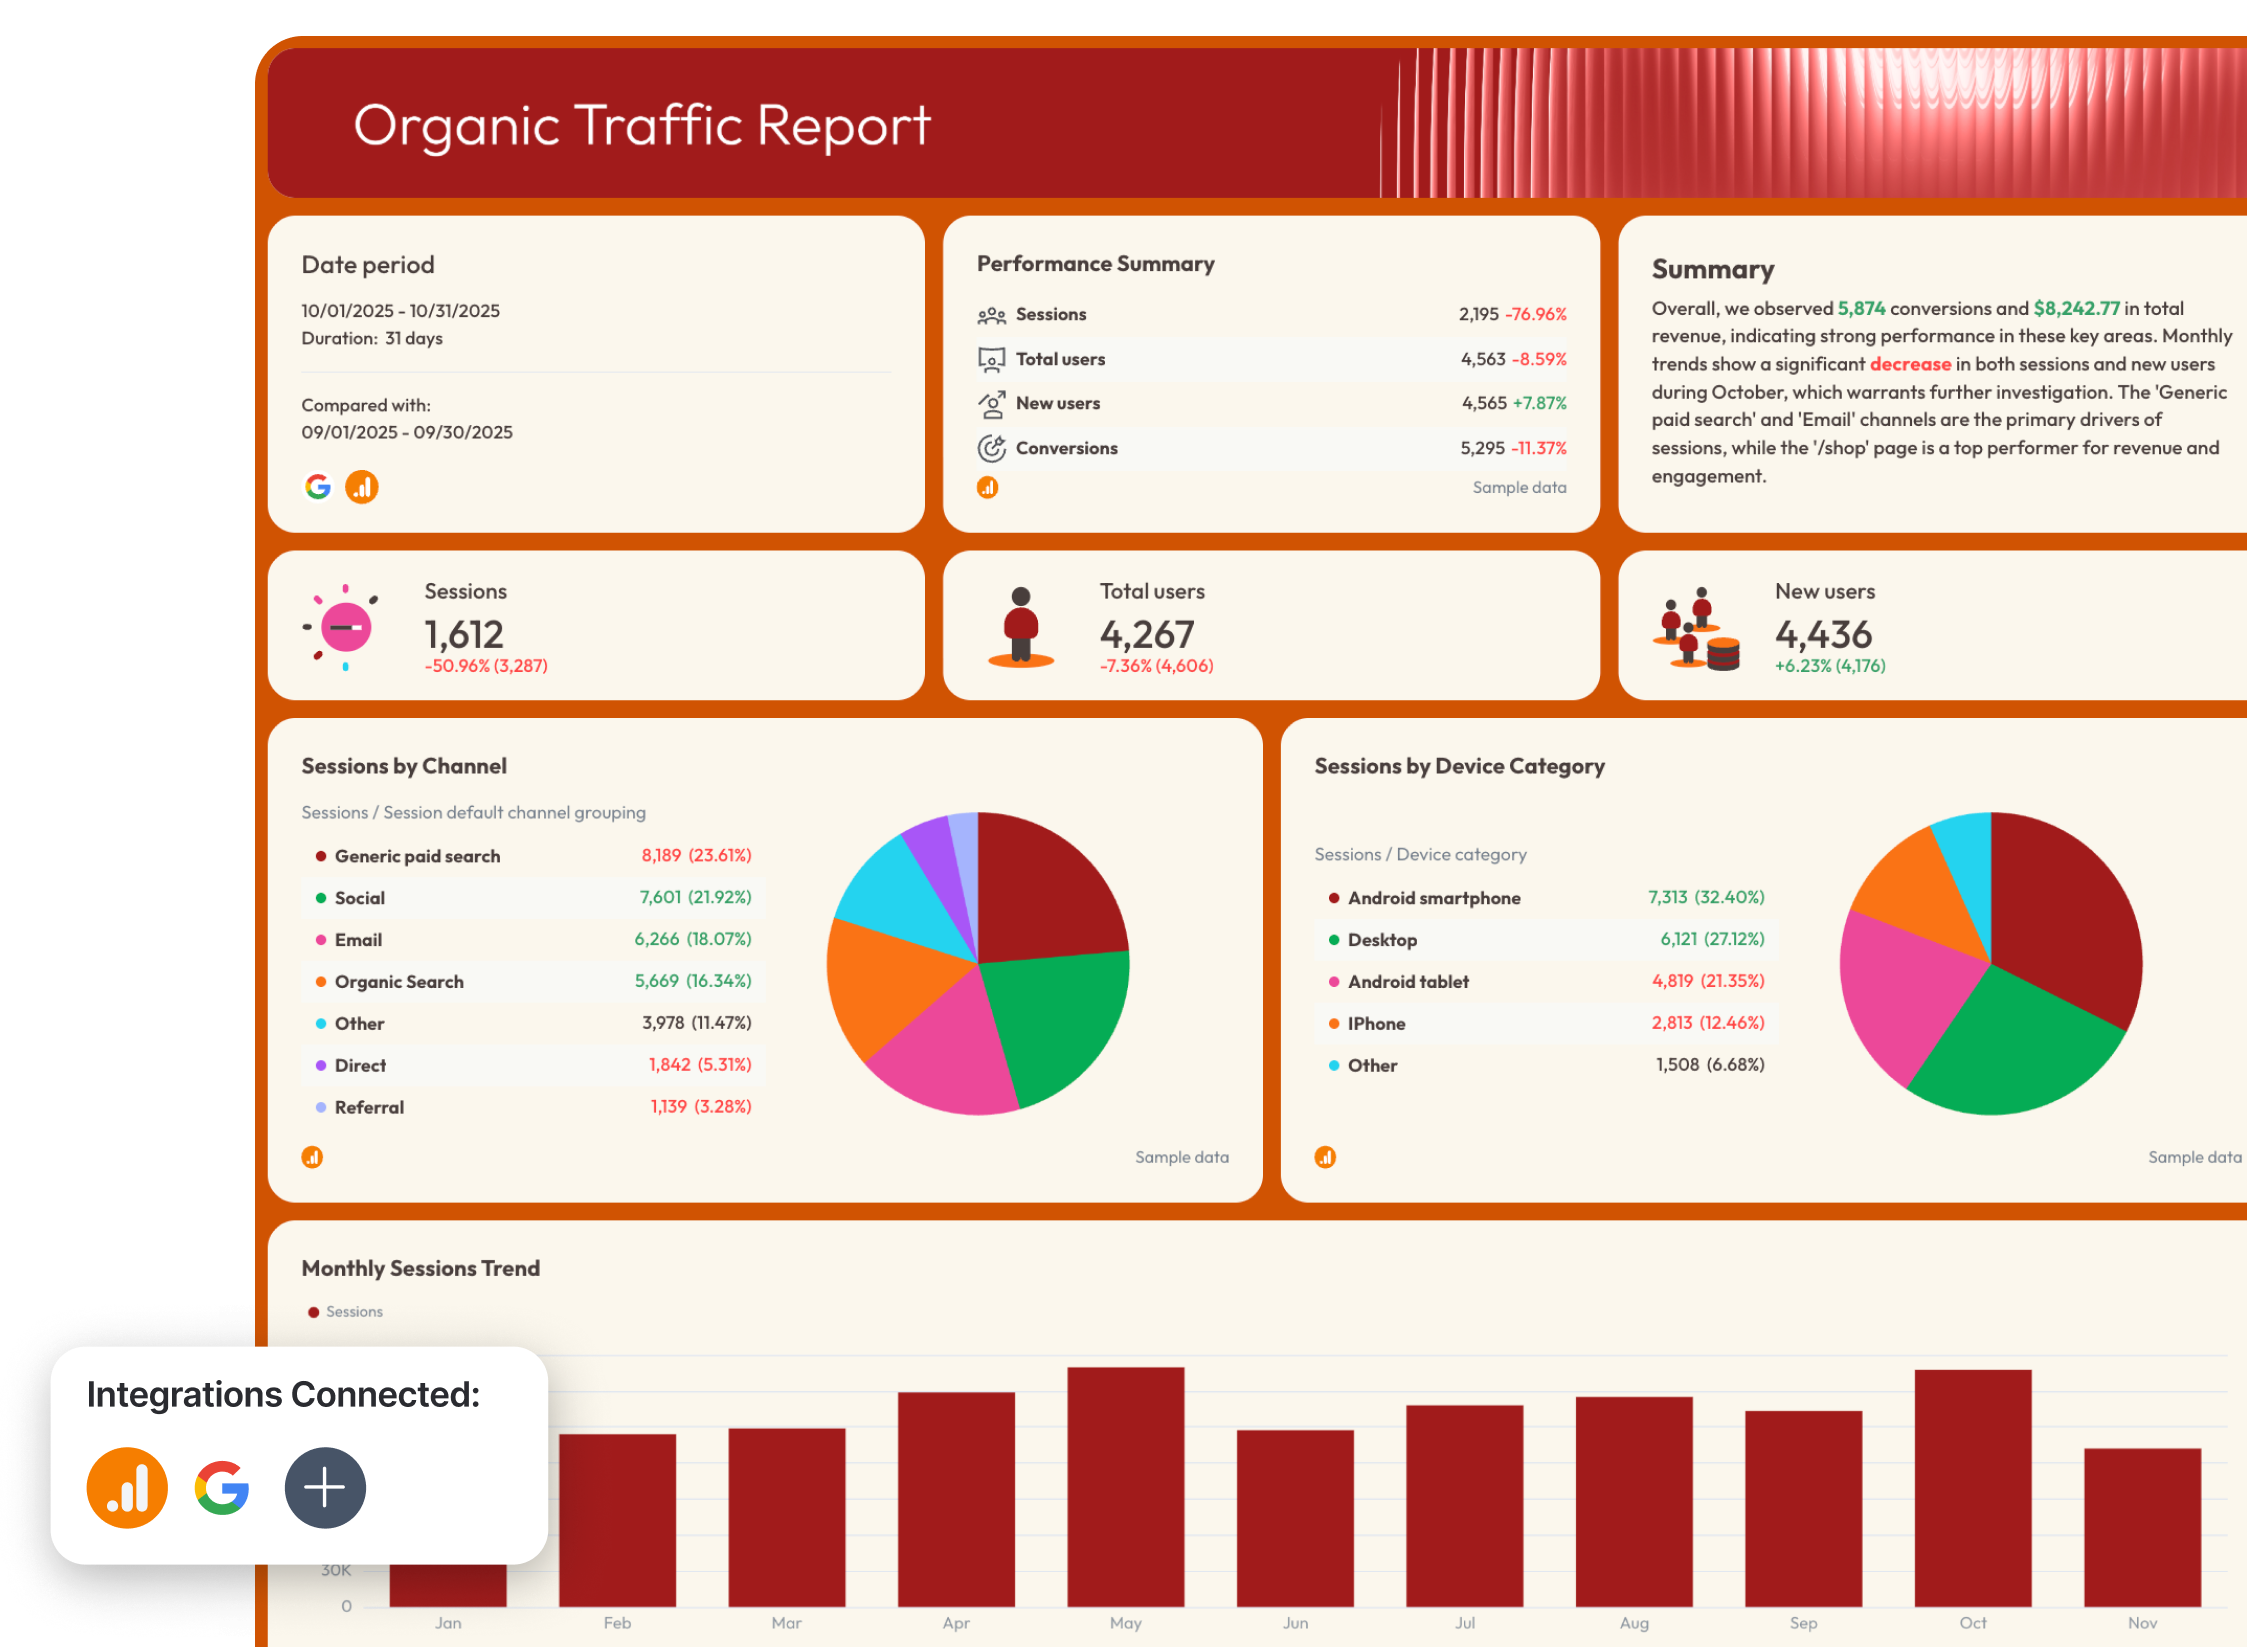
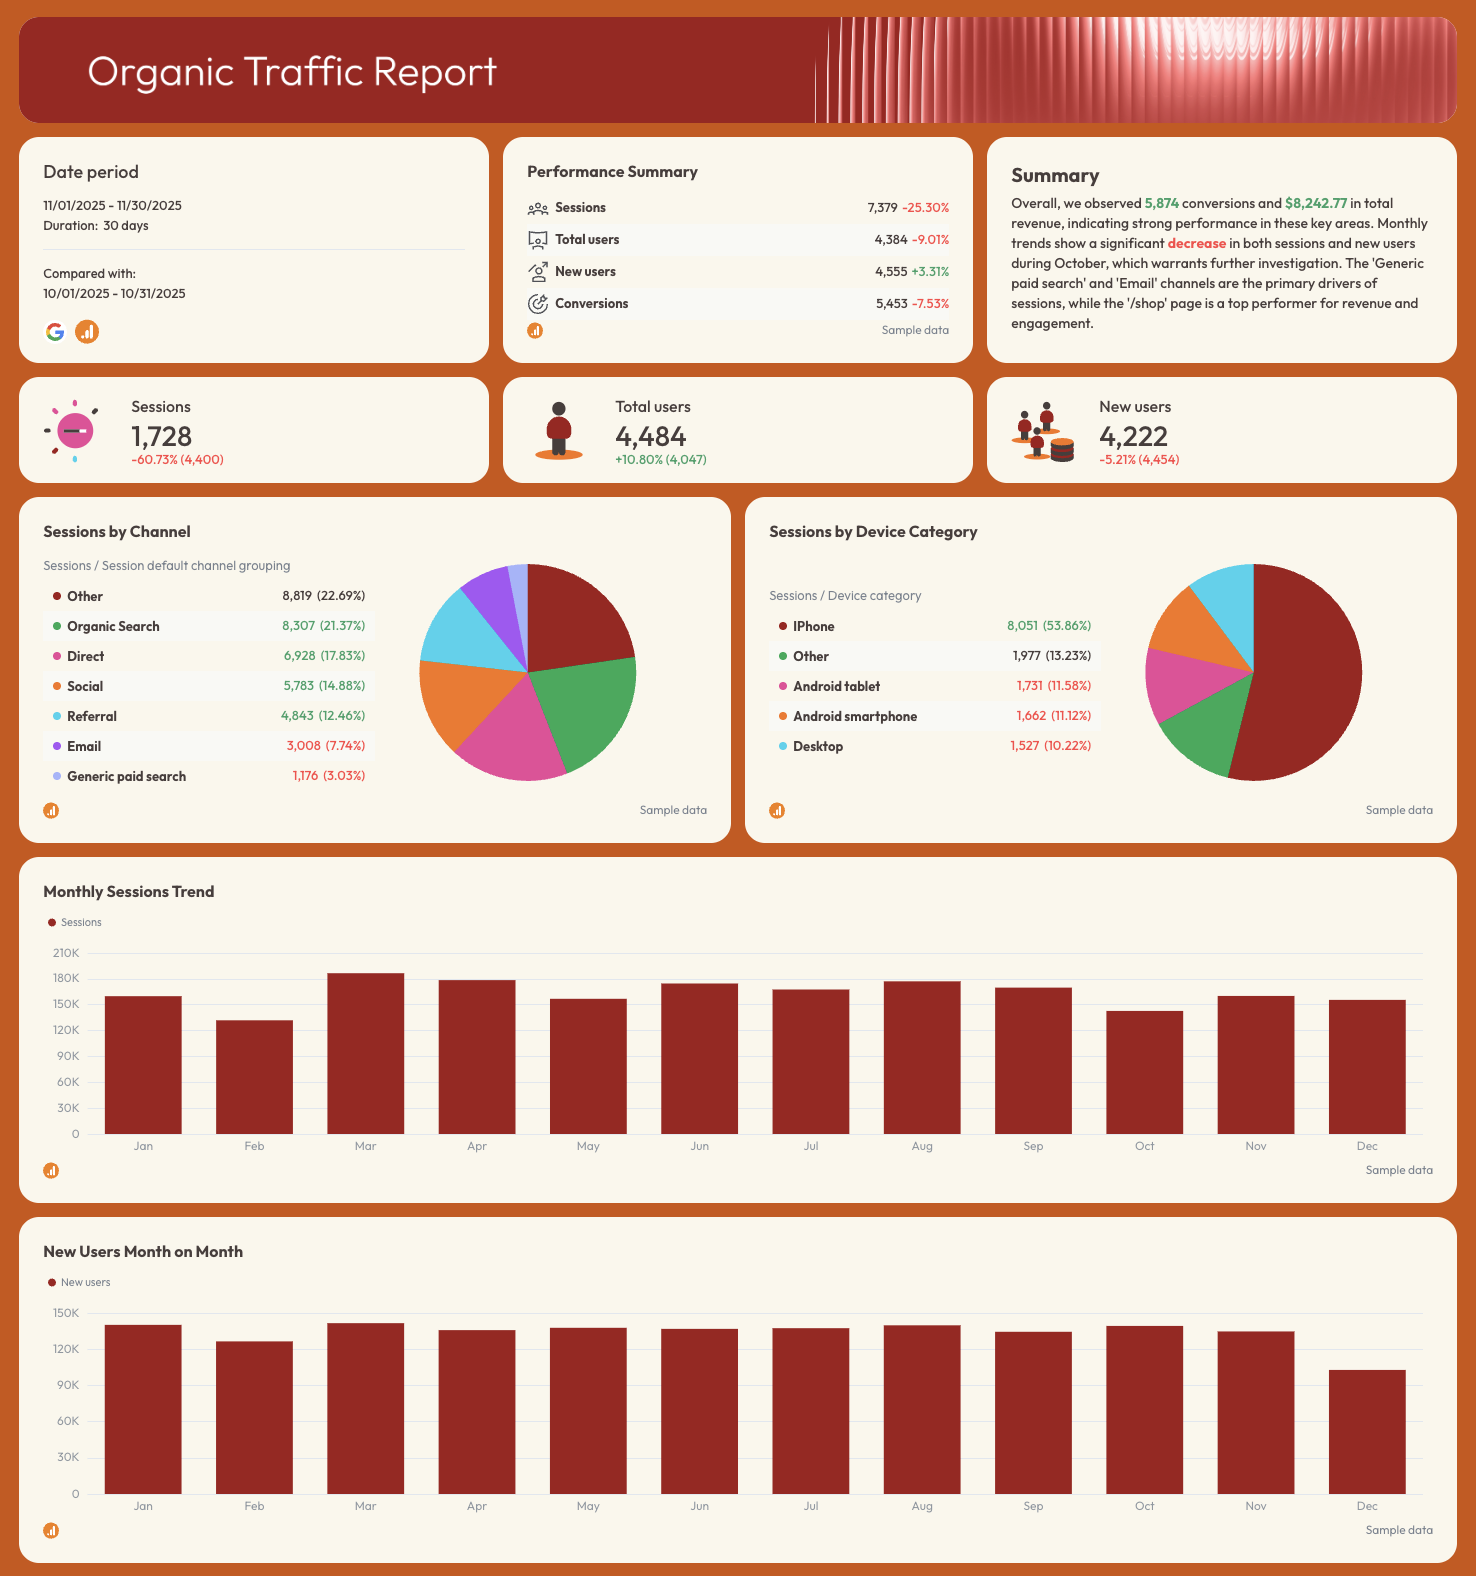
This SEO dashboard for Google Analytics helps marketers monitor how organic search contributes to website traffic, engagement, and conversions.
Instead of jumping between GA4 reports and Google Search Console, this dashboard consolidates visibility, traffic, and conversion metrics into a single view.
It's divided into four clear sections designed to show holistic SEO performance in one place:
- Summary
- Organic Visibility
- Organic Traffic
- Organic Conversions
How to use:
Metrics to visualize (broken down by dashboard tab):
1️⃣ Summary
- Sessions
- Total users
- New users
- Conversions
- Conversion rate
- Total revenue
- Transactions
- Average purchase revenue
- Ecommerce purchases
- Organic search clicks
- Organic search impressions
- Average organic search position
- SEO KPI progress toward goals
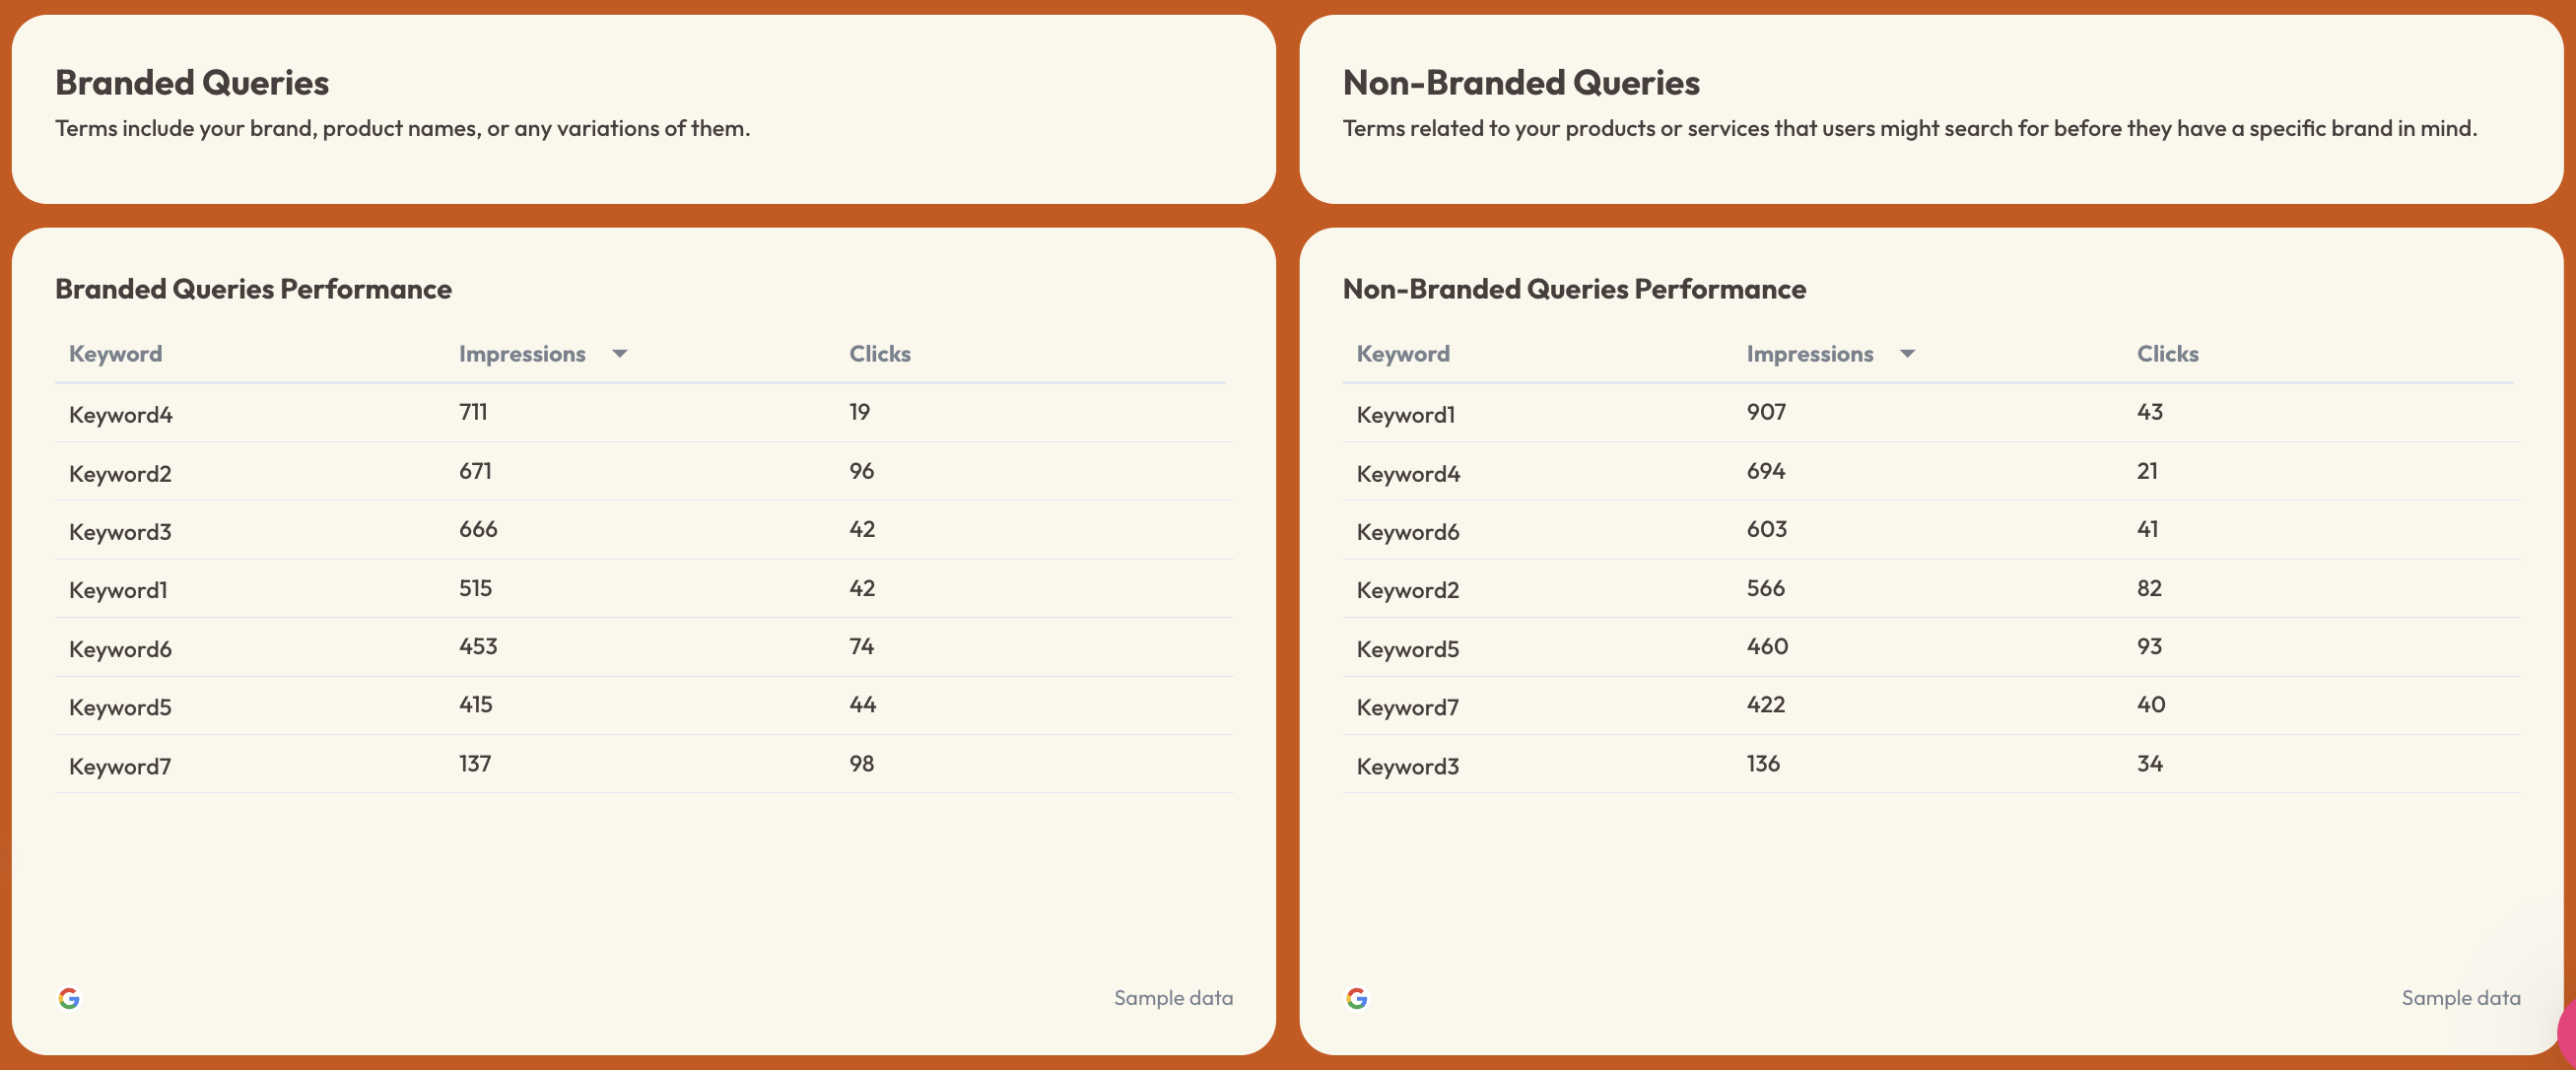
2️⃣ Organic Visibility
- Total impressions
- Total clicks
- Click-through rate (CTR)
- Average search ranking position
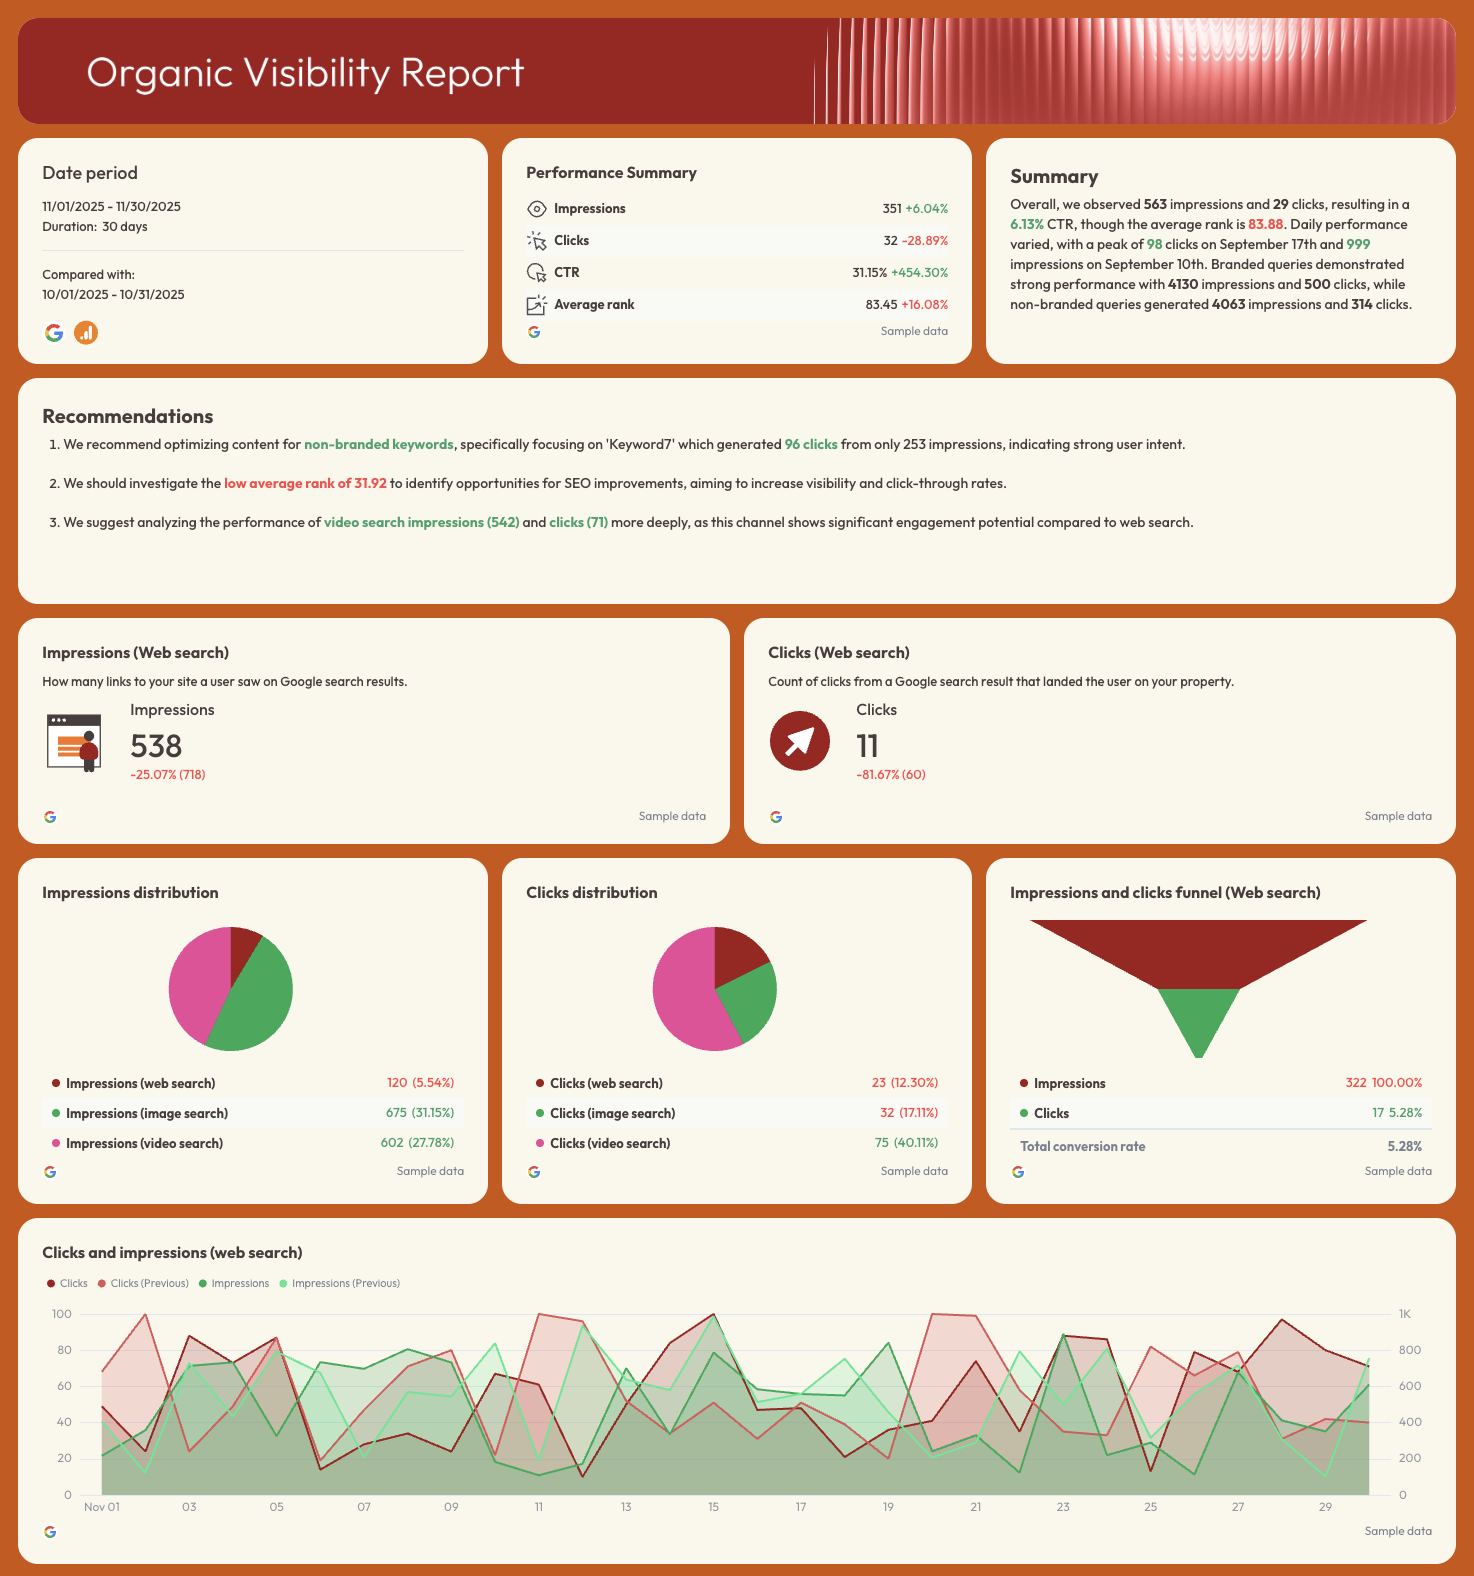
- Clicks vs impressions trend
- Impressions distribution (web, image, video search)
- Clicks distribution by search type
- Branded query impressions
- Branded query clicks
- Non-branded query impressions
- Non-branded query clicks
- Top performing keywords
3️⃣ Organic Traffic
- Organic sessions
- Total users from organic traffic
- New users from organic traffic
- Sessions by channel
- Sessions by device category
- Sessions trend over time
- New users trend over time
- Top landing pages by sessions
- Top pages by engagement rate
- Traffic by device (desktop, mobile, tablet)
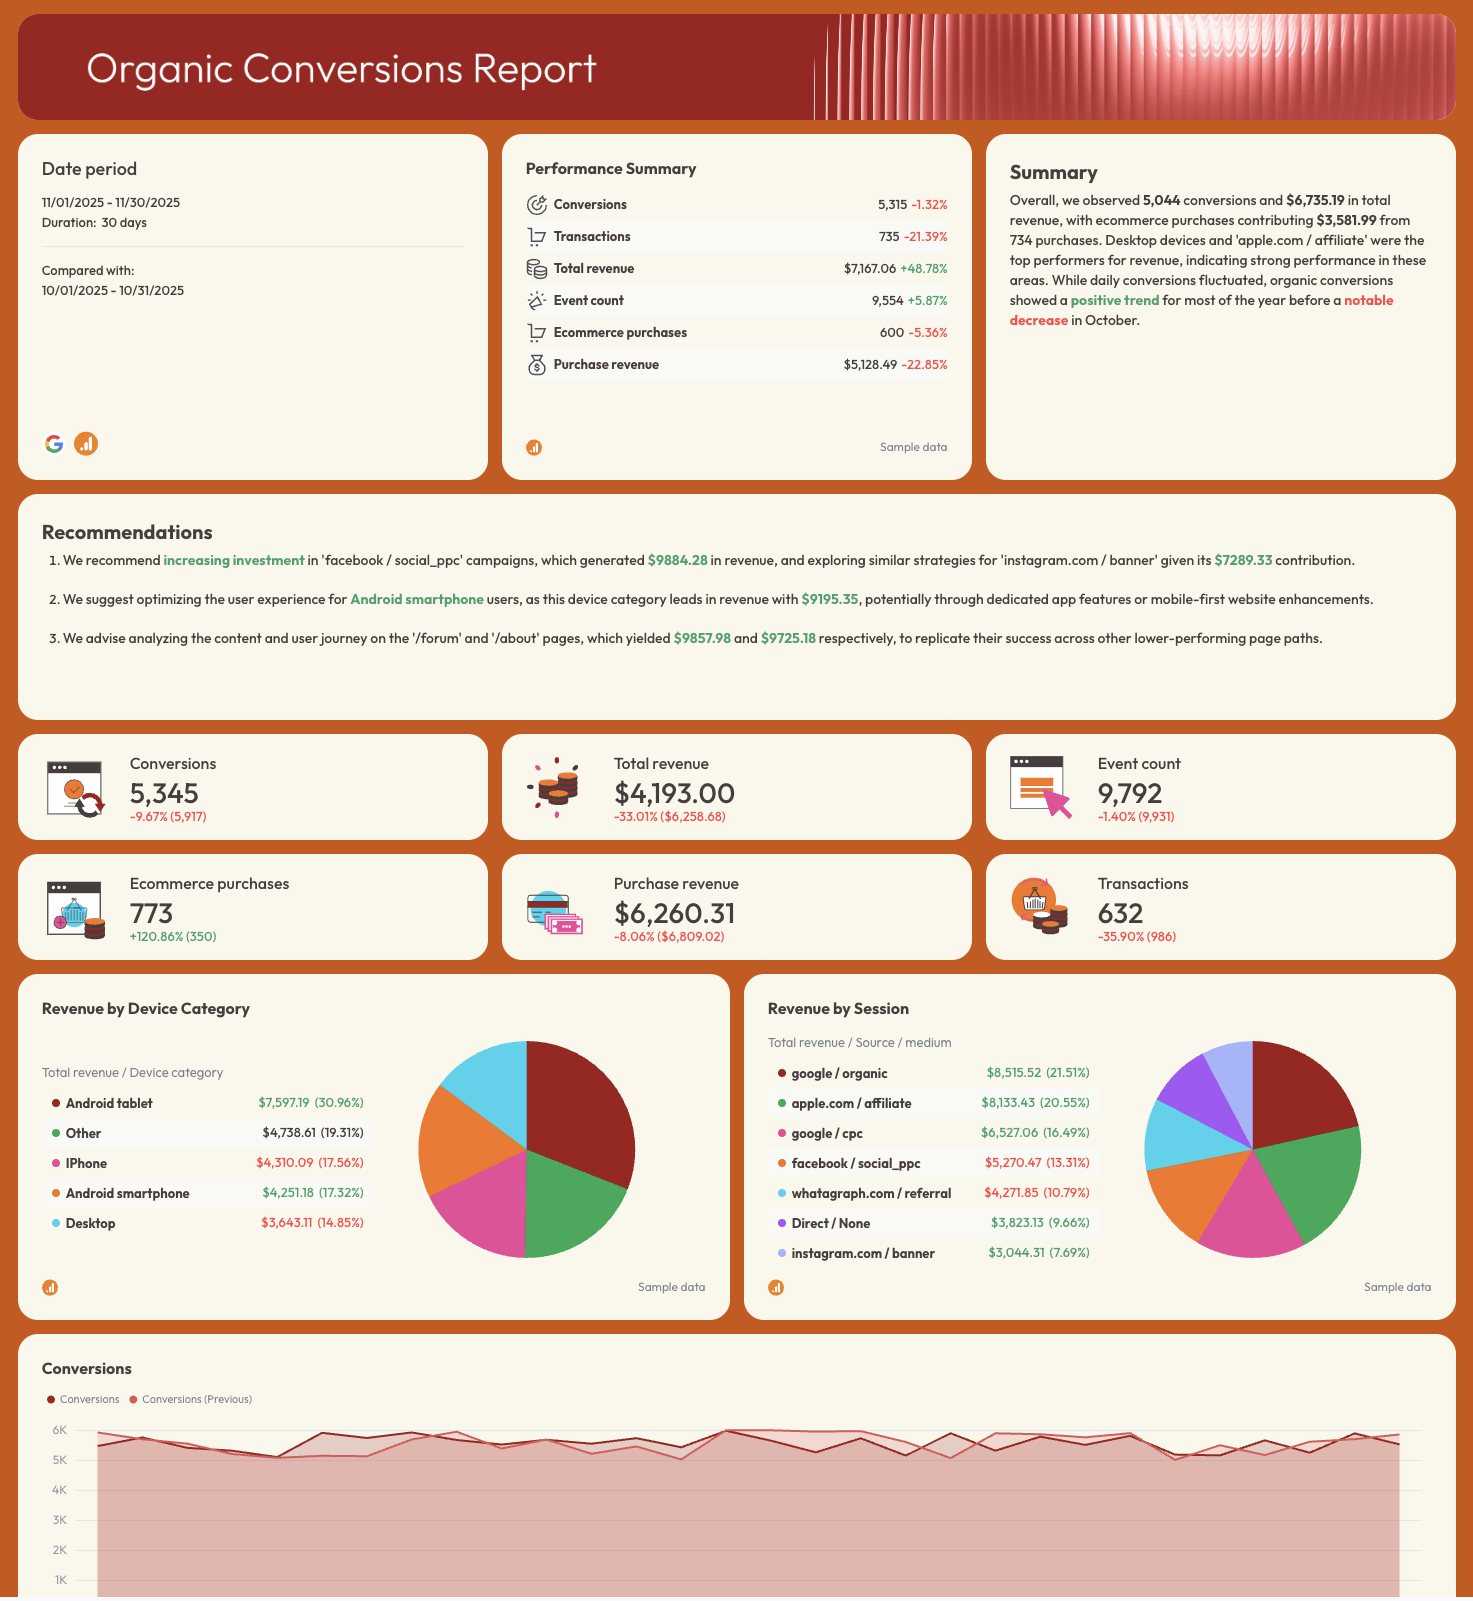
4️⃣ Organic Conversions
- Total conversions from organic traffic
- Conversion trend over time
- Transactions
- Purchase revenue
- Total revenue
- Revenue by device category
- Revenue by source/medium
- Organic conversions by month
- Page path conversions
- Revenue by landing page
- Demographic conversions (city, country, age group)
Best practices:
✅ Use a visibility tab connected to Google Search Console to monitor impressions, clicks, and keyword rankings. This makes it easier to review changes in organic traffic and visibility in Google Analytics alongside search performance.
 ✅ Include a traffic analysis tab to track how organic visitors behave on your website, including sessions, landing page engagement, and device breakdowns.
✅ Add a conversion tab dedicated to revenue and transactions from organic traffic so you can directly connect SEO performance to real business outcomes like leads, purchases, and revenue growth.
✅ Break down branded vs non-branded queries to identify growth opportunities.
 ✅ Style your report in seconds with Whatagraph IQ Theme. Just upload a screenshot of your brandbook/website or write a custom prompt, and Whatagraph will automatically apply the colors to your report. You can still manually finetune the HEX codes and fonts after.
4. Content Marketing Dashboard Google Analytics
Use this example for free with your data
Who it’s for: Content marketers, SEO teams, and agencies that need to understand how blog posts, landing pages, and educational content drive traffic, engagement, and conversions.
Channels connected: Google Analytics 4, Google Search Console, Facebook, Instagram, LinkedIn, Email marketing platforms
This content marketing dashboard Google Analytics helps teams measure how their content performs across organic traffic, social media, and email distribution. Instead of reviewing individual page reports inside GA4, this dashboard consolidates landing page performance, engagement metrics, and traffic sources into one place.
It helps marketers quickly identify which blog posts, guides, and landing pages generate the most traffic and conversions. Teams can also review landing page performance and conversion trends in Google Analytics to understand how content contributes to leads, product signups, or revenue.
Content teams typically review this dashboard monthly to identify top-performing content, discover optimization opportunities, and evaluate how different distribution channels contribute to content growth.
Metrics to visualize (broken down by dashboard tab):
1️⃣ Marketing summary
- Total website sessions
- Total users
- New users
- Total pageviews
- Total conversions
- Conversion rate
- Organic traffic
- Social traffic
- Email traffic
- Top traffic channels
- Top converting channels
- Traffic trend over time
2️⃣ Website performance
- Total sessions
- Total users
- New users
- Engaged sessions
- Engagement rate
- Average engagement time
- Pages per session
- Top landing pages
- Top blog posts by traffic
- Top landing pages by conversions
- User activity trend over time
3️⃣ SEO
- Organic sessions
- Organic users
- Impressions
- Clicks
- Average search position
- Click-through rate (CTR)
- Top pages by organic traffic
- Top pages by impressions
- Top keywords driving traffic
- Conversions from organic traffic
4️⃣ GEO Traffic from AI search engines
- Sessions from ChatGPT referrals
- Sessions from Perplexity referrals
- Sessions from Claude referrals
- Top pages generating AI search traffic
- Engagement rate from AI traffic
- Conversions from AI search traffic
- AI referral traffic trend over time
5️⃣ Facebook
- Post reach
- Post impressions
- Engagement
- Engagement rate
- Link clicks
- Website sessions from Facebook
- Top performing posts
- Traffic from Facebook over time
6️⃣ Instagram
- Impressions
- Reach
- Profile visits
- Engagement
- Engagement rate
- Link clicks
- Website sessions from Instagram
- Top performing posts or reels
7️⃣ LinkedIn
- Post impressions
- Post reach
- Engagement
- Engagement rate
- Link clicks
- Website sessions from LinkedIn
- Top performing posts
- Traffic from LinkedIn over time
8️⃣ ActiveCampaign
- Emails sent
- Open rate
- Click-through rate
- Email clicks
- Website sessions from email
- Conversions from email traffic
- Top performing email campaigns
- Subscriber growth
Best practices:
✅ Start with a marketing summary tab that shows overall content performance across traffic, engagement, and conversions so stakeholders can quickly understand the impact of content marketing.
✅ Include a dedicated landing page analysis section so content teams can clearly see which articles and pages drive the most traffic and conversions.
✅ Track organic search performance alongside engagement metrics to understand which pieces of content rank well and also keep readers engaged.
✅ Show GEO metrics as a separate report tab, in addition to traditional SEO metrics. This helps teams measure how well their content appears in AI-driven search engines like ChatGPT, Perplexity, and Claude.
✅ Include social media and email performance tabs so marketers can clearly see how distribution channels contribute to content traffic and conversions.
5. Google Analytics PPC Dashboard
Use this example for free with your data
Who it’s for: Performance marketers, paid media managers, and agencies running campaigns across multiple advertising platforms who need a single view of paid traffic, spend, and conversions.
Channels connected: Google Analytics 4, Meta Ads, Google Ads, LinkedIn Ads, TikTok Ads
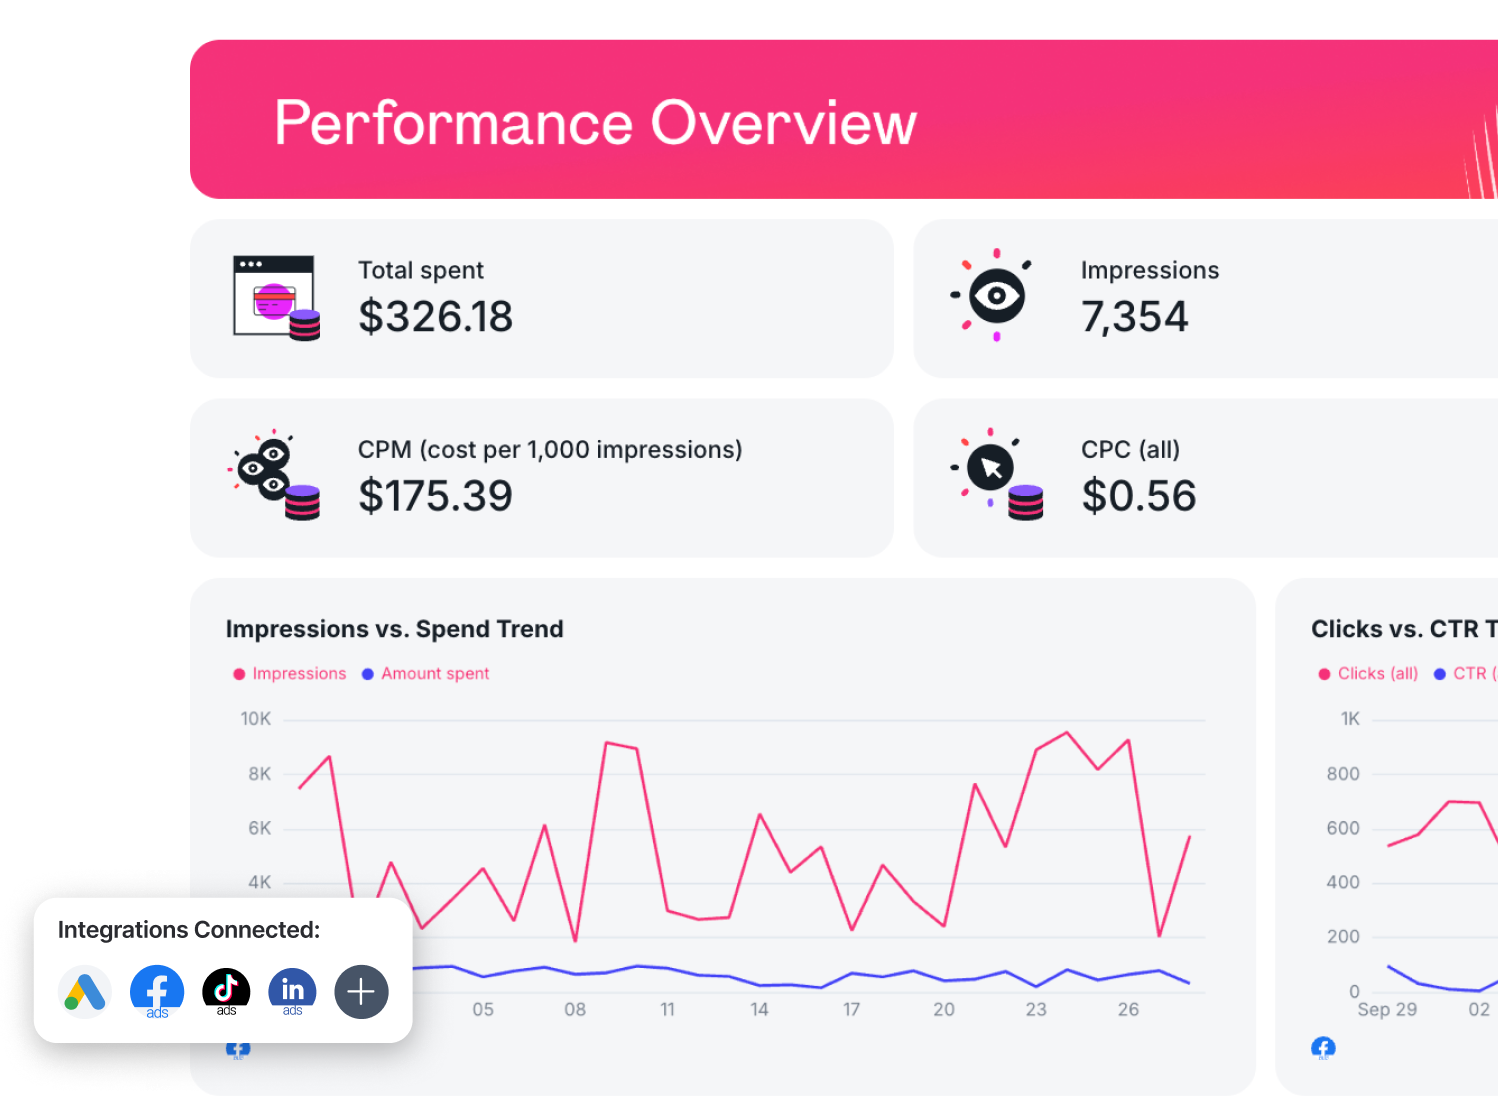
This Google Analytics PPC dashboard helps marketers monitor the performance of paid campaigns across multiple platforms without switching between different ad managers.
It allows teams to quickly compare campaign performance across channels, identify where conversions are coming from, and adjust budgets based on results. The overview tab provides a high-level performance snapshot, while each platform tab breaks down campaign, audience, and ad performance.
See also: 7 PPC reporting examples curated by marketers
How to use:
Metrics to visualize (broken down by dashboard tab):
1️⃣ Overview
- Total ad spend
- Total impressions
- Total clicks
- Total conversions
- Cost per conversion
- Conversion rate
- Clicks by channel
- Impressions by channel
- Conversions by channel
- Spend by channel
- Daily conversions trend
- Conversion funnel (impressions → clicks → conversions)
2️⃣ Meta Ads
- Total spend
- Total impressions
- Total clicks
- Click-through rate (CTR)
- Cost per click (CPC)
- CPM (cost per 1,000 impressions)
- Offsite conversions
- Clicks vs CTR trend
- Impressions vs spend trend
- Campaign performance
- Ad performance
- Audience performance by age
- Audience performance by gender
- Ad placement performance
3️⃣ Google Ads
- Total cost
- Total impressions
- Total clicks
- Average CPC
- CTR
- Average CPM
- Total conversions
- Conversions trend
- Impressions vs cost trend
- Clicks vs cost trend
- Campaign performance
- Ad network performance (Search vs Display)
- Keyword performance
- Ad creative performance
- Landing page performance
4️⃣ LinkedIn Ads
- Total spend
- Total impressions
- Total clicks
- External website conversions
- Cost per conversion
- Return on ad spend (ROAS)
- Conversion rate
- Clicks over time
- Conversions over time
- Top performing campaigns
- Top performing ads
- Audience engagement by job title, seniority, country
5️⃣ TikTok Ads
- Total cost
- Total impressions
- Total clicks
- CTR
- Cost per result
- Total conversions
- Real-time results
- Real-time cost per result
- Video views
- Average watch time
- Video views at 25%, 50%, 75%, and 100%
- Paid engagement metrics (likes, comments, shares, follows)
- Campaign performance
- Ad performance
- Audience performance by age and gender
Best practices:
✅ Start the dashboard with a paid advertising overview tab that summarizes total spend, impressions, clicks, and conversions across all platforms so stakeholders can quickly understand overall campaign performance.
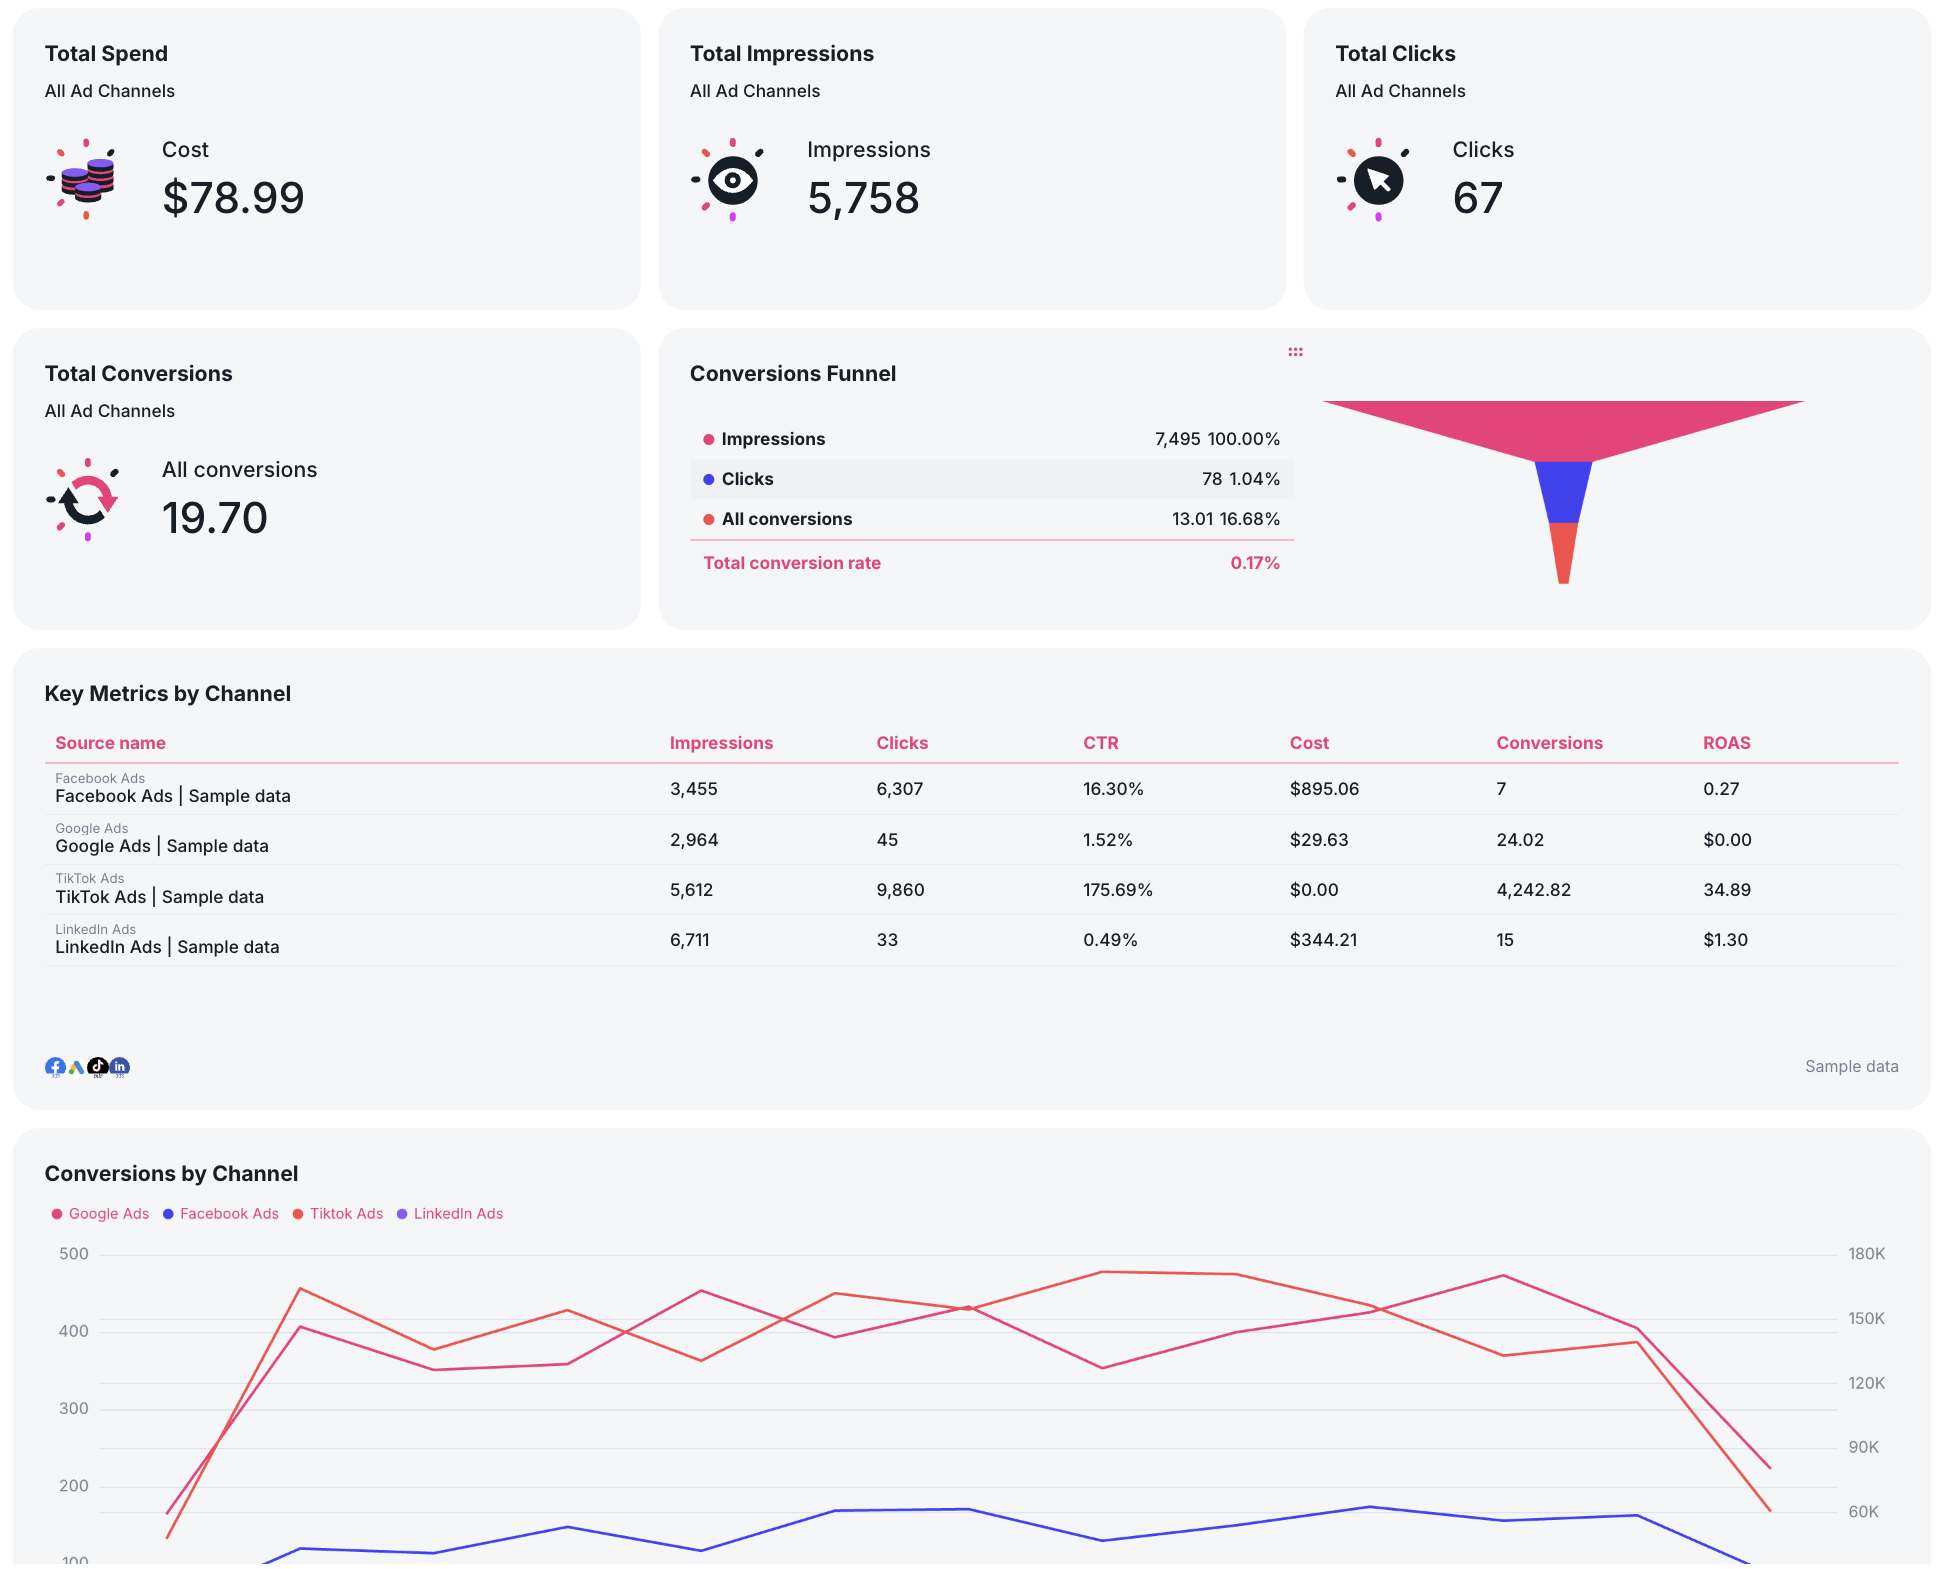
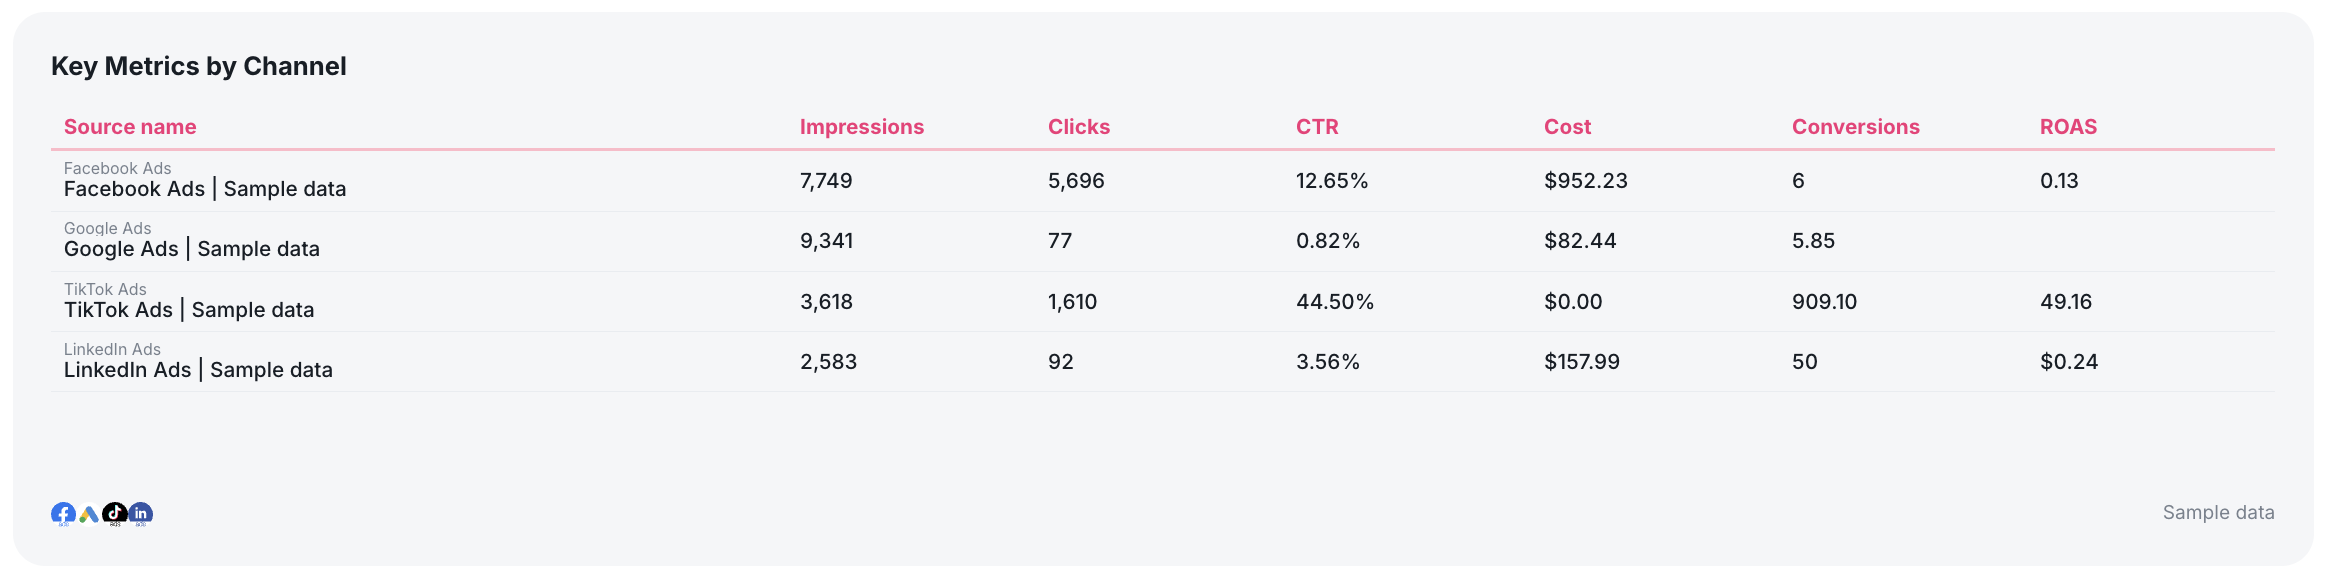
✅ Add a multi-channel breakdown table that compares key metrics across all PPC channels at a glance.
✅ Add a carousel chart on each paid ads channel tab showing top performing ads.
6. Social Media Dashboard Google Analytics

Use this example for free with your data
Who it’s for: Social media managers, marketing teams, and agencies that need to track how social platforms contribute to website traffic, engagement, and brand growth.
Channels connected: Google Analytics 4, Facebook, Instagram, YouTube
This social media dashboard Google Analytics helps marketers understand how social media activity translates into website traffic, audience growth, and engagement.
You can compare social traffic and engagement across platforms in Google Analytics while also monitoring audience growth and content performance. Social media teams can quickly identify which posts, videos, or campaigns generate the most engagement and website visits.
The example dashboard includes platform-level reports for Instagram, Facebook, and YouTube, showing audience growth, reach, engagement metrics, and top-performing content.
How to use:
Metrics to visualize:
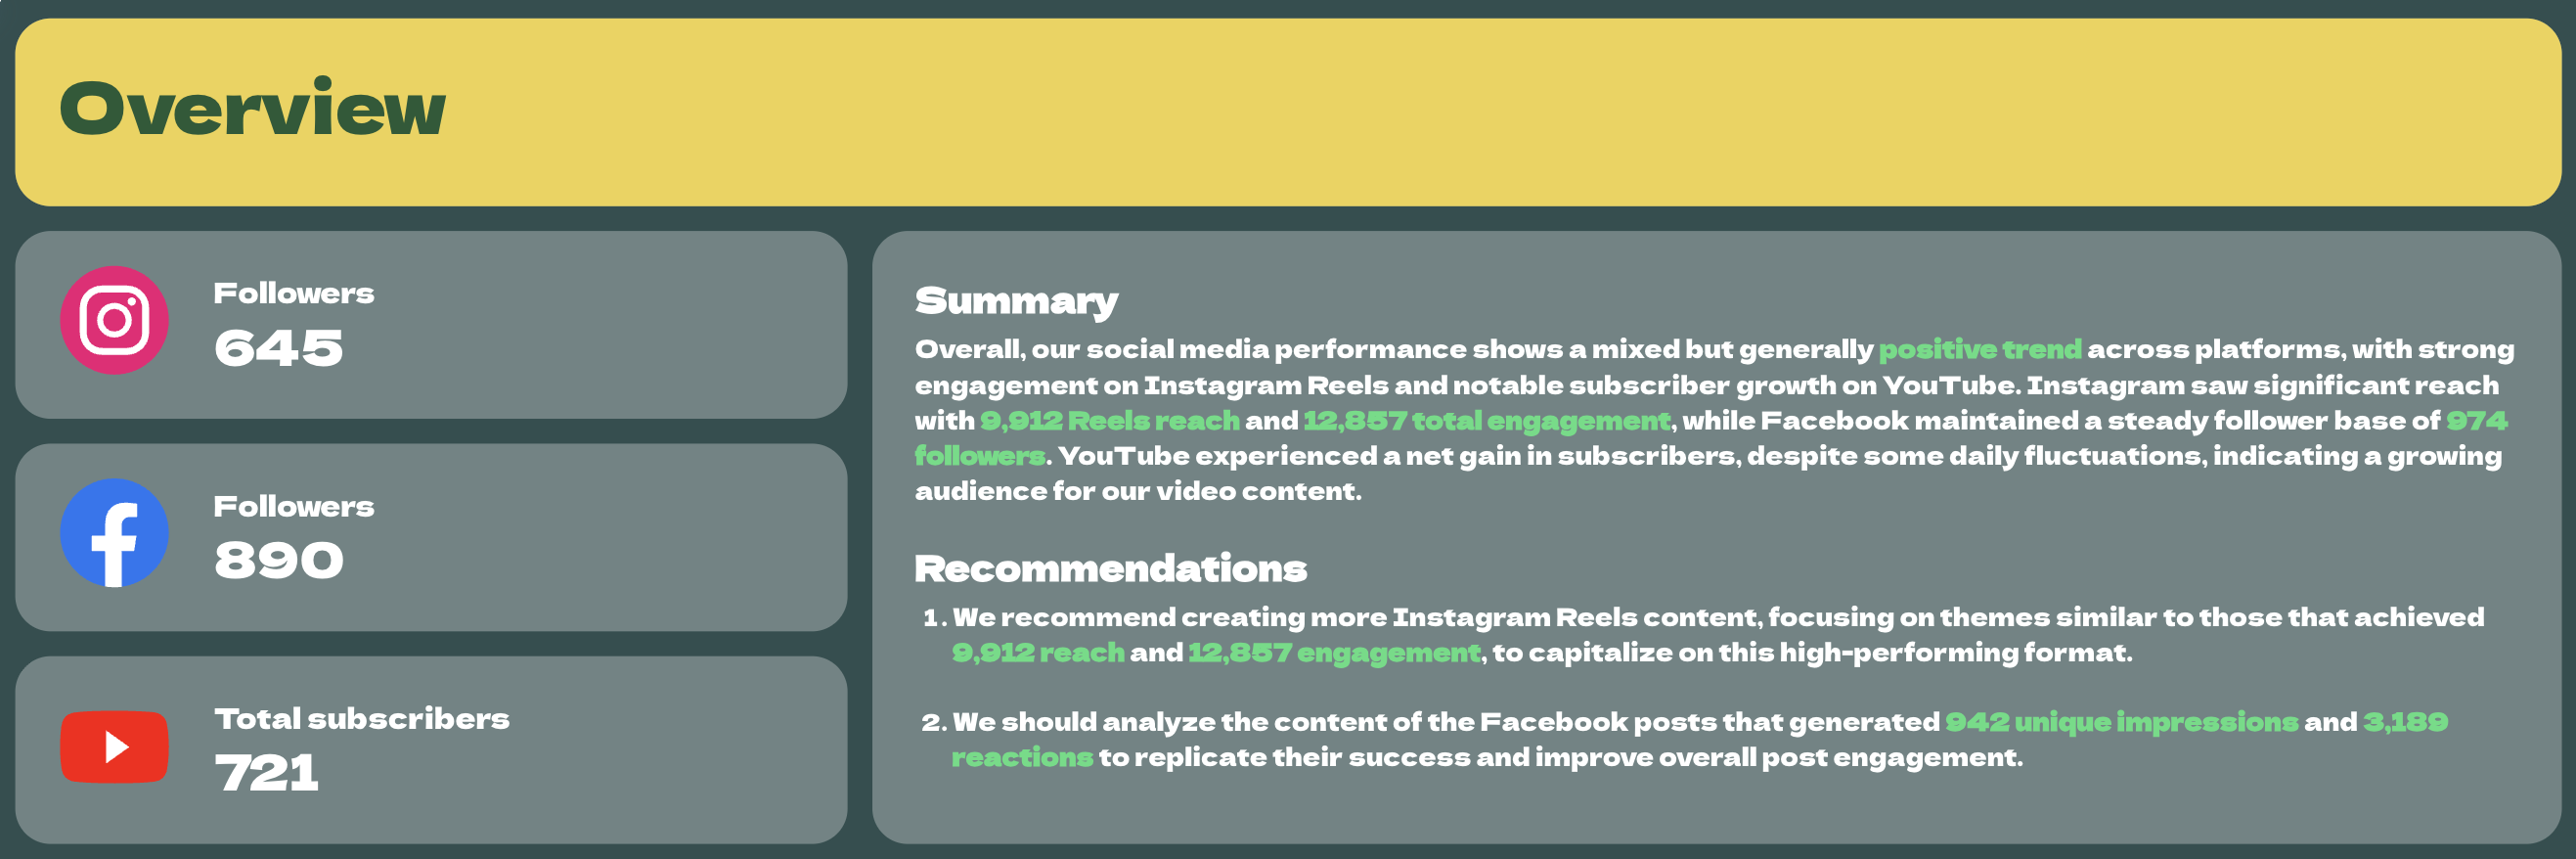
1️⃣ Overview
- Total followers across social platforms
- Total reach
- Total impressions
- Total engagements
- Total website sessions from social media
- Social traffic trend over time
- Top performing social platforms
- Top performing posts across channels
- Follower growth over time
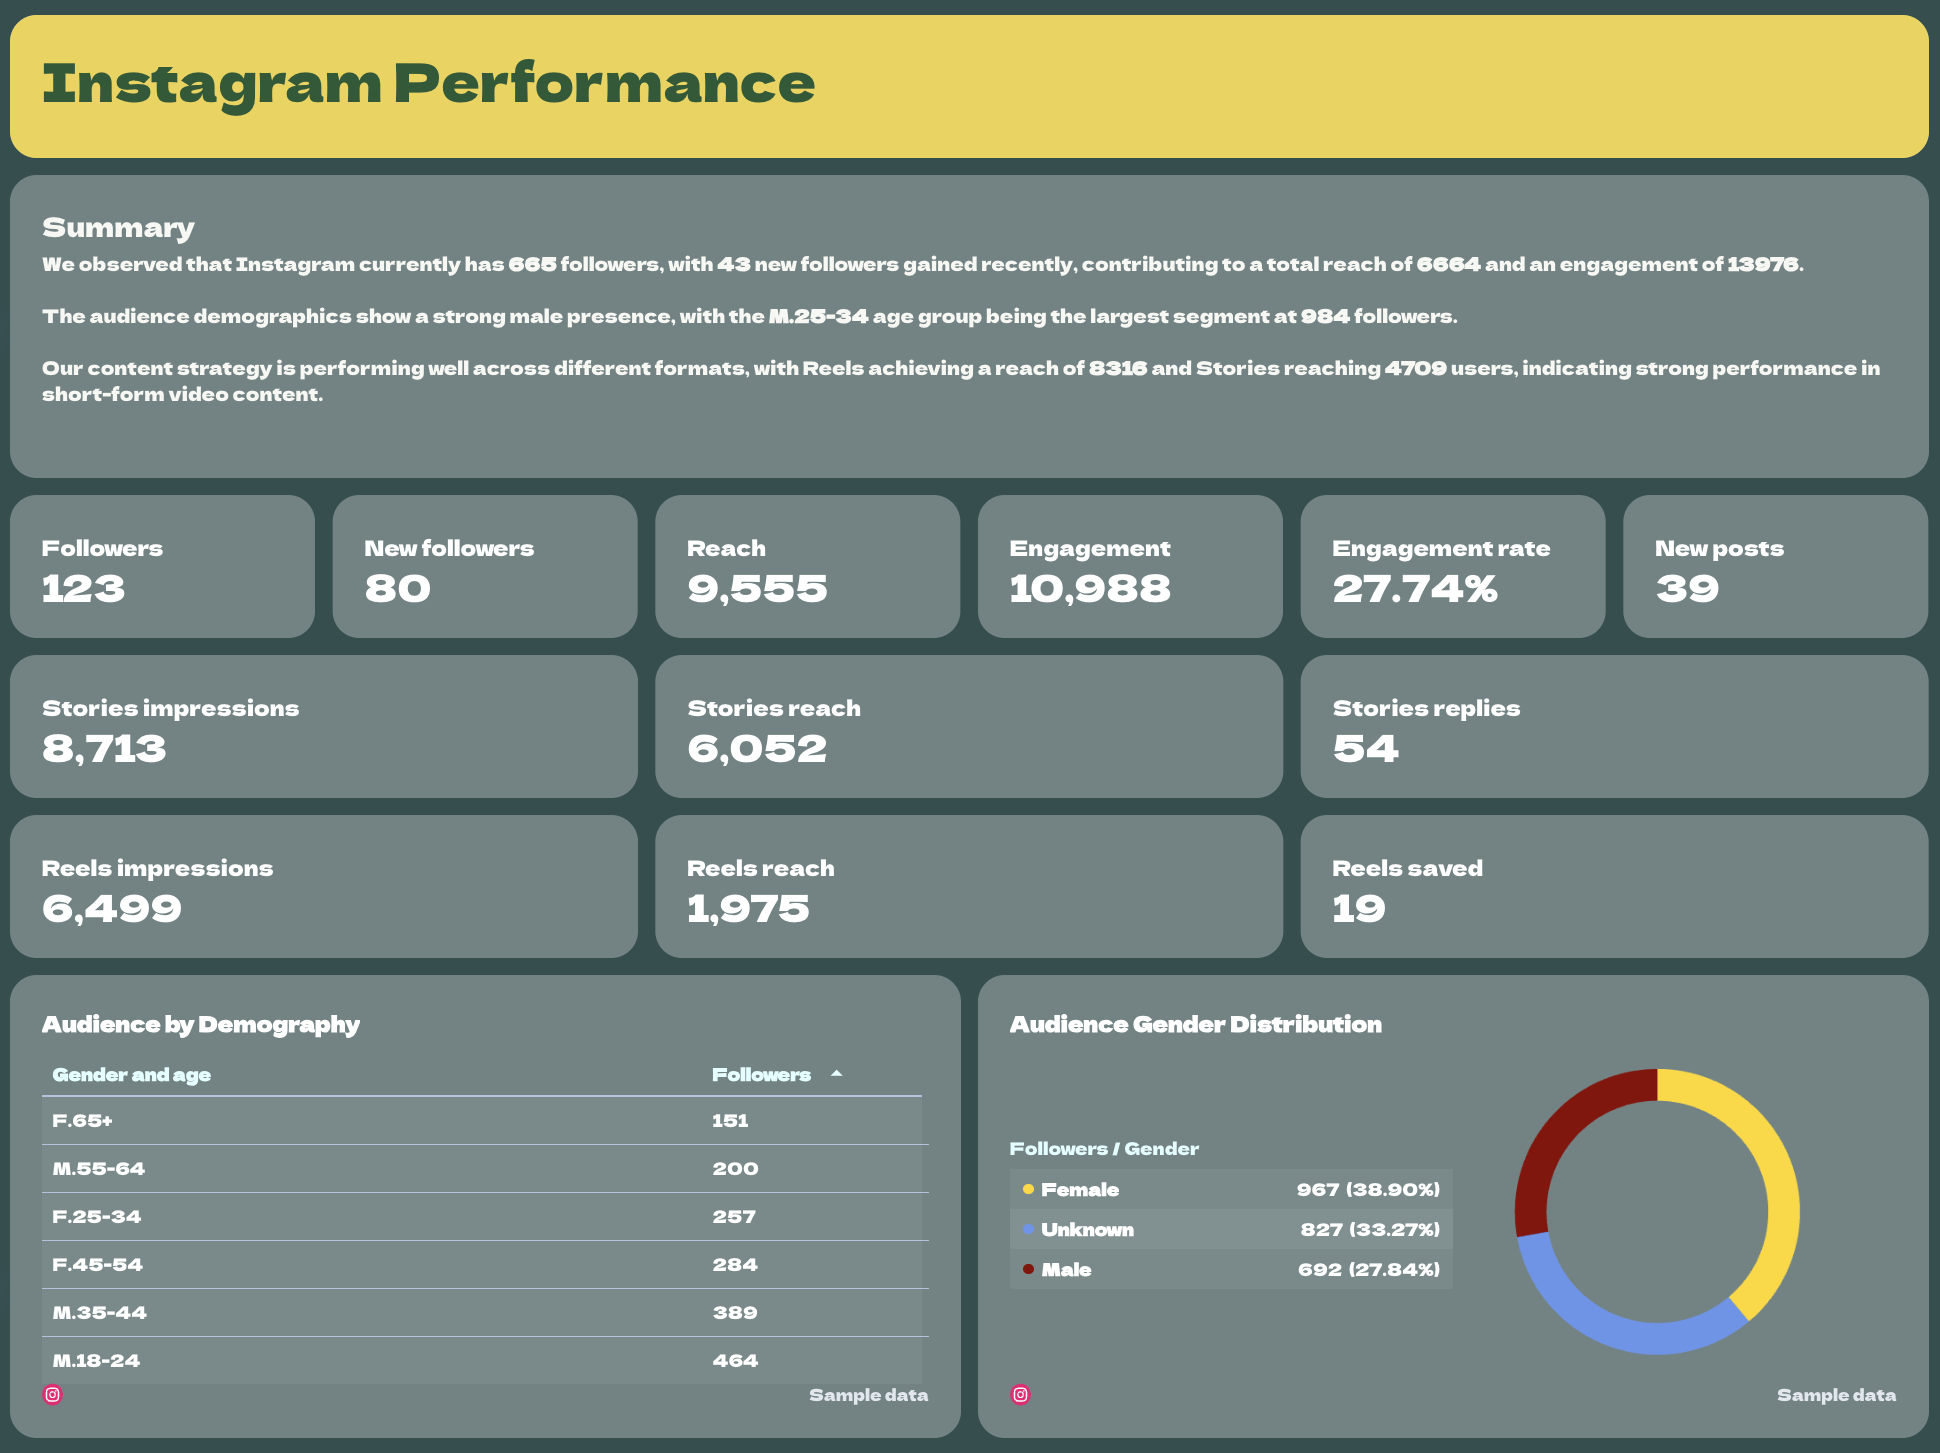
2️⃣ Instagram
- Total followers
- New followers
- Total reach
- Total impressions
- Total engagement
- Stories reach
- Stories impressions
- Stories replies
- Reels reach
- Reels impressions
- Reels saves
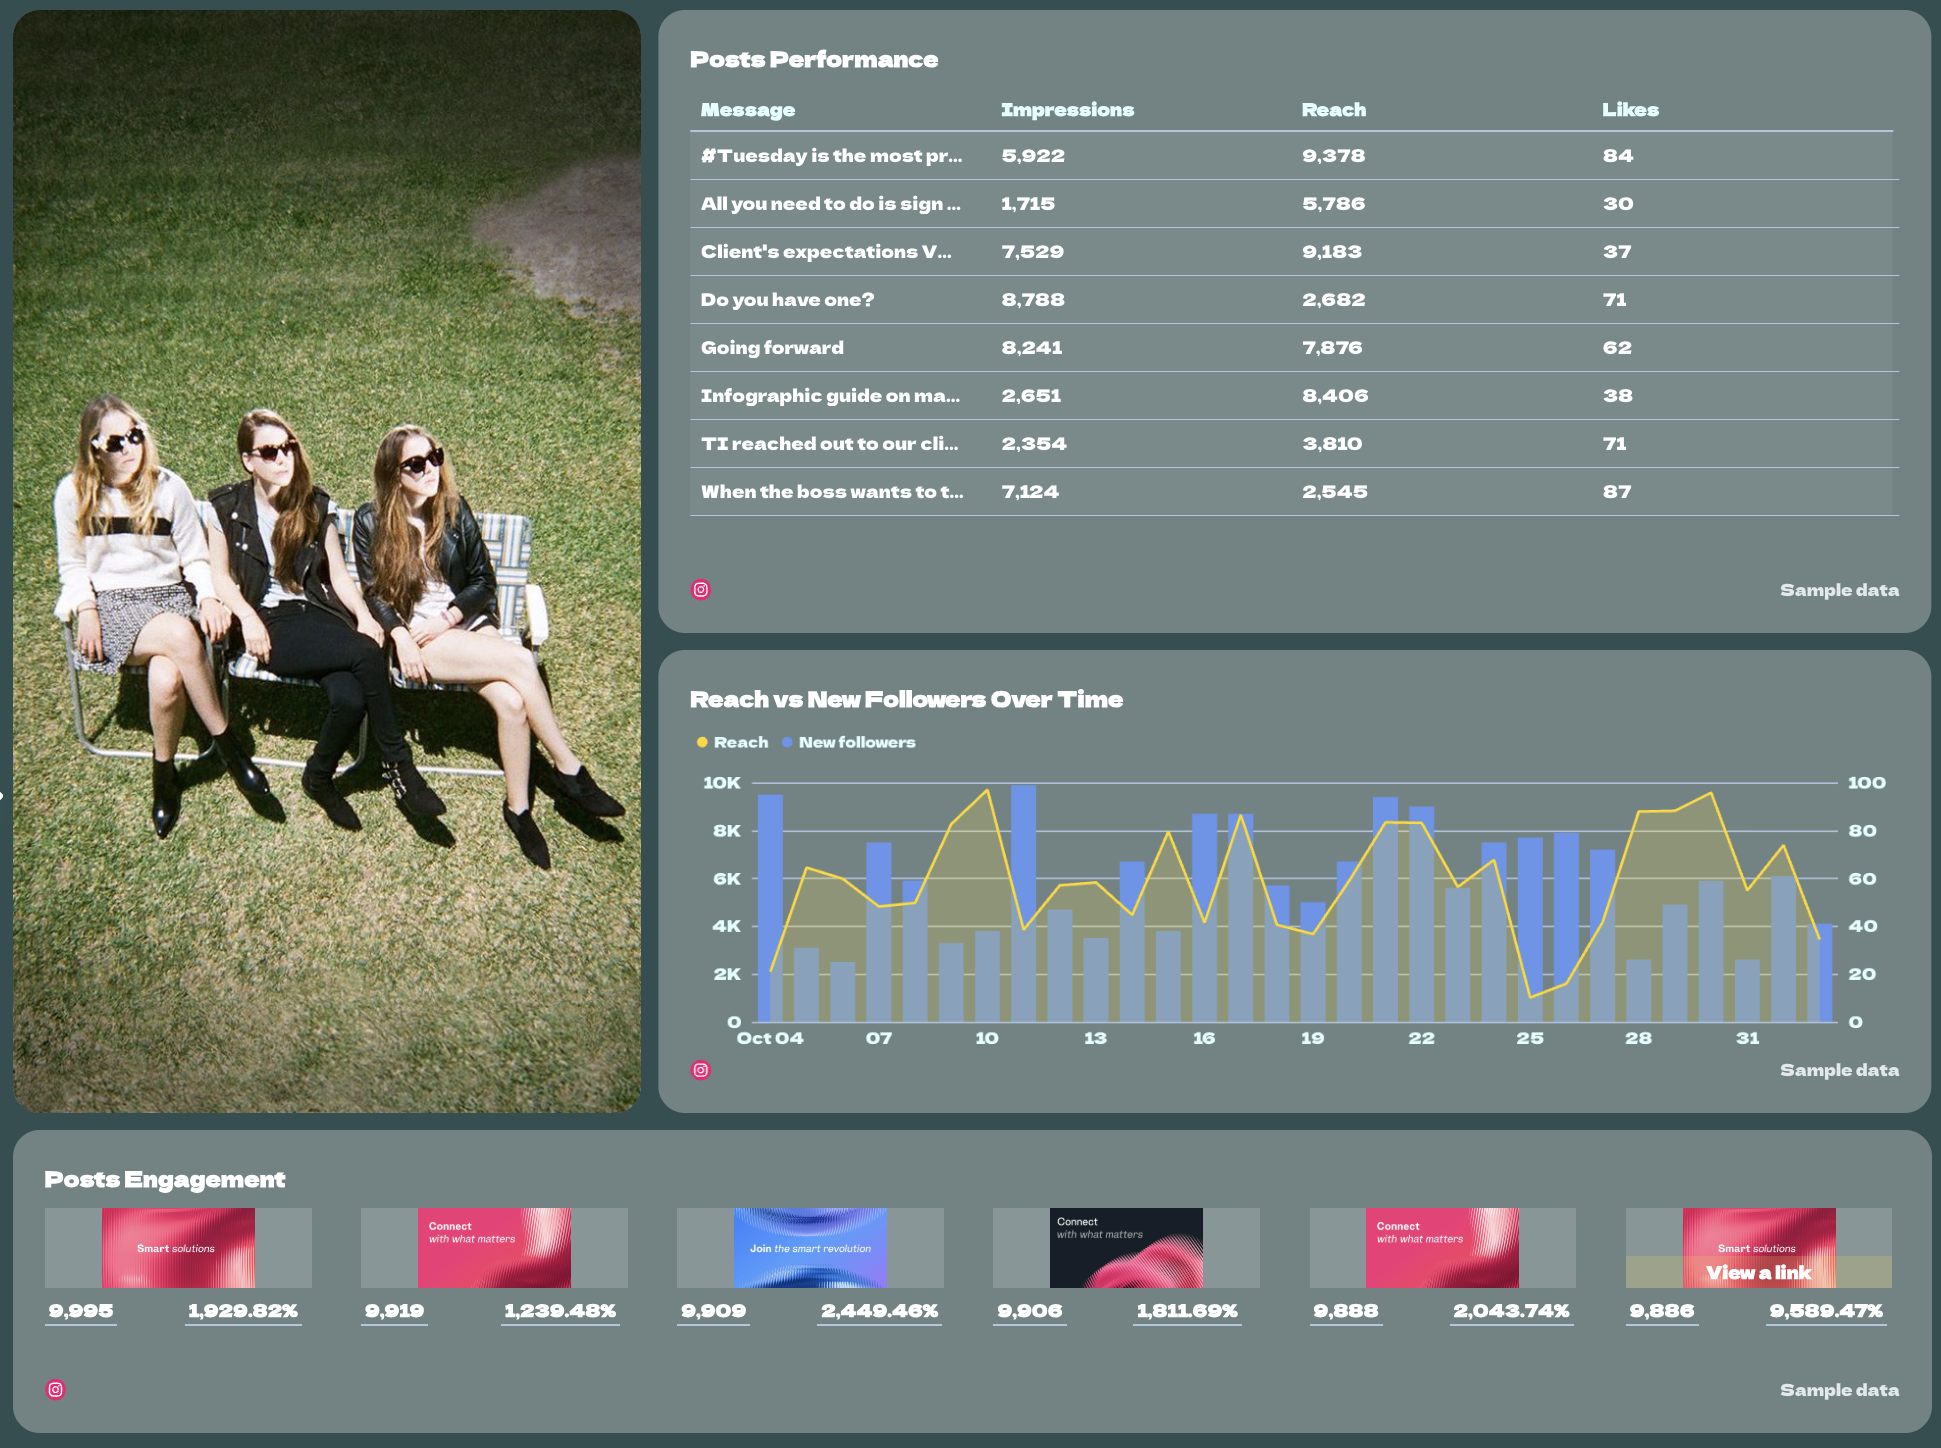
- Post engagement rate
- Top performing posts
- Top performing reels
- Audience demographics by gender and age
3️⃣ Facebook
- Page followers
- Page likes
- Total reach
- Total impressions
- Post engagements
- Comments
- Shares
- Average engagement per post
- Post count
- Top performing posts
- Engagement trend over time
- Audience demographics
4️⃣ YouTube
- Total subscribers
- Subscribers gained
- Subscribers lost
- Total video views
- Estimated minutes watched
- Average view duration
- Average view percentage
- Likes
- Dislikes
- Comments
- Shares
- Video performance by video
- Subscriber growth trend
- Video views vs average watch percentage
Best practices:
✅ Start the dashboard with a social media overview tab that aggregates followers, reach, and engagement across all platforms so stakeholders can quickly understand overall social media performance.
 ✅ Include platform-specific tabs for Instagram, Facebook, and YouTube to analyze audience growth, engagement, and content performance without cluttering the overview.
✅ Track top-performing posts, reels, and videos to identify which content formats consistently generate the most reach and engagement.
✅ Monitor audience demographics and follower growth trends to better understand who engages with your content and how your audience evolves over time.
✅ Include website traffic metrics from GA4 so teams can clearly measure how social media activity contributes to website sessions and conversions.
✅ Add custom images to your report to make it “pop” and more engaging for stakeholders to read through.

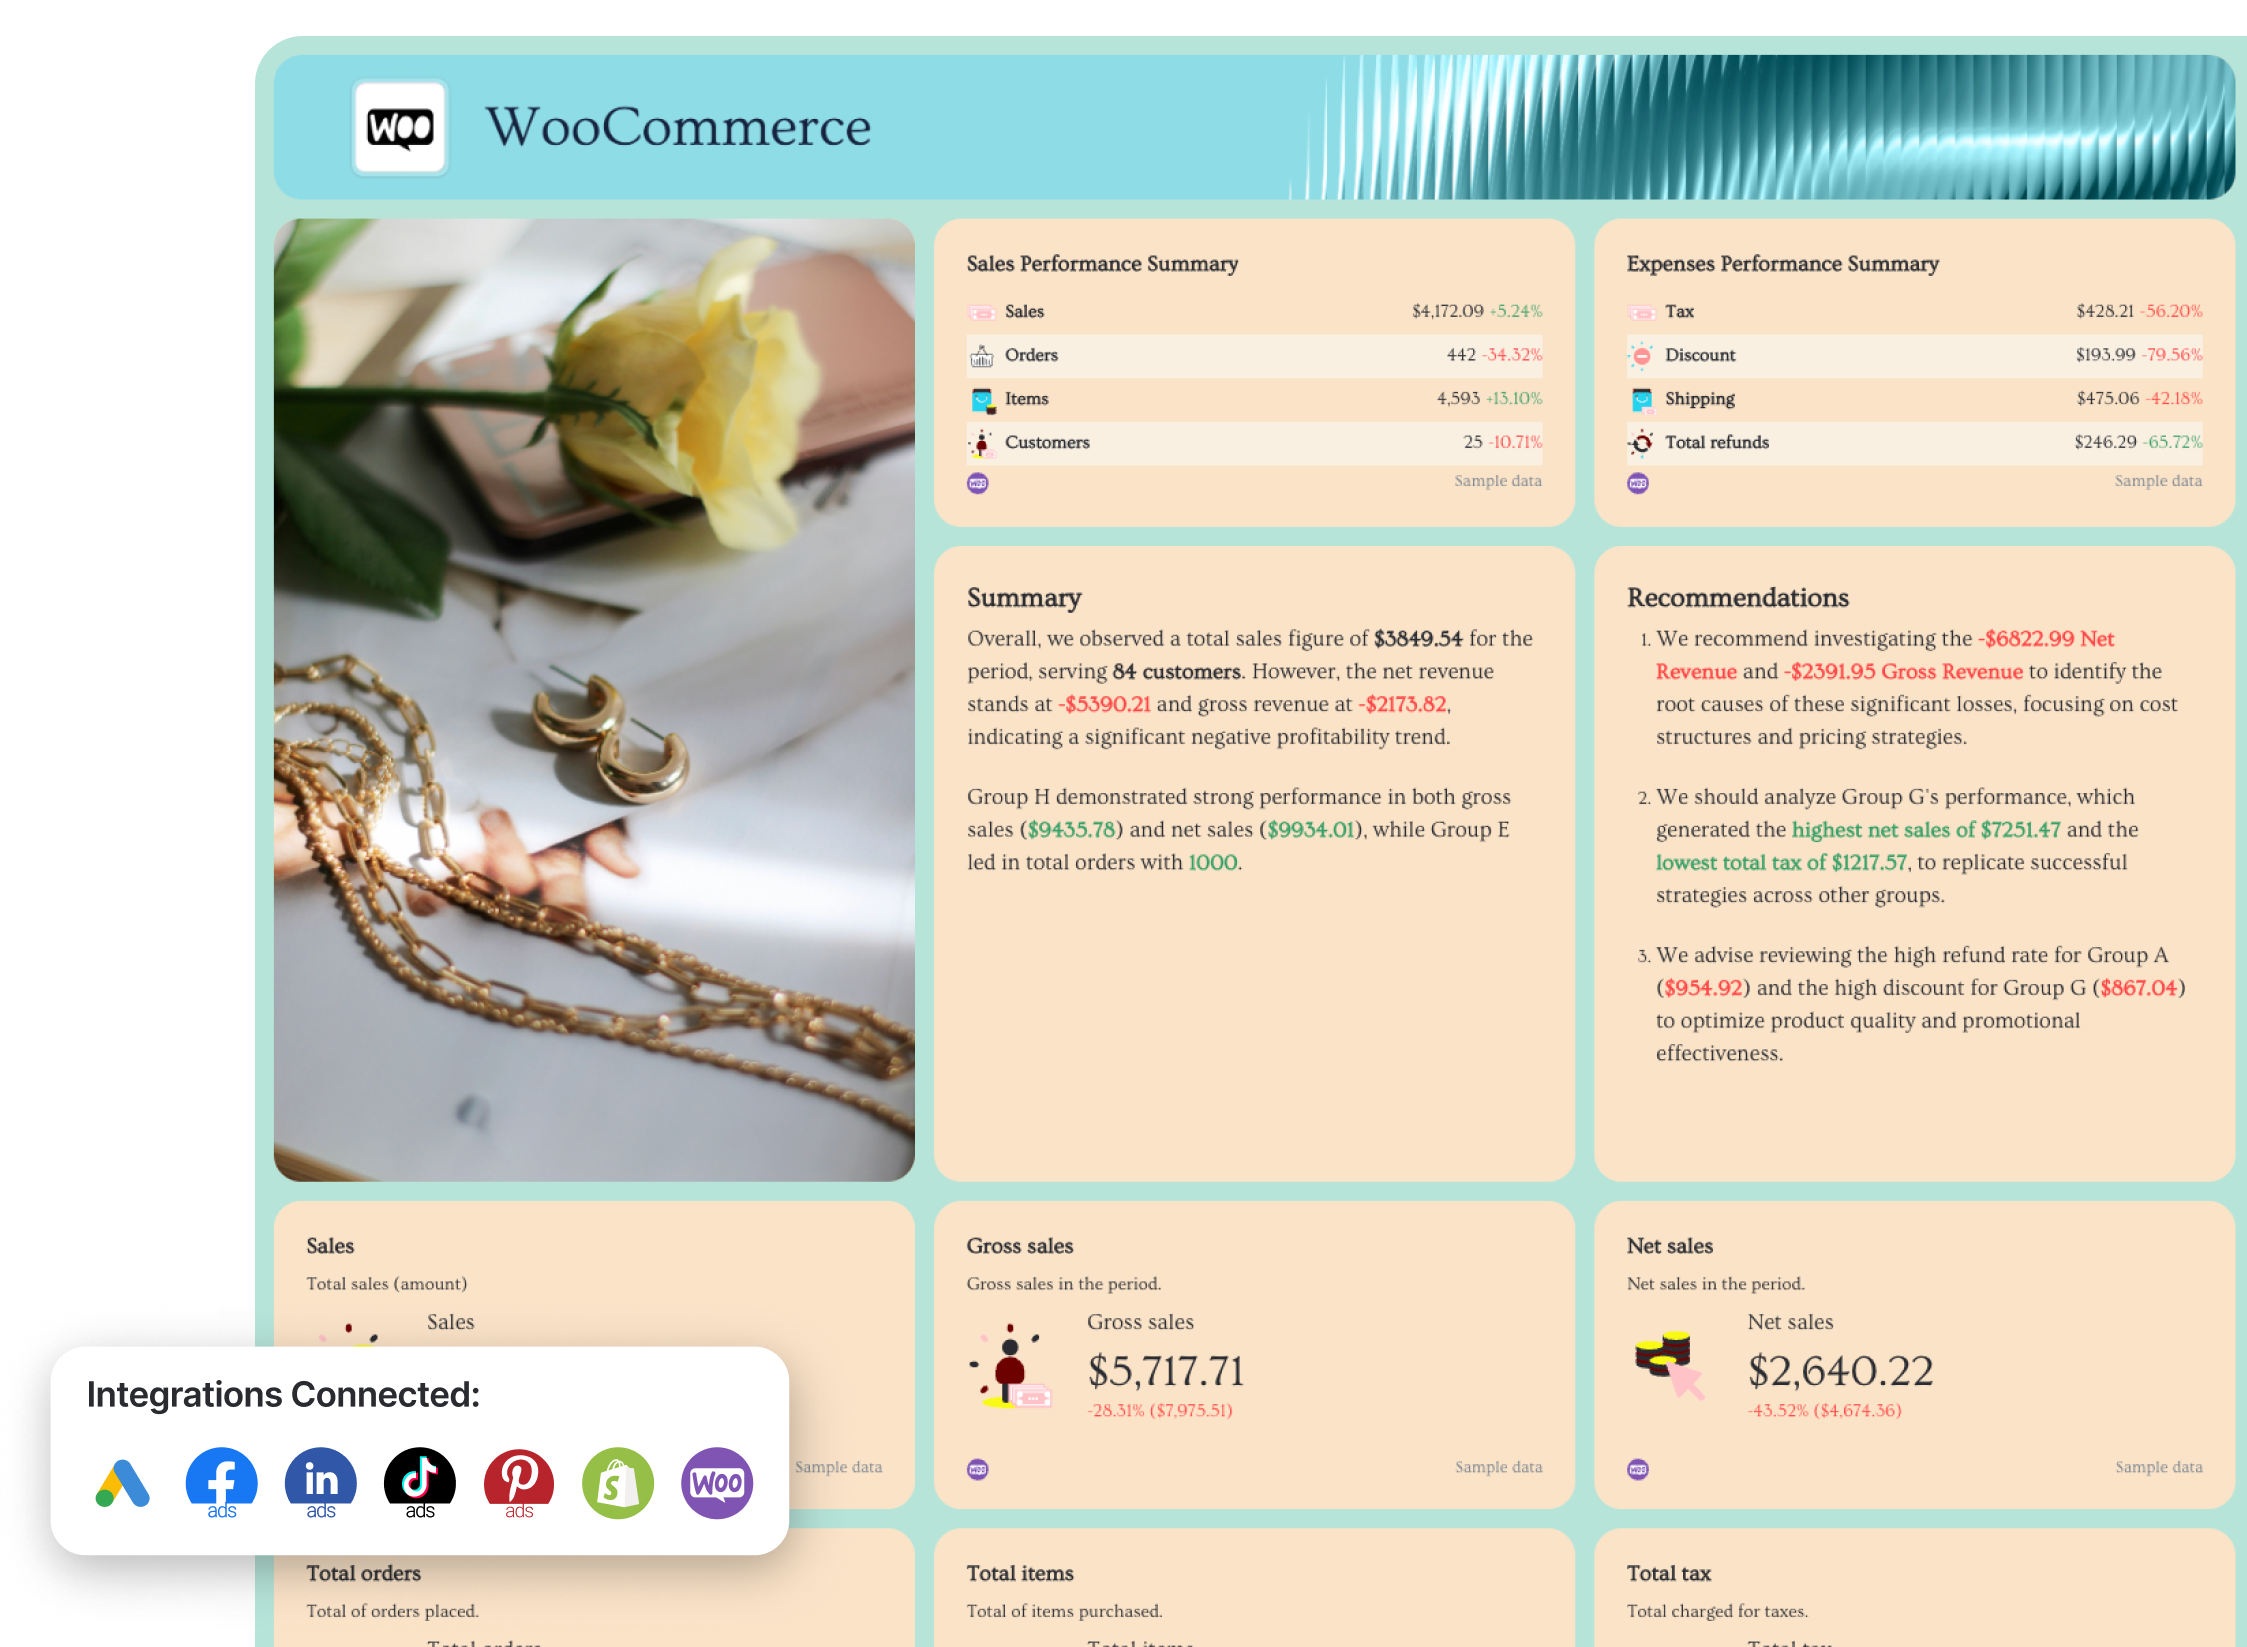
7. Ecommerce Google Analytics Dashboard
Use this template for free with your data
Who it’s for: Ecommerce managers, marketing teams, and agencies with eCommerce clients that need a clear view of how advertising campaigns and store performance contribute to revenue, conversions, and customer acquisition.
Channels connected: Google Analytics 4, Facebook Ads, Google Ads, TikTok Ads, LinkedIn Ads, Pinterest Ads, Shopify, WooCommerce
This Google Analytics ecommerce dashboard helps ecommerce teams understand how marketing campaigns and store performance translate into revenue. Instead of switching between ad platforms and ecommerce tools, this dashboard consolidates campaign performance, store transactions, and customer behavior into one report.
You can quickly see what changed in revenue, conversion rate, and average order value in Google Analytics, while also understanding which ad platforms and campaigns drive the most purchases.
This dashboard is commonly used as a weekly or monthly ecommerce performance report. It combines advertising metrics with ecommerce data so teams can track the full journey from ad click to purchase.
See also: 7 effective e-commerce dashboard examples
How to use:
Metrics to visualize:
1️⃣ Overview
- Total revenue
- Total purchases
- Total orders
- Conversion rate
- Average order value (AOV)
- Total sessions
- Total users
- New vs returning customers
- Revenue by channel, campaign
- Purchases by channel
- Purchases over time
- Revenue trend over time
2️⃣ Facebook Ads
- Ad spend
- Impressions
- Reach
- Clicks
- Click-through rate (CTR)
- Cost per click (CPC)
- Purchases
- Cost per purchase
- Return on ad spend (ROAS)
- Revenue generated from Facebook Ads
- Top performing campaigns
- Top performing ad sets
3️⃣ Google Ads
- Ad spend
- Impressions
- Clicks
- Click-through rate (CTR)
- Cost per click (CPC)
- Conversions
- Cost per conversion
- Revenue generated from Google Ads
- Return on ad spend (ROAS)
- Campaign performance
- Top performing keywords
4️⃣ TikTok Ads
- Ad spend
- Impressions
- Clicks
- Click-through rate (CTR)
- Cost per click (CPC)
- Conversions
- Cost per conversion
- Revenue generated from TikTok campaigns
- Return on ad spend (ROAS)
- Top performing campaigns
- Video engagement metrics
5️⃣ LinkedIn Ads
- Ad spend
- Impressions
- Clicks
- Click-through rate (CTR)
- Cost per click (CPC)
- Conversions
- Cost per conversion
- Revenue generated from LinkedIn campaigns
- Return on ad spend (ROAS)
- Campaign performance
6️⃣ Pinterest Ads
- Ad spend
- Impressions
- Pin clicks
- Outbound clicks
- Click-through rate (CTR)
- Conversions
- Cost per conversion
- Revenue generated from Pinterest Ads
- Return on ad spend (ROAS)
- Top performing pins and campaigns
7️⃣ Shopify
- Total store revenue
- Total orders
- Average order value (AOV)
- Total customers
- New vs returning customers
- Revenue by product
- Top selling products
- Orders over time
- Refunds and returns
- Revenue by country
8️⃣ WooCommerce
- Total store revenue
- Total orders
- Average order value (AOV)
- Total customers
- New vs returning customers
- Revenue by product
- Top selling products
- Orders over time
- Refunds and returns
- Revenue by country
Best practices:
✅ Start the dashboard with an overview tab showing total revenue, orders, conversion rate, and average order value so stakeholders can immediately understand store performance.
✅ Keep each advertising platform on its own tab so marketers can easily evaluate campaign performance without mixing metrics across channels.
✅ Always combine advertising metrics with ecommerce revenue metrics to clearly show which campaigns drive actual purchases rather than just traffic.
✅ Track revenue trends and order trends over time to quickly identify the impact of promotions, product launches, or seasonal campaigns.
✅ Include product-level and store-level insights so teams can understand which products drive the most revenue and which campaigns support them.
Published on Mar 19 2020
WRITTEN BY
YamonYamon is a Senior Content Marketing Manager at Whatagraph. With an eye for detail and a knack for always considering context, audience, and business goals to guide the narrative, she's on a mission to create genuinely helpful content for marketers. When she’s not working, she’s hiking, meditating, or practicing yoga.