Interactive Dashboard for Pro Marketers
From the local small businesses to the CEOs of multinational conglomerates, everyone seems to be spreading their tentacles towards adopting the technology that comes with visually engaging displays.

Apr 14 2020●2 min read

Frankly, these visual displays only offer a cursory look at the available business data. By concentrating more on the trendy outer displays, chances are that companies are unknowingly neglecting a wide array of data-driven insights that are filled with a more extensive and comprehensive approach.
What is an Interactive Dashboard?
An interactive dashboard refers to a data management tool that helps to track, analyze, monitor, and visually display the essential business metrics.
Apart from that, it provides users with the opportunity to interact with the data, thus granting an avenue to make well-informed, data-driven, and healthy business decisions.
Usually, interactive dashboards are essential tools used within the intelligent environment of businesses. Establishing a connection between the company’s strategy and the manager.
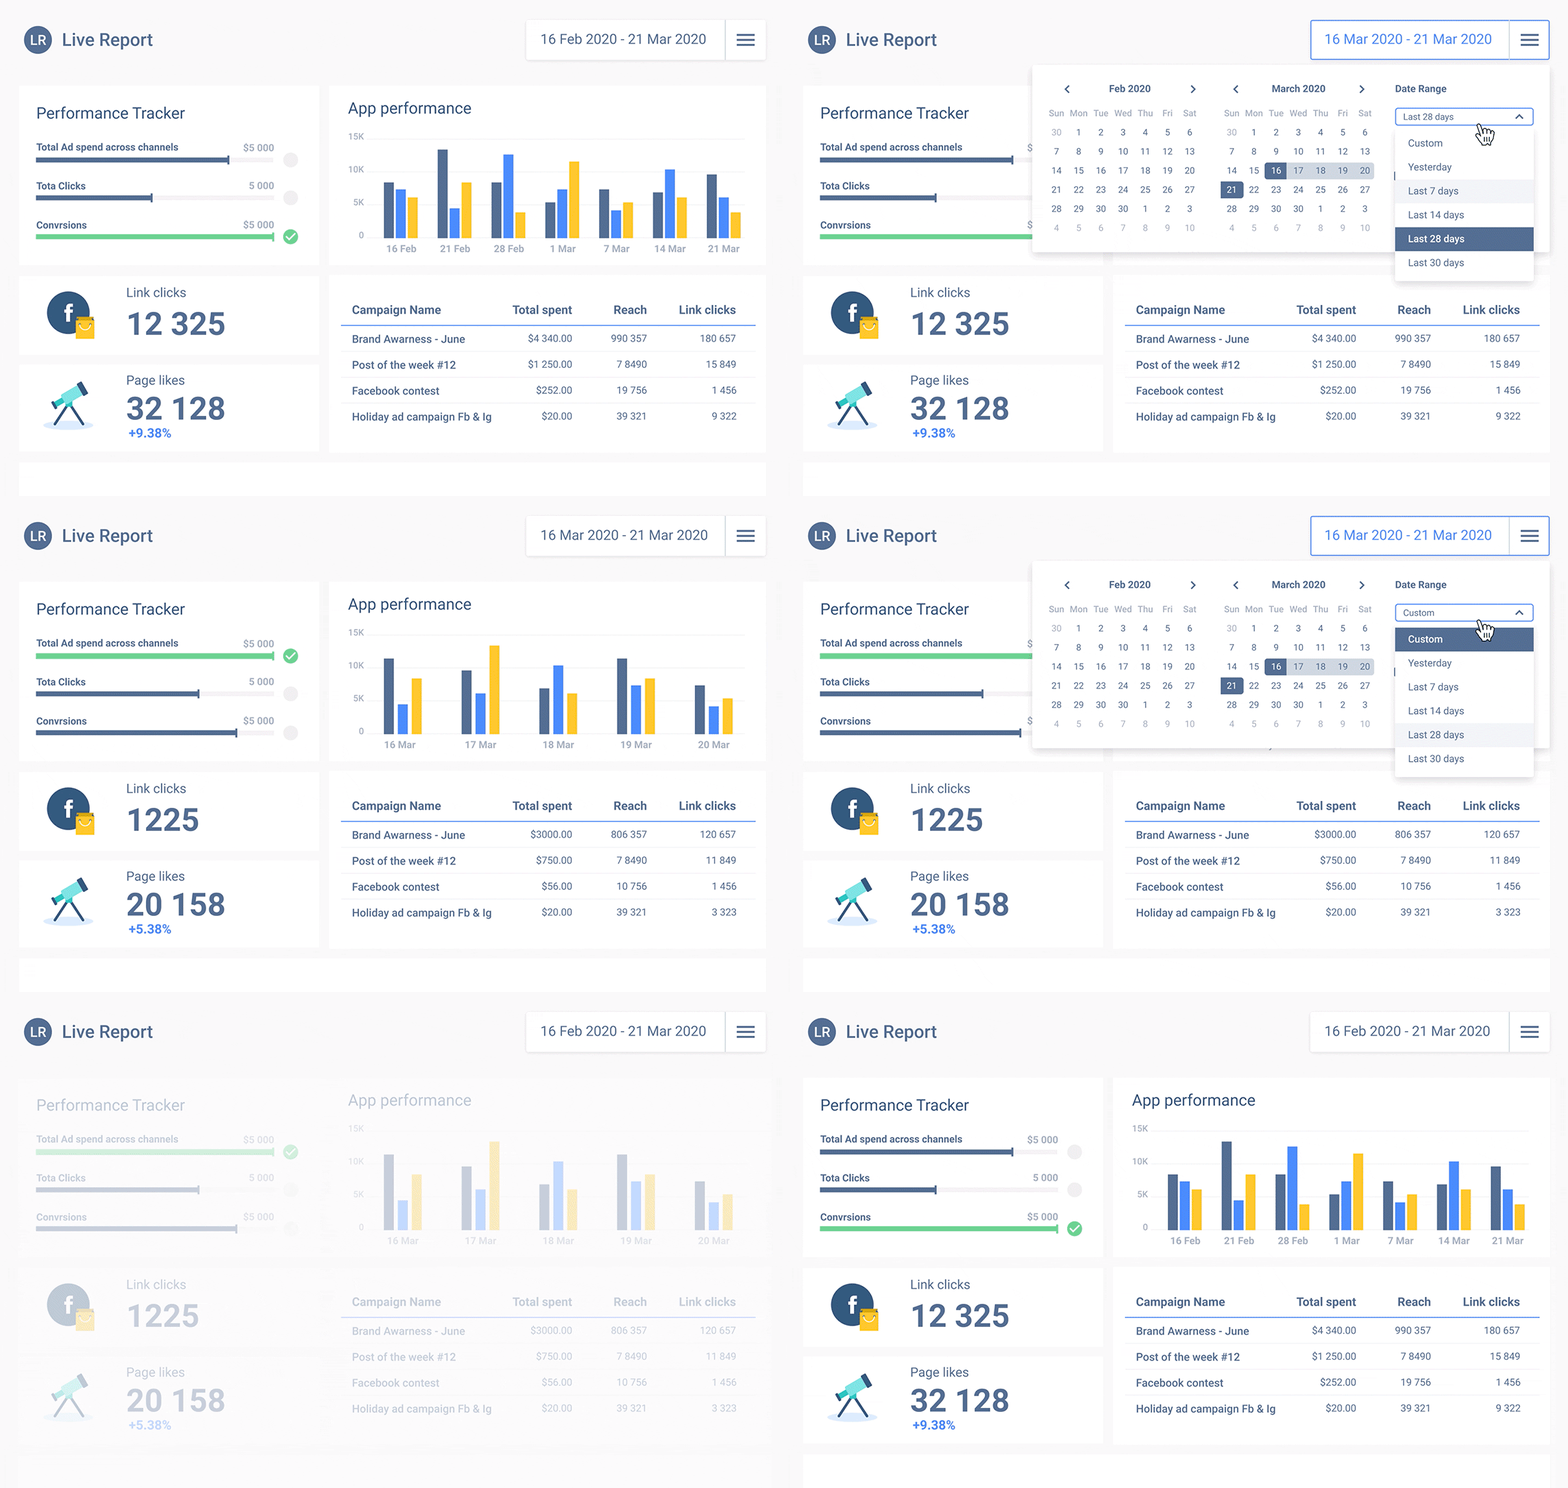
While also promoting smooth and effective collaboration, and enabling employees to perform their given tasks with an increased level of outputs and productivity. Below we may see how Whatagraph live reports can be as good as dashboard.
Benefits of Using Interactive Dashboards
Speed
Undoubtedly, swiftness is a crucial factor when it comes to the survival of any business in the present cutthroat digital age. When it comes to the use of PowerPoint presentations or conventional spreadsheets, data is inputted once and periodically subjected to manual updates.
With modern reporting tools like the interactive dashboard, there isn’t any need for the manual update of data as it is stressful and time-consuming.
Real-time interactive dashboards enable real-time data. And that represents the beauty and power of intelligence in business in its core.
Minimal Involvement in Information Technology
With the adoption of strategies like the empowerment of users with the right skills to perform individual ad-hoc data analysis, there lies an opportunity for companies and businesses to save valuable IT resources.
This is because there will be a significant decrease in the requests for database queries or customizations. This will even make the IT department focus more on other urgent or valuable tasks, while business users can have answers to their relevant business questions in due time.
Redundant Reports is Entirely Eradicated
If you need to adapt to the displayed data rather than creating static PowerPoint slides, you do not need anything else than one dashboard visualization and reporting tool coupled with the state-of-the-art interactive features.
Interactive dashboards utilize real-time data combined with intelligent data alerts to enable users to abolish the use of presentations or spreadsheets completely. Every time there is an anomaly, the interactive dashboard alerts the users, while the neural networks ensure the smart detection and future forecasts.
Strength and Agility for Key Decision Makers
An interactive dashboard is an interactive tool that empowers users with relevant responses to crucial business questions and on-demand. Apart from that, it provides real and up-to-date data. Besides, with a couple of clicks, users will be able to access the data from different perspectives and points of view.
Zooming in and out, filtering through the available countries, detailing time intervals, and hiding specific parameters enables you to access the data more holistically. And of course, this isn’t possible compared to the use of spreadsheets or presentations.
However, modern interactive live reporting software, like Whatagraph, is one that can help companies and businesses with real-time interactive tracking, analyzation, monitoring, and visual display of essential data and business metrics.
This software produced and designed by Whatagraph is easier to use than presentations or spreadsheet program.
Besides, it offers a wide range of features as well as provide you with different marketing live reports. With Whatagraph, there is a high probability that you can prepare stunning interactive data visualizations of your business data.

WRITTEN BY
Indrė Jankutė-CarmaciuIndrė is a copywriter at Whatagraph with extensive experience in search engine optimization and public relations. She holds a degree in International Relations, while her professional background includes different marketing and advertising niches. She manages to merge marketing strategy and public speaking while educating readers on how to automate their businesses.