How Report Automation Can Speed Up Your Reporting Process
Do you have multiple clients you create reports for? Do you find it overwhelming because you must go through every single marketing channel and campaign to extract data? Not to mention that the report itself must be professionally created in order to include your company's branding, be personalized, and be visually appealing.

Jul 17 2020 ● 5 min read

For many marketing agencies, this bottleneck costs significant time and money.
There is a more efficient way to handle multiple reports. The method is known as report automation. This blog will explain report automation and what it entails, its benefits and drawbacks, and the best ways to approach it.
What Is Report Automation?
Report automation is a process or a method that allows marketing agencies and in-house marketers to automatically create, update and send reports to their clients.
For marketers to enjoy the benefits of this process, they need to find a report tool, such as Whatagraph, that has an automation feature.

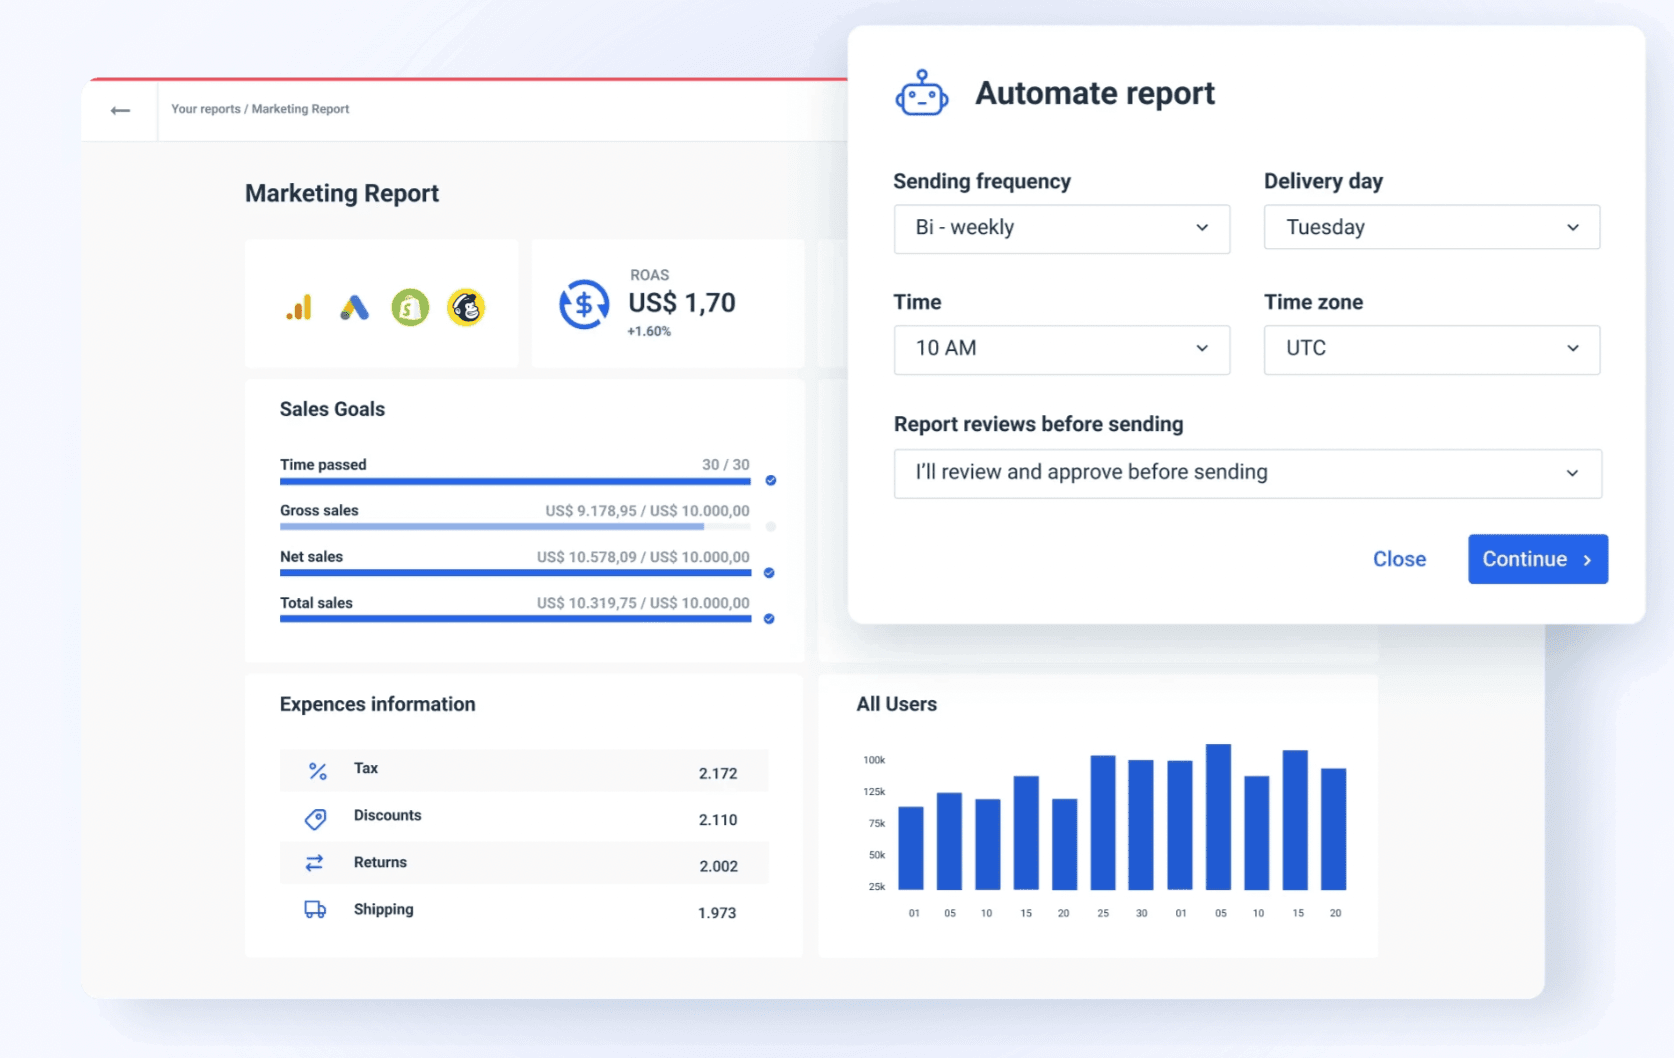
For example, Whatagraph allows marketers to send reports:
- On a regular basis;
- On chosen frequency;
- At the chosen time zone;
- Highlighting needed periods;
- Personalized and white-label;
- Enter at least one email address;
- Any type of report created from a pre-made template.
- And set a notification for you just to check what the report looks like before going out to the client.
Report generation and automation is a modern, recently developed process that completely eliminates the need to send reports traditionally, a.k.a manually.
72% of successful and only 18% of unsuccessful companies already use some automated processes.
You can use automated reports for tasks such as:
- Minimizing manual tasks
- Increasing the number of new customers
- Streamlining marketing and sales efforts
- Improving customer engagement and experiences
Let’s cover more benefits and this process drawback more in-depth:
The Benefits of Report Automation
You keep reading the article only to find out that report automation is a God-sent gift to marketers.
Well, it sort of is.
Report Automation Saves Time On Repetitive Tasks
Why not invest some money in a product, automate as much of your process as possible, and use the time saved to improve your strategies, client-customer relationships, and so on?
Report automation can literally save you 30% of your time on report creation while managing more than 150 clients, as MarketSolutions did, or 40 hours per month, as UpTick Marketing did.
Reporting systems can also generate business reports for your stakeholders, displaying business data and allowing for better decision-making. A single report can display data sets of business performance, and update them on how their investments are paying off and what outcomes they should expect.
Improved Efficiency and ROI
The size and number of cloud platforms are increasing. The number of marketing channels and campaigns is increasing, and tracking their metrics is becoming more complex. An agency must build a personalized, detailed, and precise report using multiple channels for each client. Naturally, it takes a significant amount of time and resources.
Reporting tools with automation features can assist in keeping track of everything.
Whatagraph's goal is to assist marketing agencies and in-house marketers in reducing this analytics tech stack by minimizing the number of tools our customers must use. Furthermore, it is necessary to centralize all data from various channels into a single location.

So, no matter how many different channels you want to combine, aggregate data from, build a cross-channel report or an automated dashboard - you can do it with Whatagraph.
A generated client report can then be scheduled so Whatagraph sends it out when your clients need it. Once a week, once per month, or at any custom interval you desire for data reporting.
Improved Client Experience
Schedule reports and improve your client experience.
By sending regular, clean and personalized client reports, you are keeping yourself accountable, clearly communicating your achievements and allowing clients to take a sneak peek at your work. When Excel reports no longer cut it, you need to go one step further.

Can we just say that more than 40% of clients who receive account manager reports are dissatisfied with their level of insight?
We found that clients expect to see:
- Detailed audience insights
- Creative performance
- Performance breakdown by channel
- Performance breakdown by country/region
- Performance against top-line KPIs (a summary of your entire campaign)
Not only that, but clients appreciate personalization. According to Adweek, personalization efforts can boost revenues by up to 15% and reduce CAC by up to 50%. Moreover. According to Clickz, advanced personalization reports can expect a $20 return for every $1 spent.
You can easily implement personalization by using marketing report automation software that also has flexible customization and white-label features.
These features in Whatagraph allow marketers to
1. Customize their automatic report emails in the following ways:
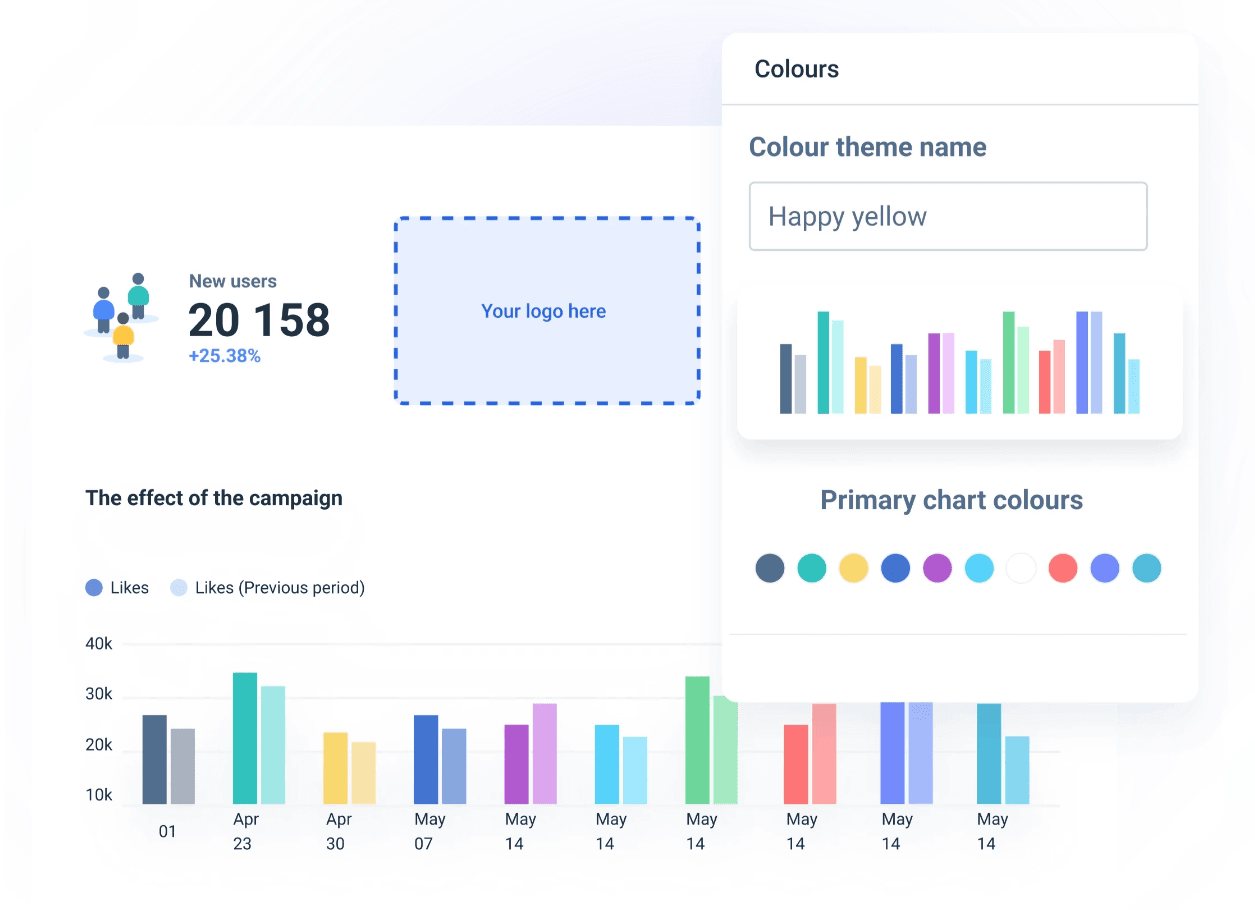
- You can upload your own logo to the report
- You can use a custom URL for the report so it looks like it’s hosted on your website
- You can come up with the email subject
- Choose the sender name and sender email
- Choose a reply name and reply to the email name
- Write down the heading, body, footer and button texts
2. Customize the branding theme
- Change the colors and the design of your report
- Add your header text
- Uploaded your agency logo
- Choose the fonts and text positioning
New Source of Revenue
Do you know how you can automate reports and save time? Well, if you are using white-label and customization features, you can also… charge for the extra work that you do.
Show clients the value you bring to their business, including straightforward and clear data and high-level insights.
“We see our customers as invited guests to a party, and we are the hosts. It’s our job daily to make every important aspect of the customer experience a little bit better.” –Jeff Bezos.
To make extra cash, you can either charge an hourly rate or set a fee per report. Talk to your clients and inform them about your charges.
Learn more about it in our guide and you can find out how a single change you make can bring in hundreds of dollars of extra revenue per month.
The Drawbacks of Report Automation
It was hard to find the cons of report automation, but just so you are aware of all the drawbacks this could bring you, we covered them too.
Making Changes
As you might expect, automated reports are most effective when you are not making significant changes during the launch of your strategy.
This means a change in the goal, metrics, channels, and campaigns.
Sometimes small changes or small tweaks are required, but as you can imagine, making last-minute changes in the report can be confusing for the client and time-consuming for you.
You’d need to edit the report by adding new data sources, creating new widgets, and re-building an easy-to-read report.
No Deeper Analysis
The second and final disadvantage we identified was a lack of in-depth data analysis.
Not every tool can work with multiple channels and generate a cross-channel report.
Not only that, but automated reports imply that there will be no summaries explaining specific jumps, drops in numbers, and client behavior patterns.
However, with Whatagraph, you can receive a notification a few minutes (or whenever you want) before sending the report. This will allow you to review the metrics and data and scan for trends quickly. Then, simply drag and drop a note widget to provide a summary to your clients. We guarantee that they will appreciate these small tokens of extra effort.
What Are the Best Way to Automate Your Reports?
Marketing agencies, in-house marketers, and companies in general generating reports have three powerful ways to automate their reports.
Choosing the best one means identifying your reporting needs, goals, KPIs you need to integrate, and channels to pull data.
Here are your options:
BI Tools
Datapine, Looker, Tableau, and Microsoft Excel spreadsheet software are business intelligence tools that help marketers create reports. They use AI, robotic process automation, and business process management. Furthermore, they make use of data visualization, customization, and, on occasion, white-label features.
BI tools provide flexibility that no other tool can match:
- They provide data mining, benchmarking, descriptive, and statistical analysis.
- You can expect BI tools to offer auto-discover insights. In other words, these tools can examine data and find valuable info for your client.
- They require little to no human involvement. This means fewer human errors in your reporting dashboards.
- They offer great report automation options allowing marketers to pull data from any platform that supports BI systems.
On the other hand, it is widely accepted that BI tools are incredibly difficult to use for a marketer who has no tech background. Their UI looks more like a spreadsheet that requires you to know certain coding, how to properly connect data sources, etc.
Data Analytics Tools
Google Analytics, Funnel.io, and Adverity are marketing data analytics tools that are simpler to use than BI tools but provide less flexibility.
Data analytics tools are better for marketing agencies and in-house marketers because their UI is easier to understand and actually helps them to optimize their performances.
Usually, these tools clearly present and highlight SEO, PPC, social media, e-commerce, and other paid or organic campaign metrics.
Data analytics tools offer:
- White-label functionality.
- Simplified yet in-depth analytics.
- Access to real-time and historical data.
- Features such as alerts and thresholds.
- Easy connections to any marketing platform.
If you are a marketer looking for a simple solution to tasks such as creating a monthly report, white-labeling a dashboard, and so on, data analytics tools are ideal for you.
Automated Reporting Tools
Lastly, we got automated reporting tools that mainly focus on helping marketers to improve their efficiency and take the benefits mentioned above. These tools are hidden under the names like Whatagraph or SolveXia.
Automated reporting tools pave the way for:
- Analyzing and visualizing data can.
- Accelerating the reporting process.
- Quickly extracting insights from raw data.
- Creating customized reports based on the parameters you need.
If you closely work with your clients, it’s advised to use tools that specifically focus on saving your time, improving efficiency, and sending regular nicely built reports.
Marketing teams can use report automation tools to not only save time on manual tasks but also to streamline their workflows. Say hi to better team efficiency and transparency.
Bottom Line
There are many available tools that can help marketers in numerous ways. But when it comes to automating your processes, only some are true leaders.
Get started with Whatagraph. Discover and uncover the potential our automated reports can bring to your business and your client. Start our free 7 day trial and try out all of our platforms’ features.
Published on Jul 17 2020

WRITTEN BY
Dominyka VaičiūnaitėDominyka is a copywriter at Whatagraph with a background in product marketing and customer success. Her degree in Mass Communications/Media Studies helps her to use simple words to explain complex ideas. In addition to adding value to our landing pages, you can find her name behind numerous product releases, in-app notifications, and guides in our help center.