Ready-Made SEO Dashboard Template

Running SEO for multiple client websites?

See your best-performing landing pages and understand which keywords bring the most conversions from organic search with our SEO dashboard template.

Tie SEO metrics to CRM data and show clients the ROI from SEO.

SEO Dashboard Template - Ready to Use
Trusted by 1,000+ marketing agencies and brands around the world
Lactogal - Logo with stylized leaf-like graphic to the left of the brand name.
Wise Pirates - A gray W-shaped design and a small gray circle on a black background.
Ticketmaster - The Ticketmaster logo.
Seo Sherpa - A logo displaying mountain graphic and text "seo sherpa"
Property Guru - Image completely black.
Awestruck Logo - The word "AWESTRUCK" in a bold, dark-colored sans-serif font on a black background.
Brand Logo 7
Rentable - The Rentable logo featuring a house inside of a square to the left of the company's name.
Brand Logo 9
Brand Logo 10
Brand Logo 11
Lekker Bikes - Logo featuring a stylized tulip and the word "Lekker" in outlined letters.

How Whatagraph Saves You Time on SEO Reporting

Connect data from all your SEO tools in one place

Tired of manually copy and pasting data from multiple SEO tools into spreadsheets?


Use Whatagraph’s native integrations and watch the data flow automatically in—no manual work needed.


No more relying on third-party connectors. Simply plug and go!

Connect data from all your SEO tools in one place - SEO dashboard template

Customize your SEO dashboard the way you want

No more static and ugly SEO analytical dashboards.


With Whatagraph, you can build interactive and stunning dashboards using our pre-made SEO KPI templates and widgets.


Create custom color themes, upload your logos, add text and descriptions, and even send your reports through a custom email domain.

Whatagraph marketing reporting tool

Edit your SEO reporting dashboard in minutes

Have dozens of SEO dashboards?


No need to edit or customize them one by one. Simply set one report as the “Master” dashboard and link multiple dashboards to it.


Then, edit and customize just the “Master” dashboard and all your linked dashboards will update automatically.

Create an SEO reporting dashboard in minutes - SEO dashboard template

Get actionable insights with AI

Tired of manually writing SEO performance summaries for clients?


Whatagraph takes it off of your plate. Ask our AI to summarize your campaign performance and add it directly to your reports.


Or, ask the AI chatbot questions about your data and learn what’s working—and where to optimize next.

Whatagraph marketing reporting tool

Share every dashboard in a few clicks

Time to share your SEO dashboard analytics? Whatagraph gives you many options.


Schedule automated emails. Share live links. Save as PDFs or CSVs. Export raw data to BigQuery or Looker Studio.


Send reports daily, weekly, monthly, or at any other interval.

Automate SEO insights with 24/7 live dashboards - SEO dashboard template

Holistic SEO reporting on one dashboard

Whatagraph connects data from all your SEO platforms and visualizes key metrics in a single report. The data flows directly to your reports and always matches the source platform. No third-party connectors, no dev work. 

It’s good to be loved! Hear from our clients:

I made a switch from GDS and Sheets for reporting to Whatagraph, and I am saving literal hours each week on performance report creation. Our small firm actually managed to onboard 2 new clients as a result of all the time we saved on managing data and reporting. The customer service is also really helpful and easy to reach.

Mindaugas S., Marketing ConsultantCapterra logo for Whatagraph review

Capterra verified review by

Mindaugas S., Marketing Consultant

Having active customer support to help fix any issues was a big contributor, but we also really liked the ability to save templates and connect sources to multiple charts/widgets at once without having to edit them individually. And having the grid layout is much easier to stay consistent with than the free form setup that Data Studio has.

Nico T., Media PlannerCapterra logo for Whatagraph review

Capterra verified review by

Nico T., Media Planner

The system has standard templates that are easy and fast to use. Also you can build your own report with lightning speed. It is very easy to use, has a lot of integration, and let get started very fast.

Rasmus Bernt K., External Senior Management ConsultantCapterra logo for Whatagraph review

Capterra verified review by

Rasmus Bernt K., External Senior Management Consultant

We love Whatagraph - we would definitely recommend and our account manager is great! I love how easy this tool is to use, everyone on the team finds it much more user-friendly than other dashboards. Integration was easy, we sent some example reports to the team who duplicated these for us. We literally had to log in and send it to our clients!

Stephanie S., Digital DirectorCapterra logo for Whatagraph review

Capterra verified review by

Stephanie S., Digital Director

We are showing our clients the work that we're doing for them and this is incredibly important for our clients ROI. They want to see results and having a tool like Whatagraph that can show data from virtually every source we use is hugely important.

John S., SEO StrategistCapterra logo for Whatagraph review

Capterra verified review by

John S., SEO Strategist

The tool is easy to use; you do not need to have development resources. Even my junior project managers are capable of making campaign reports in minutes. There are a lot of pre-made templates you can use as well as many pre-made widgets.

Erman E., Marketing SpecialistCapterra logo for Whatagraph review

Capterra verified review by

Erman E., Marketing Specialist

Really easy to connect data sources within the tool. The library of report templates has been helpful. The customer support team has been responsive to all of our needs. Our team enjoys the simplicity of setting up the reports and how the data is presented.

Brent N., Director of OperationsCapterra logo for Whatagraph review

Capterra verified review by

Brent N., Director of Operations

Easy to create really beautiful graphs and reports which can help other team members to understand the most important takeaways. I especially like the automated report function, so I don't have to check on the same thing repeatedly.

Orsolya S., Online Marketing ManagerCapterra logo for Whatagraph review

Capterra verified review by

Orsolya S., Online Marketing Manager

What is an SEO dashboard template?

An SEO dashboard template helps you display data from scattered SEO tools — from keyword rankings to new/lost backlinks to page performance and more.

In short, it lets you monitor all the KPIs related to SEO.

No matter which SEO report template you choose, it should help you:

✅ Track keyword rankings and changes over time

✅ Visualize your progress on your SEO KPIs

✅ Identify best-performing keywords and pages

✅ Follow your backlink profile and domain authority

✅ Create white-labeled SEO dashboards and add custom color themes, logos, domains, and more

Some of the best SEO reporting tools, like Whatagraph, also offer AI features for automatically creating performance summaries.

Essential metrics - SEO dashboard template

How to build an SEO dashboard?

We’ve gone through the basics, but how do you actually build an SEO dashboard?

The best way to do this is to use a dedicated SEO reporting platform, like Whatagraph.

On Whatagraph, you can build an SEO dashboard in five simple steps:

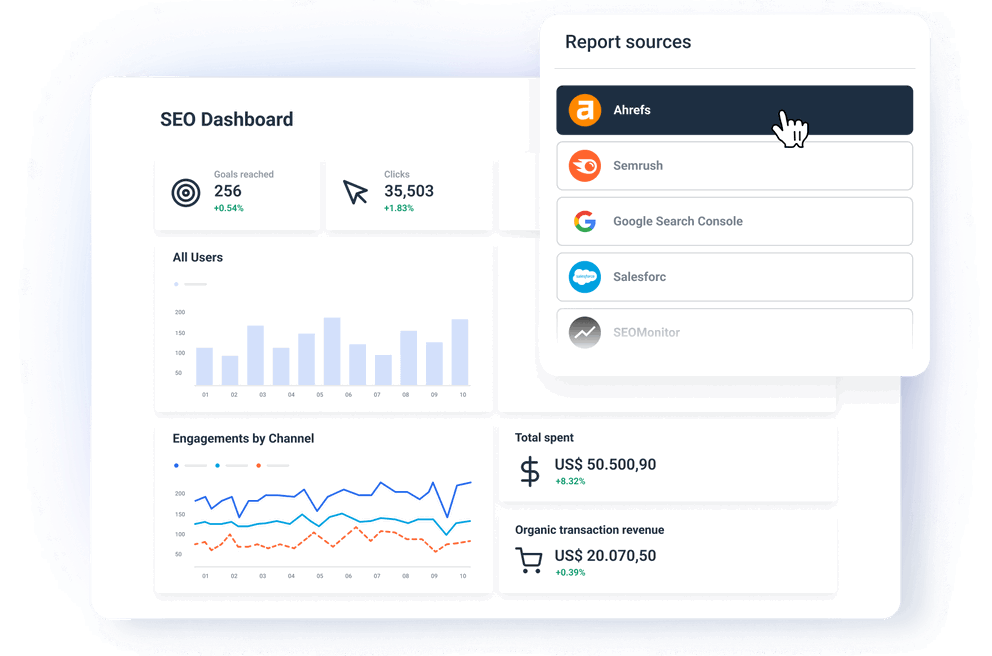
1. Connect your SEO channel integrations

Start by integrating the SEO platforms you want to report on—Ahrefs, Semrush, SE Ranking, Google Search Console, Google My Business, and more.

Choose your data source in Whatagraph’s dashboard, authenticate with your login, and the data will start flowing immediately.

You can also bring in data from 55+ additional marketing channels, like:

  • PPC: Google Ads, Snapchat Ads, TikTok Ads, and more.
  • Social media: Facebook, Instagram, TikTok, LinkedIn, and more.
  • Ecommerce: Shopify, BigCommerce, Magento, and more.
  • Email marketing: Klavioy, Mailchimp, ActiveCampaign, and more.
  • Analytics: Google Analytics, Matomo, AppsFlyer, and more.

This makes it easy to combine SEO data with data from platforms like HubSpot or Google Analytics 4 and prove real business impact.

2. Organize and clean up your data

SEO data tends to be disorganized and comes from multiple sources—each with its own naming conventions and formats.

Whatagraph helps you group, blend, and aggregate data so it’s easier to understand.

You can:

  • Create data blends — Combine sources like SEO and Google Analytics together.
  • Group data — Group data from multiple campaigns or countries into regions and tiers.
  • Unify naming — Standardize metrics, dimensions, and country names to make dashboards more consistent.
  • Build custom calculations and formulas — For example, show clicks across multiple keywords and platforms.

3. Select an SEO dashboard template

This is the important (and fun) part.

You can get started by choosing Whatagraph’s pre-built dashboard for search engine optimisation.

Our templates have important KPIs included. For the SEO report template, these include:

  • Organic traffic
  • Keyword rankings
  • Click-through rate
  • Impressions
  • Backlink count
  • Page-level performance
  • And more

Want to white-label your reports? Whatagraph gives you many options. You can:

✅ Add your own custom domain

✅ Embed your logos and custom messaging

✅ Add comment boxes, notes, and headers

✅ Pick different colors for graphs and charts

✅ Change the color schemes in your reports

4. Ask AI to summarize performance

Users don’t want to try to navigate through 30+ sections; they want to know what happened and why it matters. This is what Whatagraph’s AI SEO tool helps with.

You can:

  • Ask our AI to write performance summaries based on your data and add them directly to your reports
  • Edit the performance summaries further to add a human touch
  • Choose short or long summaries

Is your client or executive asking an ad-hoc question? Ask our AI chatbot the question, and it’ll analyze your real-time data and give an answer in seconds.

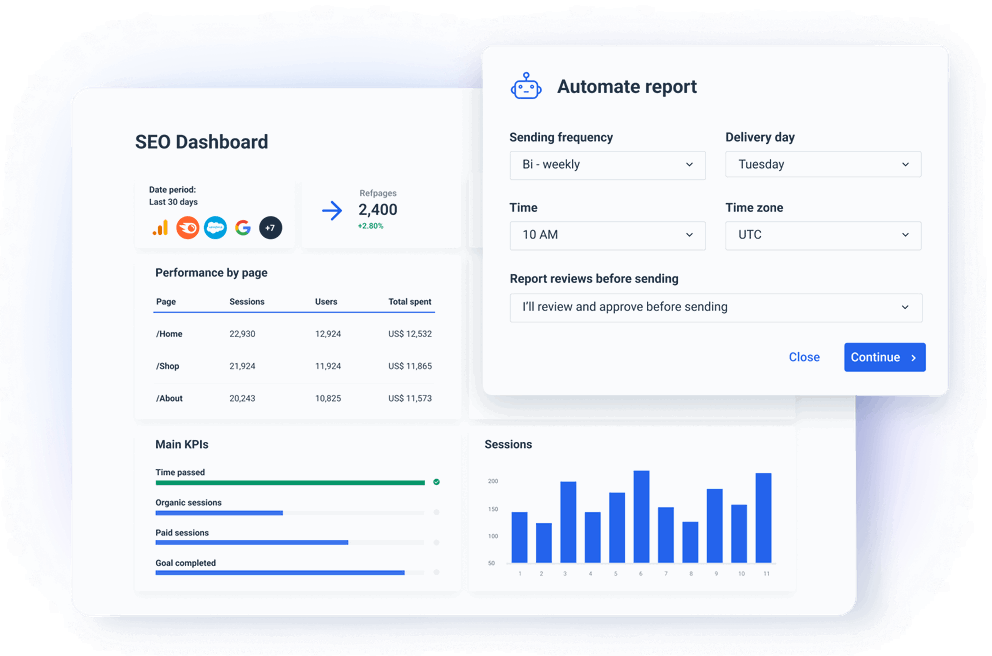
5. Share your dashboard

Once you’ve added KPIs to your SEO monitoring dashboards, it’s time to send it.

On Whatagraph, you’ve got many ways to share your dashboards:

  • Schedule automated emails — White-label your reports and schedule daily, weekly, or monthly reports
  • Send live dashboard links — Create a shareable link and let clients view the up-to-date dashboard any time, in-browser
  • Export to PDF or CSV — Ideal for presentations or internal sharing
  • Push to Looker Studio or BigQuery — For those building more complex BI reporting layers, you can further export your data

What should you include in an SEO reporting dashboard?

Clients don’t want an SEO KPI dashboard filled with 50+ sections. They want a clear, curated report that includes the essentials for their business.

These are the sections we recommend prioritizing:

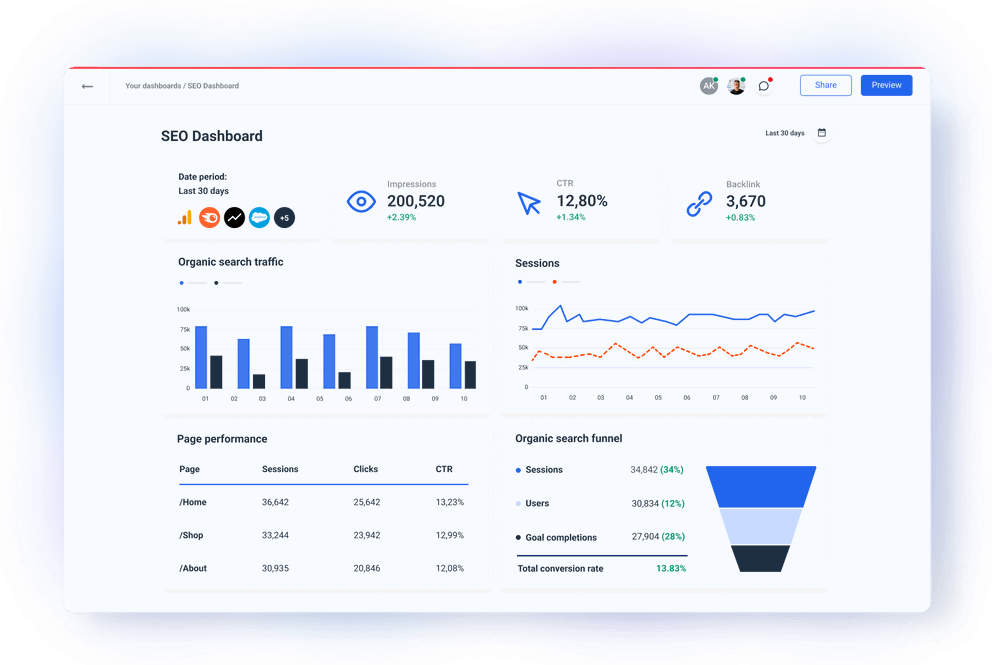
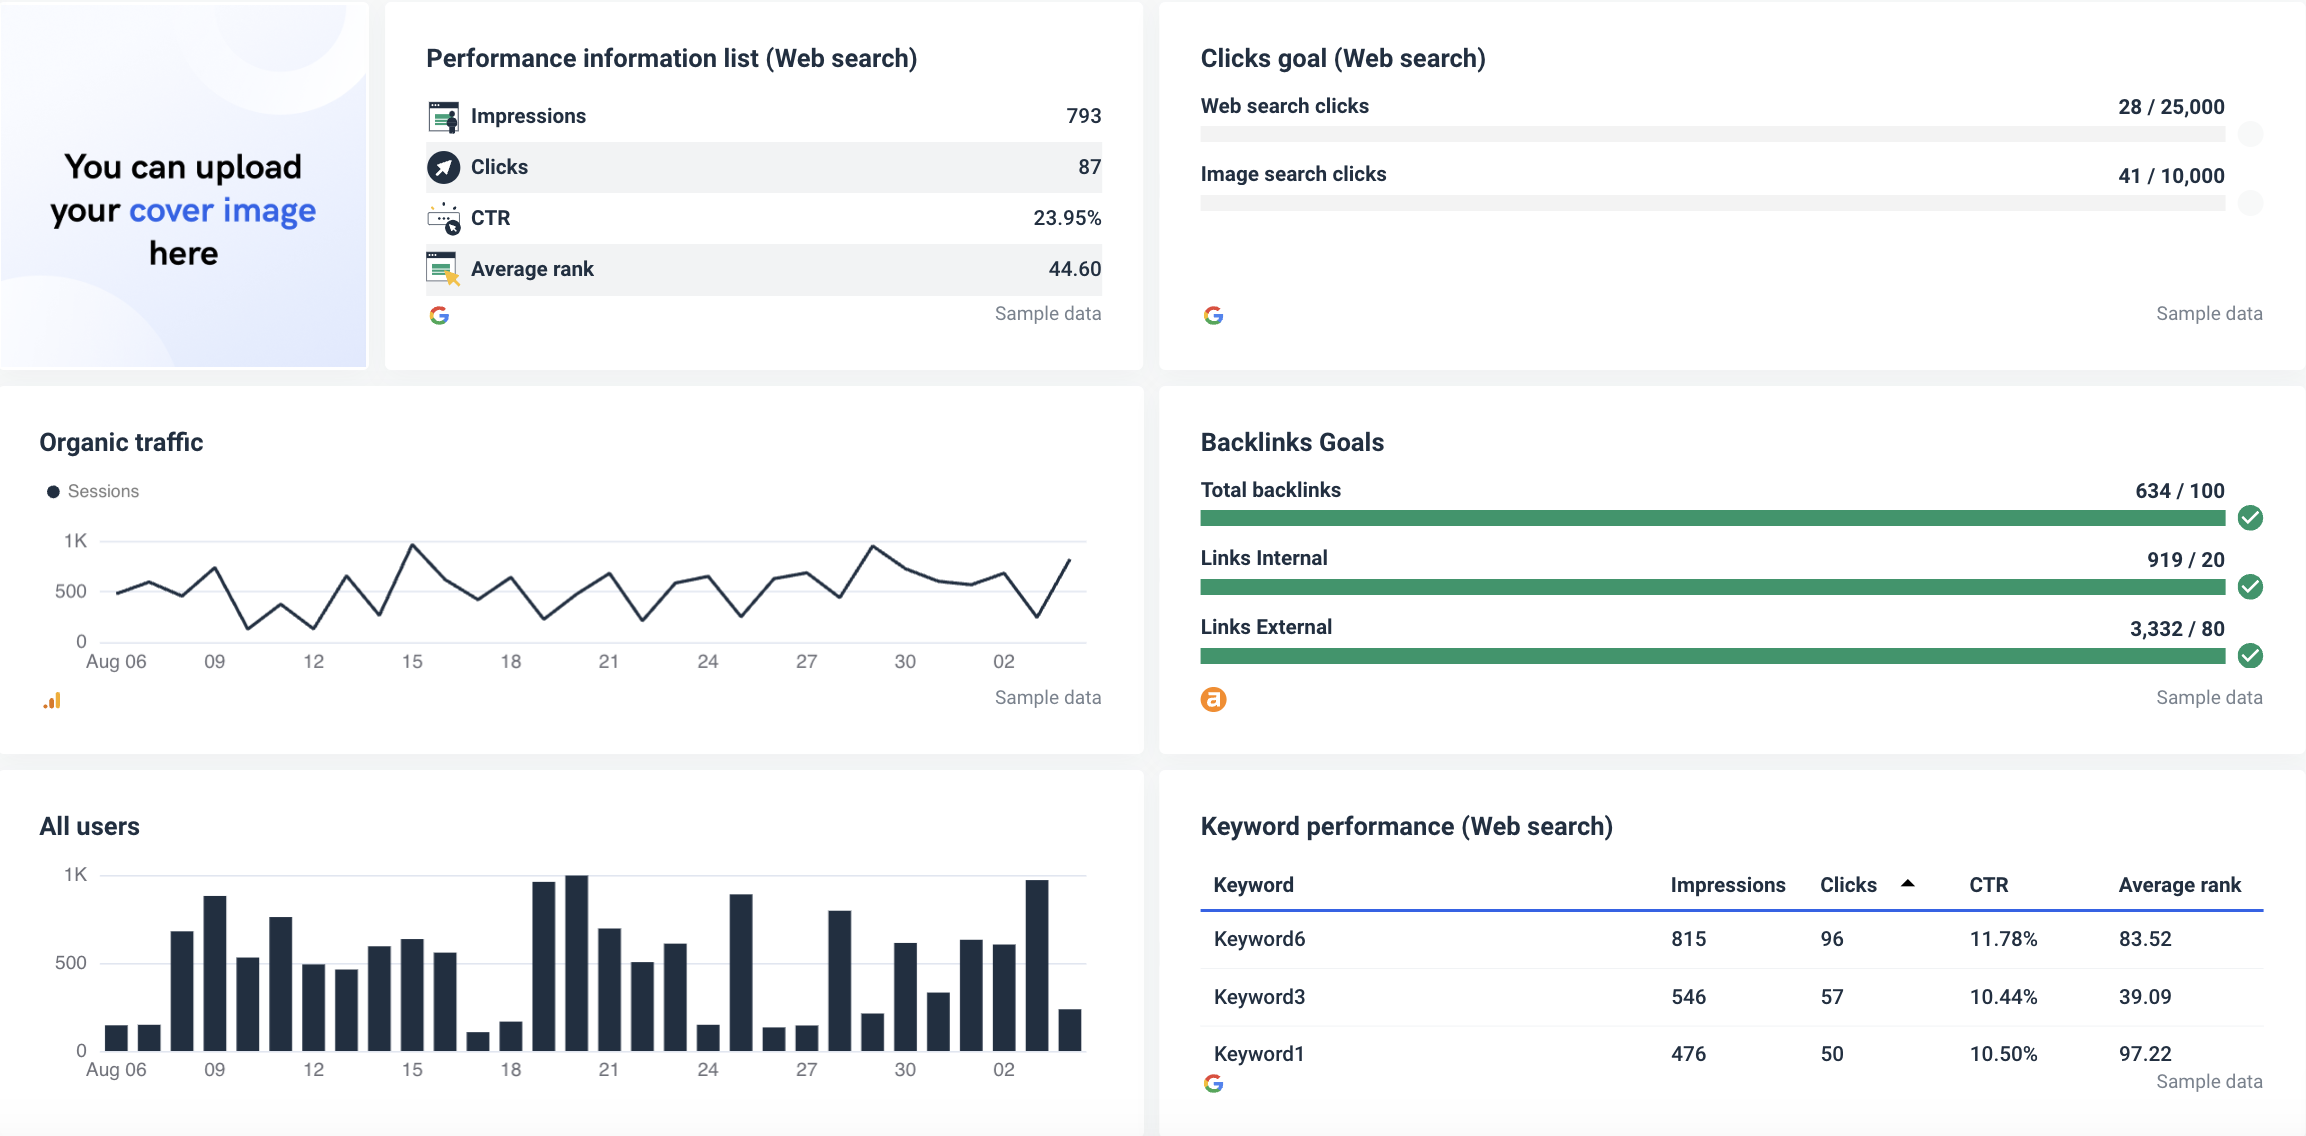
1. Performance information list

This is a snapshot of the overall performance. Think of metrics, like impressions, clicks, CTR, average rank, and more.

Why it matters:

This is the first thing clients see. It gives them a quick snapshot of the SEO performance, for example, for the last month.

2. Organic traffic trend chart

A line graph showing how organic traffic has changed over time (e.g., the last month).

Why it matters:

This chart gives clients a great visual of how SEO efforts are impacting traffic over days, weeks, or months—without them having to dig through numbers.

A goal graph showing total backlinks, internal links, and external links.

Why it matters:

If you do link building, backlink goals show off-page SEO success. To see how effective your link building campaign has been, you can compare backlinks gained in the past month with the total number.

4. Clicks goal

Shows the number of clicks from web and image search, compared to set goals.

Why it matters:

Besides impressions, clicks are the first tangible SEO metric. Track them to show how effective your title tags, meta descriptions, and overall search visibility are.

5. List of keyword rankings

Table of top keywords and their impressions, clicks, CTR, and the average rank.

Why it matters:

Clients want to know if they are ranking for the right keywords. This section gives a quick overview of the top performing keywords and helps to iterate—if necessary.

6. Organic vs. new sessions comparison

Double-value line chart comparing total organic sessions with new sessions from SEO

Why it matters:

This helps you understand how well SEO is bringing in new users versus returning ones. You can use this chart to show clients how SEO supports brand discovery.

7. Individual KPI widgets

Single-value widgets showing client-specific KPIs, like goal completions, sessions, page views per session, and refpages.

Why it matters:

Different clients prioritize different metrics. These individual widgets allow you to add metrics that your clients value to your SEO client dashboards—quickly.

8. Performance by page

A table showing sessions, users, bounce rates, and average sessions for the top pages.

Why it matters:

Not all pages perform the same. This view helps identify which pages are driving results— and where to focus or pivot.

What key metrics should I display on an SEO dashboard?

In the previous section, we looked at key sections to include. But what metrics should you display inside them?

Here are the key metrics to add to your SEO performance dashboards:

Organic traffic:

The number of sessions that came from search results. A key metric for tracking the overall effectiveness of your SEO work.

Impressions:

The number of times your website appeared in search results. Increased impressions can indicate your search visibility is improving, even if clicks haven’t increased yet.

Web search & image search clicks:

The number of clicks from web searches and Google images. A helpful metric for clients to understand where their traffic is coming from.

Click-through rate (CTR):

The percentage of people who clicked on your page after seeing it in search. A high CTR often means your titles and meta descriptions are optimized—and vice versa.

Average rank:

The average position your keywords hold in search results. A simple (but effective) metric for monitoring if your content is moving up or down the SERPs.

Total backlinks:

The total number of backlinks your website has. If you’re actively building them, you can compare this number to newly acquired backlinks to see how effective your link building is.

Goal completions:

The number of completed actions (like signups or purchases) from organic traffic. A great metric to prove ROI, as it ties your SEO work directly to business outcomes.

Frequently Asked Questions

All your questions answered. And if you can’t find it here, chat to our friendly team.

What is automated SEO reporting?

Automated SEO reporting involves automatically aggregating data from SEO tools, adding the data to a dashboard, and sending the SEO dashboard for clients. Tools, like Whatagraph, offer automated SEO dashboards—meaning the data is pulled automatically, and you can schedule automated emails to share the dashboard.

What is an analytics dashboard in SEO?

SEO analytical dashboards are tools that display key metrics about your website's performance in search engines. They help track data like organic traffic, keyword rankings, and backlinks. You can use them to improve visibility, user engagement, and overall search engine optimization strategies.

What is an SEO ranking dashboard?

An SEO ranking dashboard is a tool that tracks your website’s search engine performance. It usually includes keyword rankings, traffic data, and other SEO metrics that you need for monitoring progress and making data-driven decisions to improve visibility and search engine rankings.

How to create an SEO dashboard?

You can create an SEO dashboard following these steps:

1. Define the KPIs you want to track with your dashboard

2. Select the SEO tools you want to take data from

3. Adjust the SEO dashboard template to include the selected KPIs

4. Save the new SEO dashboard as a team template

5. Generate a live link and share with clients or stakeholders (Available with Whatagraph templates)

What to include in a Local SEO dashboard?

Organic rankings, website traffic, local business links, conversion rates, and Google Business Profile Insights are all important local search engine optimization metrics.

Unlike agency SEO dashboards, local SEO dashboards help to demonstrate how your website is performing in local search. 

Are there any free SEO dashboard templates available for beginners?

Although free SEO marketing dashboard templates are available, they’re often limited in features, templates, and support. SEO dashboard software, like Whatagraph, is easy for beginners, thanks to the pre-made templates and drag-and-drop widgets.

You can find 40+ pre-made templates, which already include all SEO KPIs you’d want to monitor. We offer customizable SEO dashboards, meaning you can easily modify the look further with ready-to-use widgets. 

Are there SEO dashboards to monitor rankings?

Yes, SEO ranking dashboards exist, such as the ones offered by Whatagraph. These dashboards let you monitor keyword positions, top pages, search volume, CTR, impressions, and more.