Building a Twitter Audit Report: a Walkthrough
Social media marketing managers conduct audits to help assess the effectiveness of their strategies. Twitter is no different - a quality Twitter audit must be conducted and campaign performance measured.

Jan 21 2021 ● min read
Whatagraph is a tool used to aggregate digital marketing data and present it in a visually appealing way. This works with a variety of popular digital marketing tools, one of which is a popular social media platform – Twitter.
Understanding how your Twitter campaign is progressing is an important part of fulfilling the agreements you have made with your client or for your higher-ups. A comprehensive Twitter Analytics report will help you collect and deliver main performance statistics efficiently.
In today’s article, we’ll show you how to build a Twitter audit report. It should be a part of the social media audit. You’ll learn how to disclose your achievements to your clients or superiors in a way that's easy to understand. You can also
Let's understand "why" you need conduct a Twitter audit
When you first signed a contract with your client or were tasked with overseeing a campaign within your firm, you must have discussed what you want to achieve with your Twitter account. To remain accountable for these goals, you need a way to track the metrics and present them.
Reporting on the overall performance of your Twitter campaigns, as they relate to the objectives of your client or your firm, is what keeps them and you moving forward.
What does a great Twitter audit entail exactly? Let's jump into the meat of this article and start building a report.
Condensed overview of the vitals
On its own, Twitter doesn't pose a lot of different metrics or insights to track. The metrics that are found here – aside from ads – are all relatively simple to understand. But no matter how simple it seems when managing a business, organization, and structure, as it pertains to metrics, is important.
That's where a condensed, and summarized overview of Twitter metrics come into play. This will be the first portion of your Twitter audit.
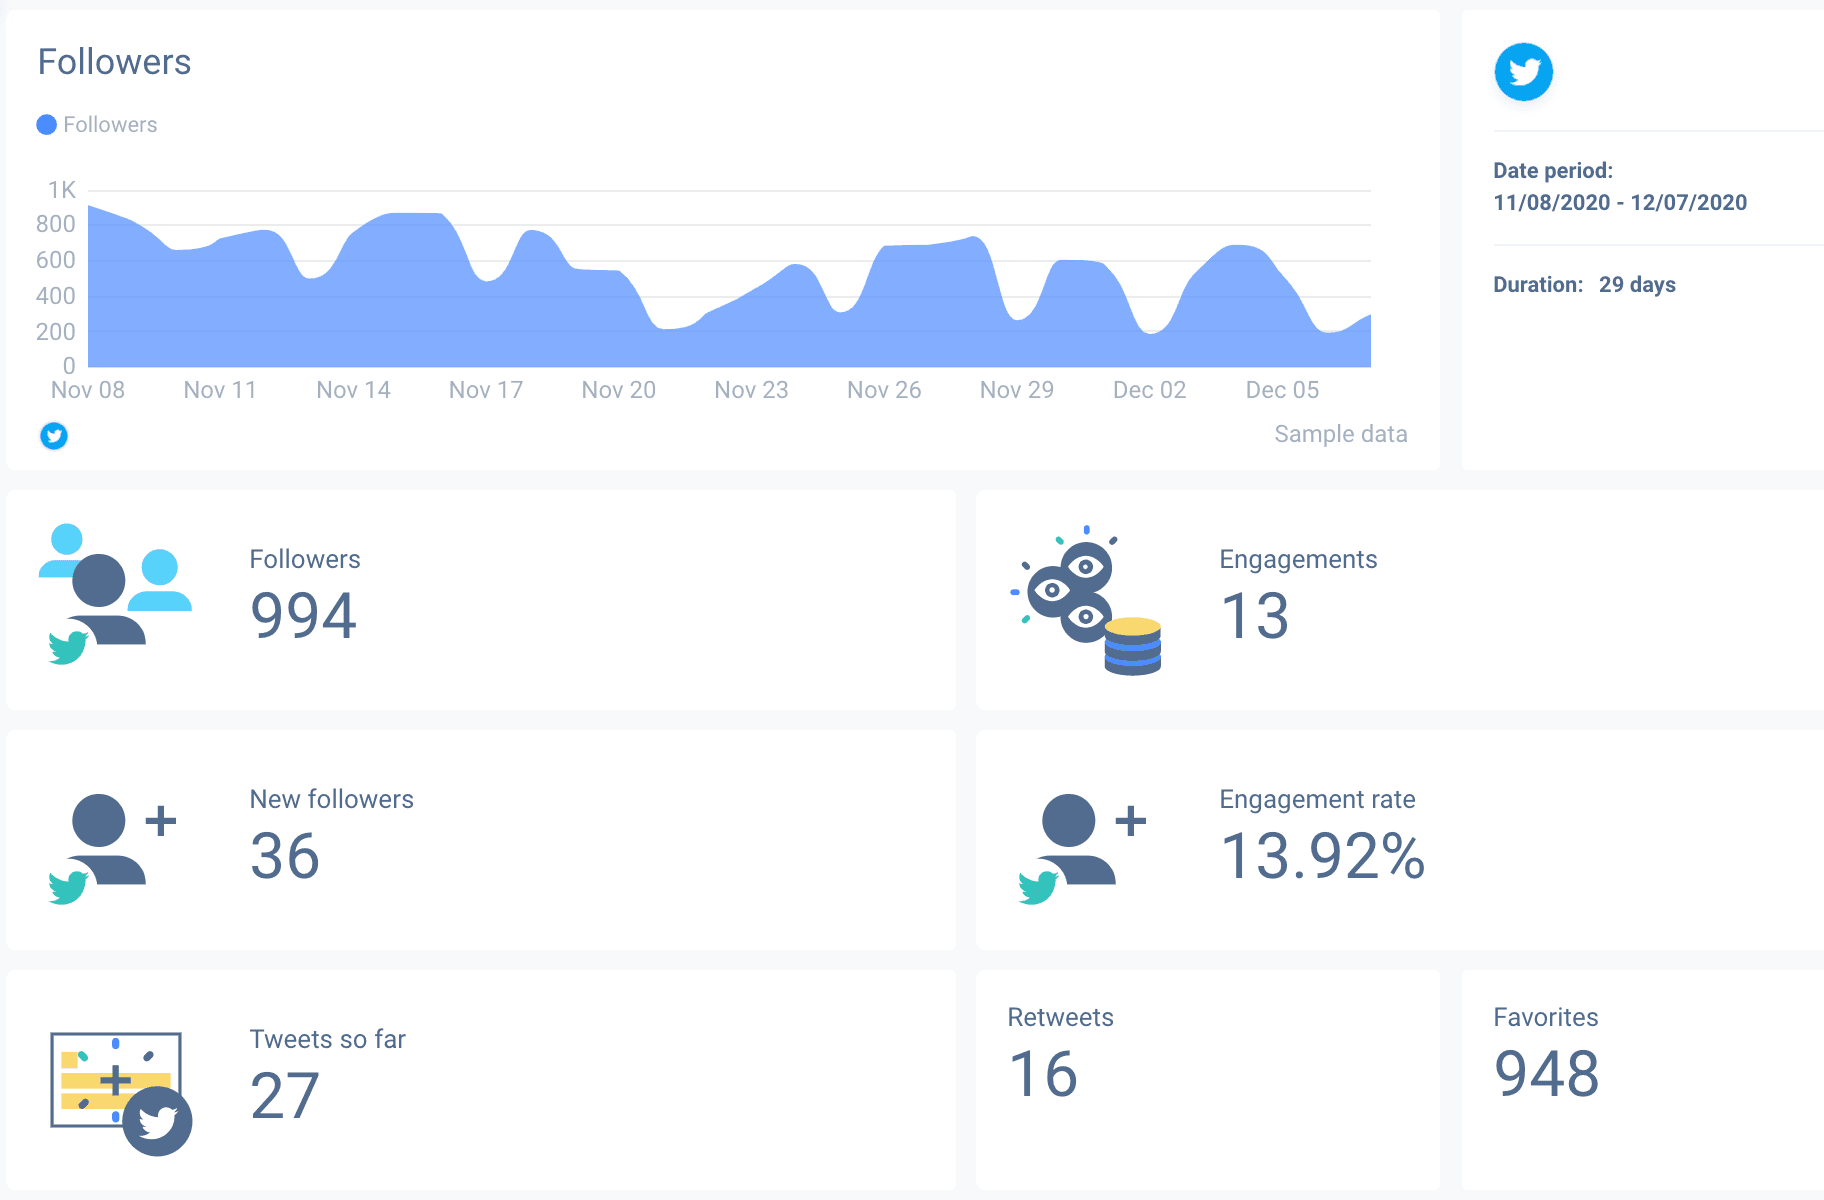
Below is an example of what your initial report should look like. From the client's (or firm's director's point of view), these metrics are clear, concise and provide a nice summary of how Twitter performed. Follower growth numbers are at the top, represented by a simple line graph, showing any fluctuation across a specific reporting period.
Tweet engagement metrics in aggregate should also be here at the top of the report.
Compare data and dates - what's the progress looking like?
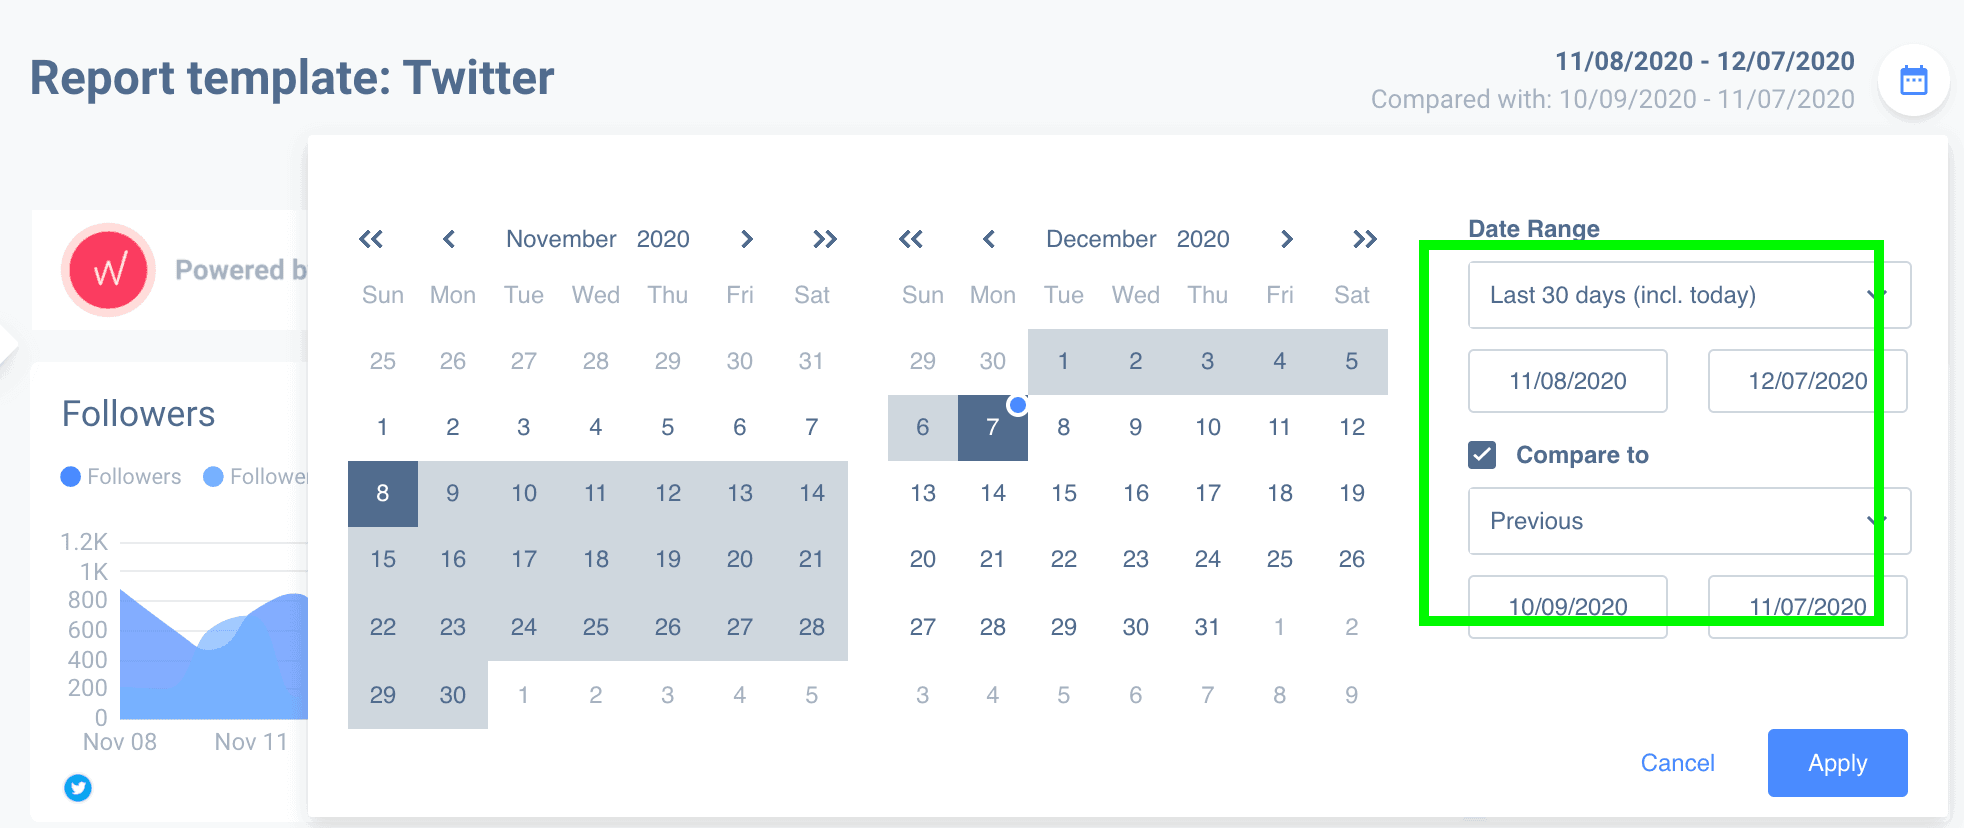
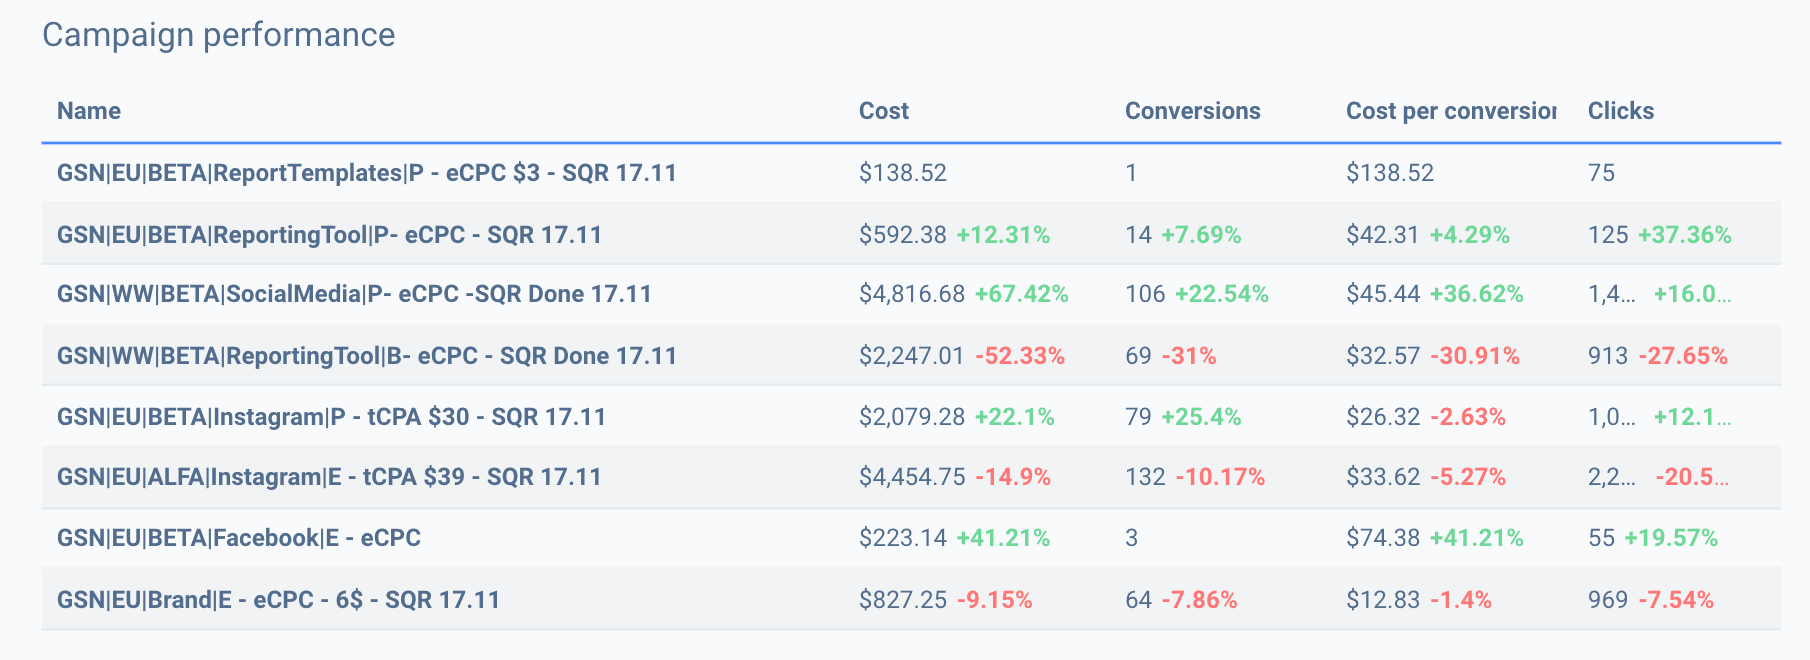
When you’re presenting digital marketing progress - regardless if it's a simple audit of your Twitter or any other digital marketing platform - it's strongly advised that you provide an option to compare data against previous time periods. This is just an easy and effective way to assess the progress that's substantiated by data.
Case in point:
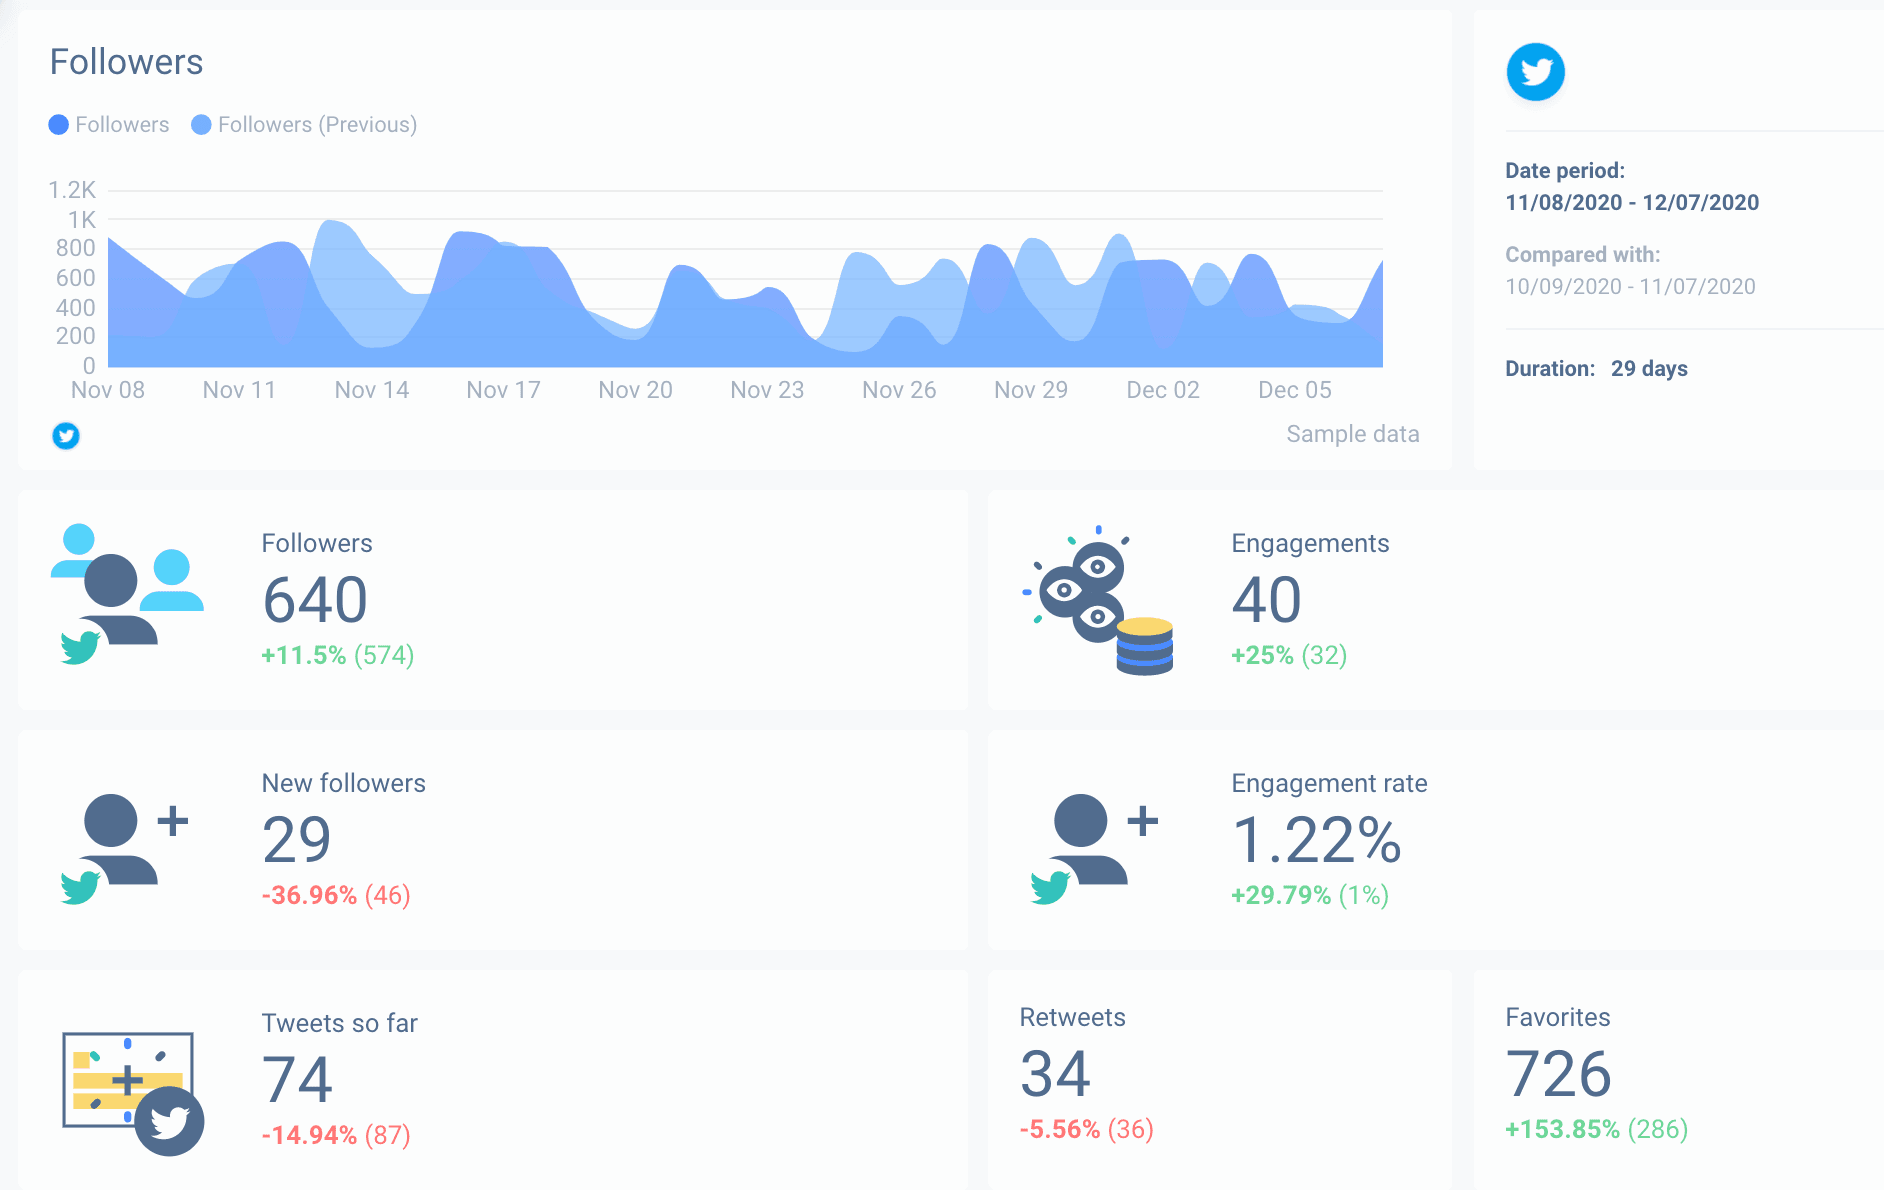
As you can probably tell, comparing a previous reporting period is the simplest way to analyze current Twitter standing. Improvement is clearly shown by green and red numbers: growing, stagnating, or decreasing Twitter page performance.
Individual Tweet assessment
A Twitter campaign is nothing without some witty tweets that fit within the 280 character limit. It's a rather stringent limit, but a lot of value can be derived from such a small number of letters.
In this portion of the report, we’ll deep dive into each individual Tweet and its impact on your Twitter profile.
Did your client's, marketing director's, or your own Tweet idea pan out as you hoped? Well, this last part of the report will answer exactly that and with the Twitter reporting tool, it can be done within minutes.
The example shown above shows a list of the top-performing tweets of the month (that's the reporting period we’ve selected).
List the top performing – and the worst performing tweets and look for common variables. What got the audience to engage? What ticked them off? Use tweet performance insights to improve your next 280 characters.
Conclusion of the audit creation
Twitter is an extremely effective advertising platform that has the potential to reach a wide audience. The time will come when you will have to report Twitter page performance – hopefully, this article has given you some audit strategies that you'll incorporate yourself.
You are also more than welcome to try out our pre-built Twitter audit report template for free. The report is already built for you, just connect your Twitter account and your data will be extracted automatically. Enjoy!
Published on Jan 21 2021
WRITTEN BY
Mindaugas SkurvydasMindaugas is the SEO specialist at Whatagraph with experience in driving organic traffic and improving SERP visibility for industries like B2B martech, B2B and B2C finance. He loves to be at the edge of new developments by maintaining numerous contacts with other publishers in the SaaS niche. When he’s not writing he’s pushing our technical SEO strategies into implementation.