How to Create the Ultimate Twitter Analytics Report [+Template]
Whether it’s about identifying which messages resonate, spotting successful campaigns, or holes in your customer service, Twitter analytics data can transform seemingly random social interactions into game-changing insights. However, consolidating all this data into a meaningful marketing strategy would be impossible without a capable data visualization solution. Let’s show you how to create engaging Twitter analytics reports using an automated reporting tool.

Mar 21 2023 ● 5 min read
![How to Create the Ultimate Twitter Analytics Report [+Template]](https://media.whatagraph.com/twianrep_1ec5e7d210.png?width=992)
What is a Twitter analytics report?
A Twitter analytics report is a type of marketing report that compiles the behaviors and actions that audiences take when they come across your posts or profile — the clicks, follows, expands, and more — and breaks down that data to help you track Twitter performance and refine your strategy.
Twitter metrics and KPIs are essential for understanding who’s interacting with your tweets and how your account is performing overall. Even if you log in day after day and generally understand how the account is running, a Twitter analytics report gives you a bird’s eye perspective that helps put numbers to those understandings.
How to get a Twitter Analytics report?
When you sign in to your Twitter account, you can access Analytics through the sidebar menu on the app's desktop version. Click the “...” icon at the bottom of the menu and select Analytics. You'll get a dashboard with tabs for various reporting features.
However, native Twitter Analytics reports are not suitable for client reporting or sharing with a wider team who may not understand all the metrics it delivers.
3 reasons to create Twitter analytics reports
Apart from tracking growth and establishing trends over time, Twitter analytics reports can tell you what your client’s audiences really want. Without this data, you can never be sure what type of content will hit or miss the mark.
However, besides these immediate benefits, expertise in Twitter reporting can prove beneficial to both you and your clients in other ways as well.
1. Better understanding and transparency
There’s hardly anything more satisfying for a marketer than to dedicate significant time and resources to a project that bears the fruit of success. But what happens when your results are not on the same page as the client’s expectations?
Although this is one of the worst scenarios, you can use the Twitter analytics report to gain the upper hand.
First of all, make sure you create and send your reports frequently. This will help you spot what’s not working sooner rather than later.
Imagine the horror of realizing that a campaign you’ve been nurturing for some time now has actually been falling apart.
The only worse thing is having to break the news to your client.
On the other hand, if your monthly report shows that something’s not right, you can use it to target the issue. The whole point lies in meeting with your clients regularly so you can both be on the same page regarding results and expectations.
The key points to discuss in those meetings are as follows:
- Why the results haven’t met expectations
- What we can do as a team to improve this
- Why the results are really good
- What we can do to make them even better
This is an excellent opportunity to show your client that you’re their partner and not just a vendor providing “the next miracle tool”.
Talking points 3 and 4, however, are a great opportunity to upsell your client and offer additional services that will make their Twitter campaign even more successful.
2. You can upsell your services
You may be hired to do a specific one-time project, but when the results are great, you should use every opportunity to prove you can do much more for the client.
How?
By proving your worth outside of showing that you can successfully run a Twitter campaign.
Let’s say that your main call to action (CTA) is a new web-based tool. New leads are landing at the website through your Twitter and submitting a gated form to get access to a trial. Incidentally, the majority of clients choose to receive emails on updates and discounts.
You can quickly turn this into a lucrative scenario for you and your clients. Offer the prospects to
- Create an automated lead follow-up email that the prospect receives immediately after download, with a sales-focused CTA.
- Create a multi-touch drip campaign where several emails containing valuable resources for the trial period are sent periodically.
- Write a series of blogs on different use cases for the app.
- Repurpose the blog content into a whitepaper, a webinar, or a series of social media posts.
- Recommend a Twitter Ads campaign.
- Run a similar campaign on Facebook, provided there’s little overlapping between the audiences.
These are just some examples of how you and your client can monetize the success of your Twitter campaign, as showcased by a Twitter analytics report.
3. Make decision-making easier for clients
Before you run their Twitter campaign, it’s customary that you and your client agree upon the KPIs and define what the success looks like. This way, there are no surprises about what actions to take based on specific results.
But as the campaign gains momentum, it’s easy to get overloaded by the influx of data. Twitter offers plenty of data you can use to measure a campaign’s success, which is always a good thing.
The problem is that your clients may not have the time or skills to filter through all those stats and draw meaningful insights.
Your job as a marketer is to sift through all the available data and unearth metrics that are the most important to your clients.
For each Twitter metric, you can show how much you’re spending per lead, so your clients can tell how their money is spent.
A Twitter analytics report can also shed more light on which campaigns are worth funding. A client may be inclined to shut down a high-rolling campaign, which can be a logical step when observed on its own. However, if you have two similar campaigns, you can also prove that the more expensive one also brings in more high-quality leads.
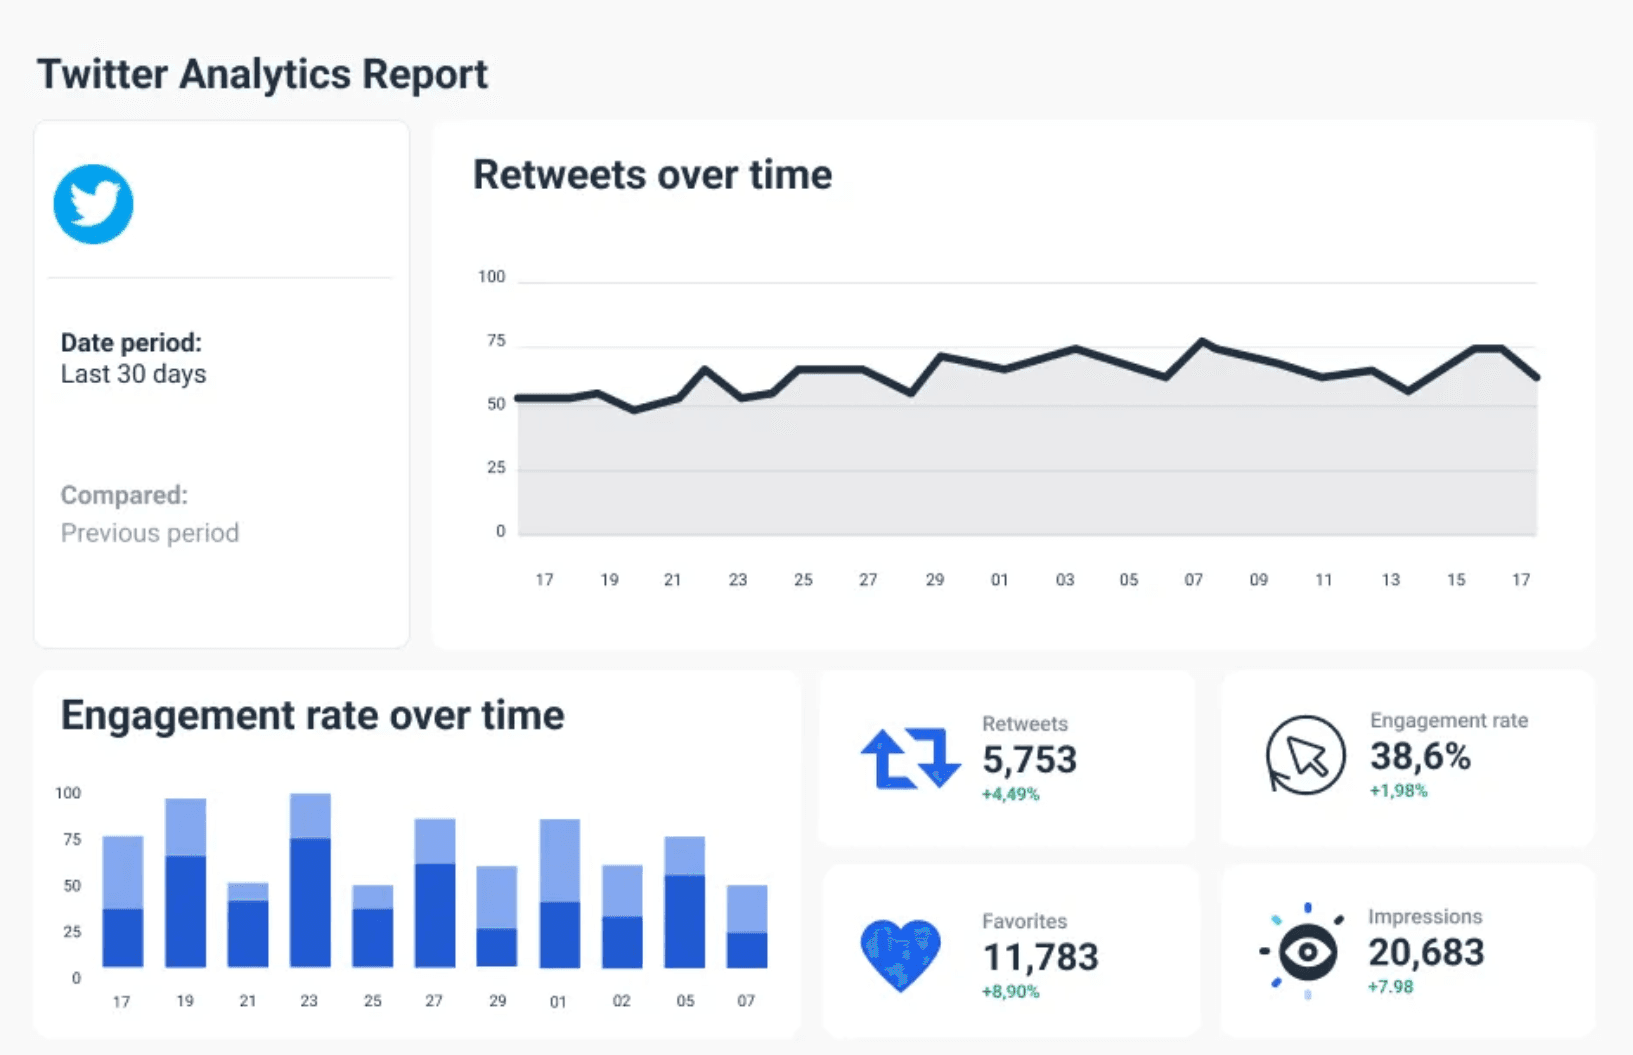
6 most important metrics you must include in your Twitter analytics report
Social media analytics has its own language, and Twitter is no exception. It’s only too easy to get overwhelmed by mentions, hashtags, tweet impressions, interaction, and everything in between.
Here are the most important metrics you should include in your Twitter report.
- Twitter impressions: The number of views your tweets received tells you how many people saw your content. Combined with engagements, it gives you an engagement rate for each tweet.
- Engagement: Engagements are all the interactions people have had with your tweet. This includes link clicks, hashtag clicks, expand to view full tweets, clicking on your profile photo and username, etc. A high-level overview of your engagements allows you to identify which tweets are working for you and which aren’t.
- Mentions: A mention is when another Twitter account tags your account in a post. Positive mentions often come as a testimonial of a happy client, while negative are usually a sign of a dissatisfied customer or employee.
- Followers: The number of followers you gained or lost over a specific time period. Is one of the main indicators of growth besides engagement metrics.
- Likes: This metric is related to the number of people who like your tweets. Likes are also part of Engagement. While not so great as a reply, a like is still a sign that someone read your content… and liked it.
- Replies: A reply is a direct response to one of your tweets, unlike a retweet, which is a “share” on other platforms. They are great for building authentic relationships with your audience, because when someone replies to your content, the conversation goes on.
How to create a Twitter analytics report in 6 easy steps using the Whatagraph template
1. Determine the client’s needs
Before you start writing an actual report, you need to consider who is going to read your report. Depending on the seniority of the person and their engagement in marketing, the report should have a different structure and content.
In the same way, you need to consider the frequency at which you’ll send out your reports. The more frequent your reports, the more details you can cover. For example, a weekly Twitter analytics report can cover more metrics than a report you send out every month to C3 executives.
2. Fire up a reporting tool
As we’ve seen, a Twitter campaign report may include up to 13 KPIs. If you want to add more granularity to the report, you will include performance for the top tweets to the point that trying to crunch them manually and visualize them in your report can take hours and hours of time that you better use more creatively.
Even worse, imagine manually extracting all those metrics and trying to make the whole report make sense. The room for error is enormous.
You need a reporting tool like Whatagraph. Connect your client’s Twitter account once to your Whatagrap account, and the data is refreshed every time you create a new dashboard.
No more switching back and forth through different dashboards for hours to make the numbers match. Connect your accounts once, and the Twitter data fills in and updates automatically in the future.
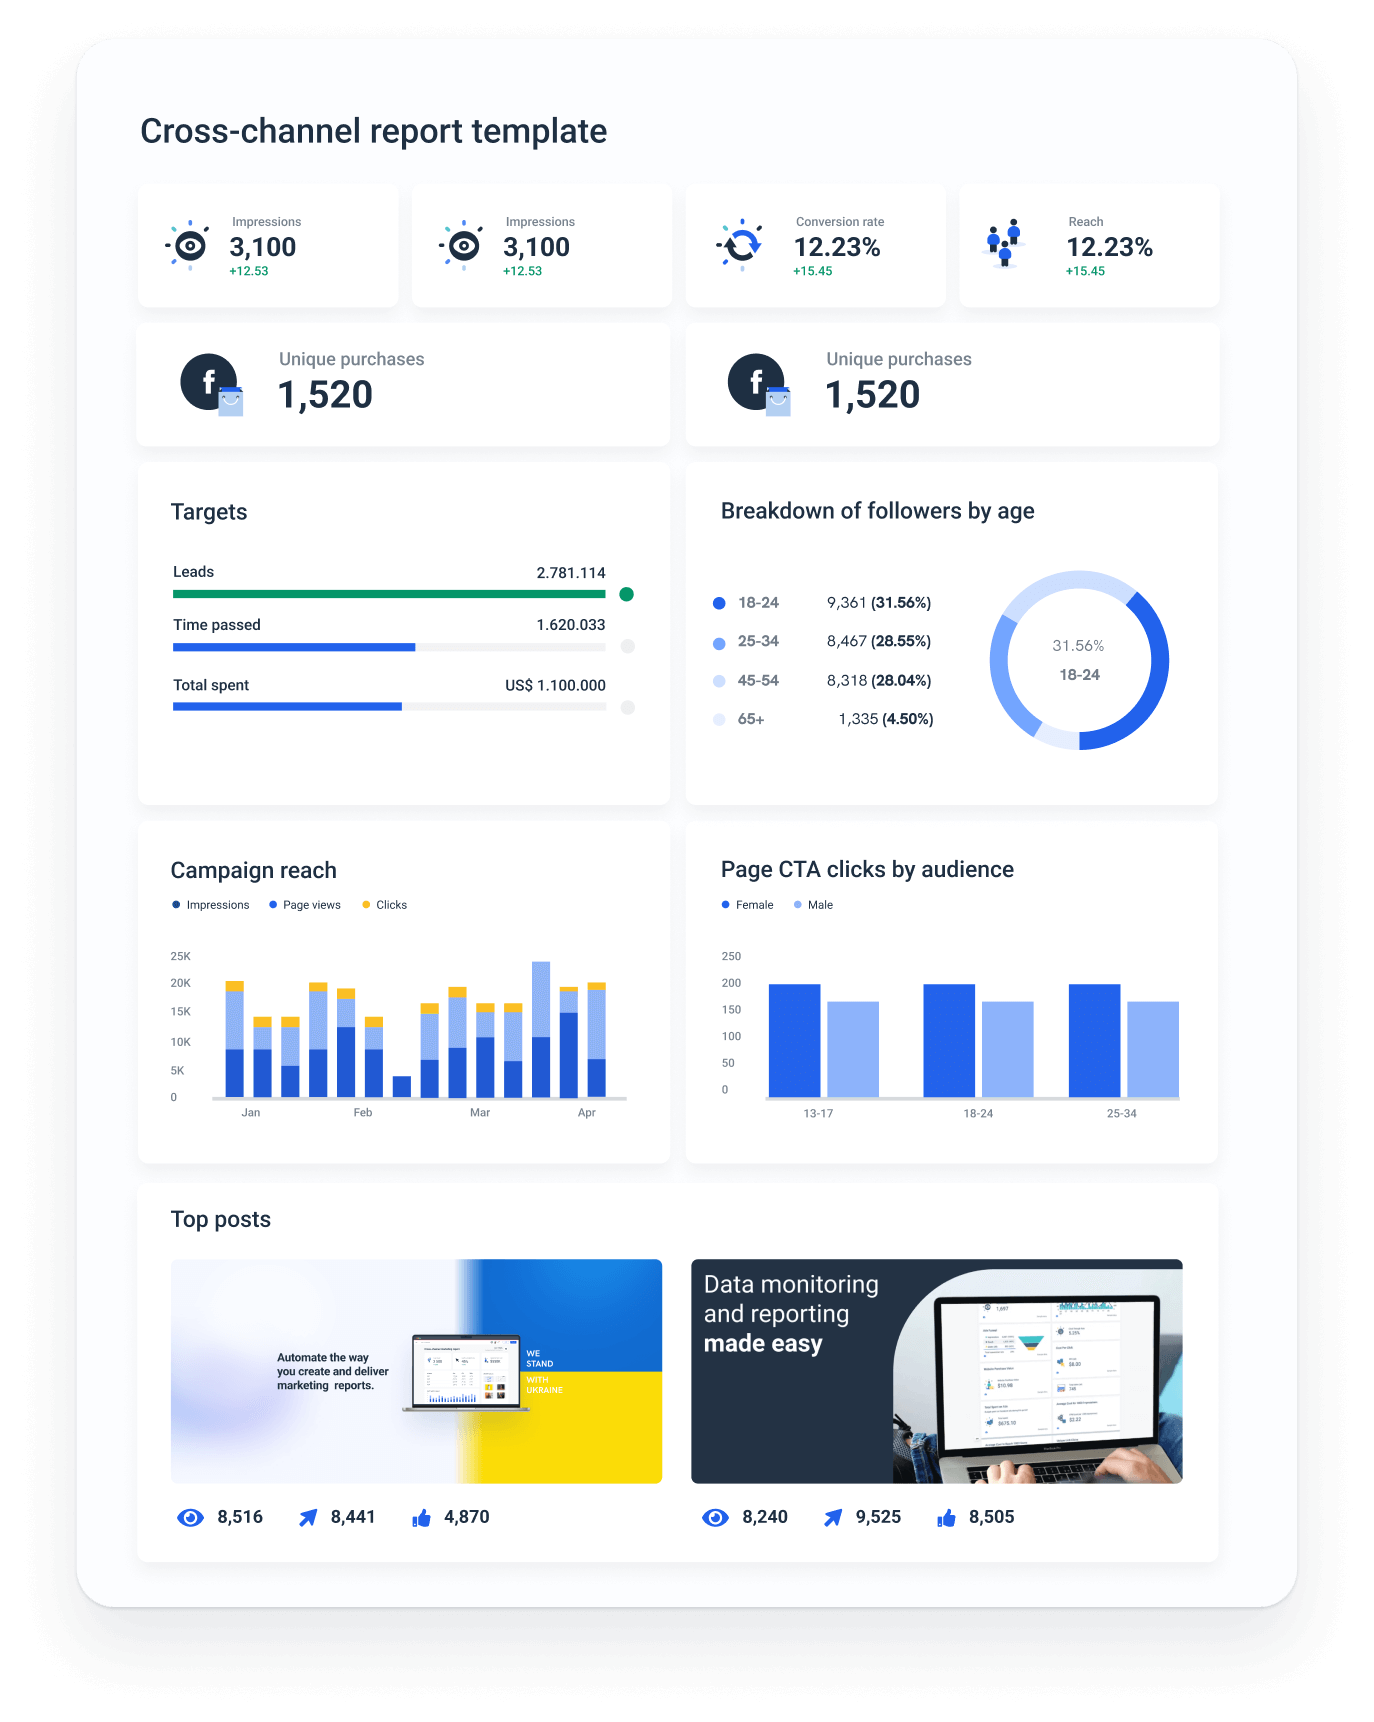
But there’s more to Whatagraph than just automating Twitter reports. With Whatagraph, you can also create multi-channel marketing dashboards using data from different social media platforms, web analytics, SEO, PPC, and eCommerce tools using attractive customizable dashboards.
And it’s the same point-and-click process all the way — whether you want to create a Facebook Ads metrics report, visualize data from LinkedIn, or even Google Sheets.
Connect your sources once and create an unlimited number of reports.
Yes, you heard it right! There’s no limit to the number of reports you can create, edit, and send with Whatagraph.
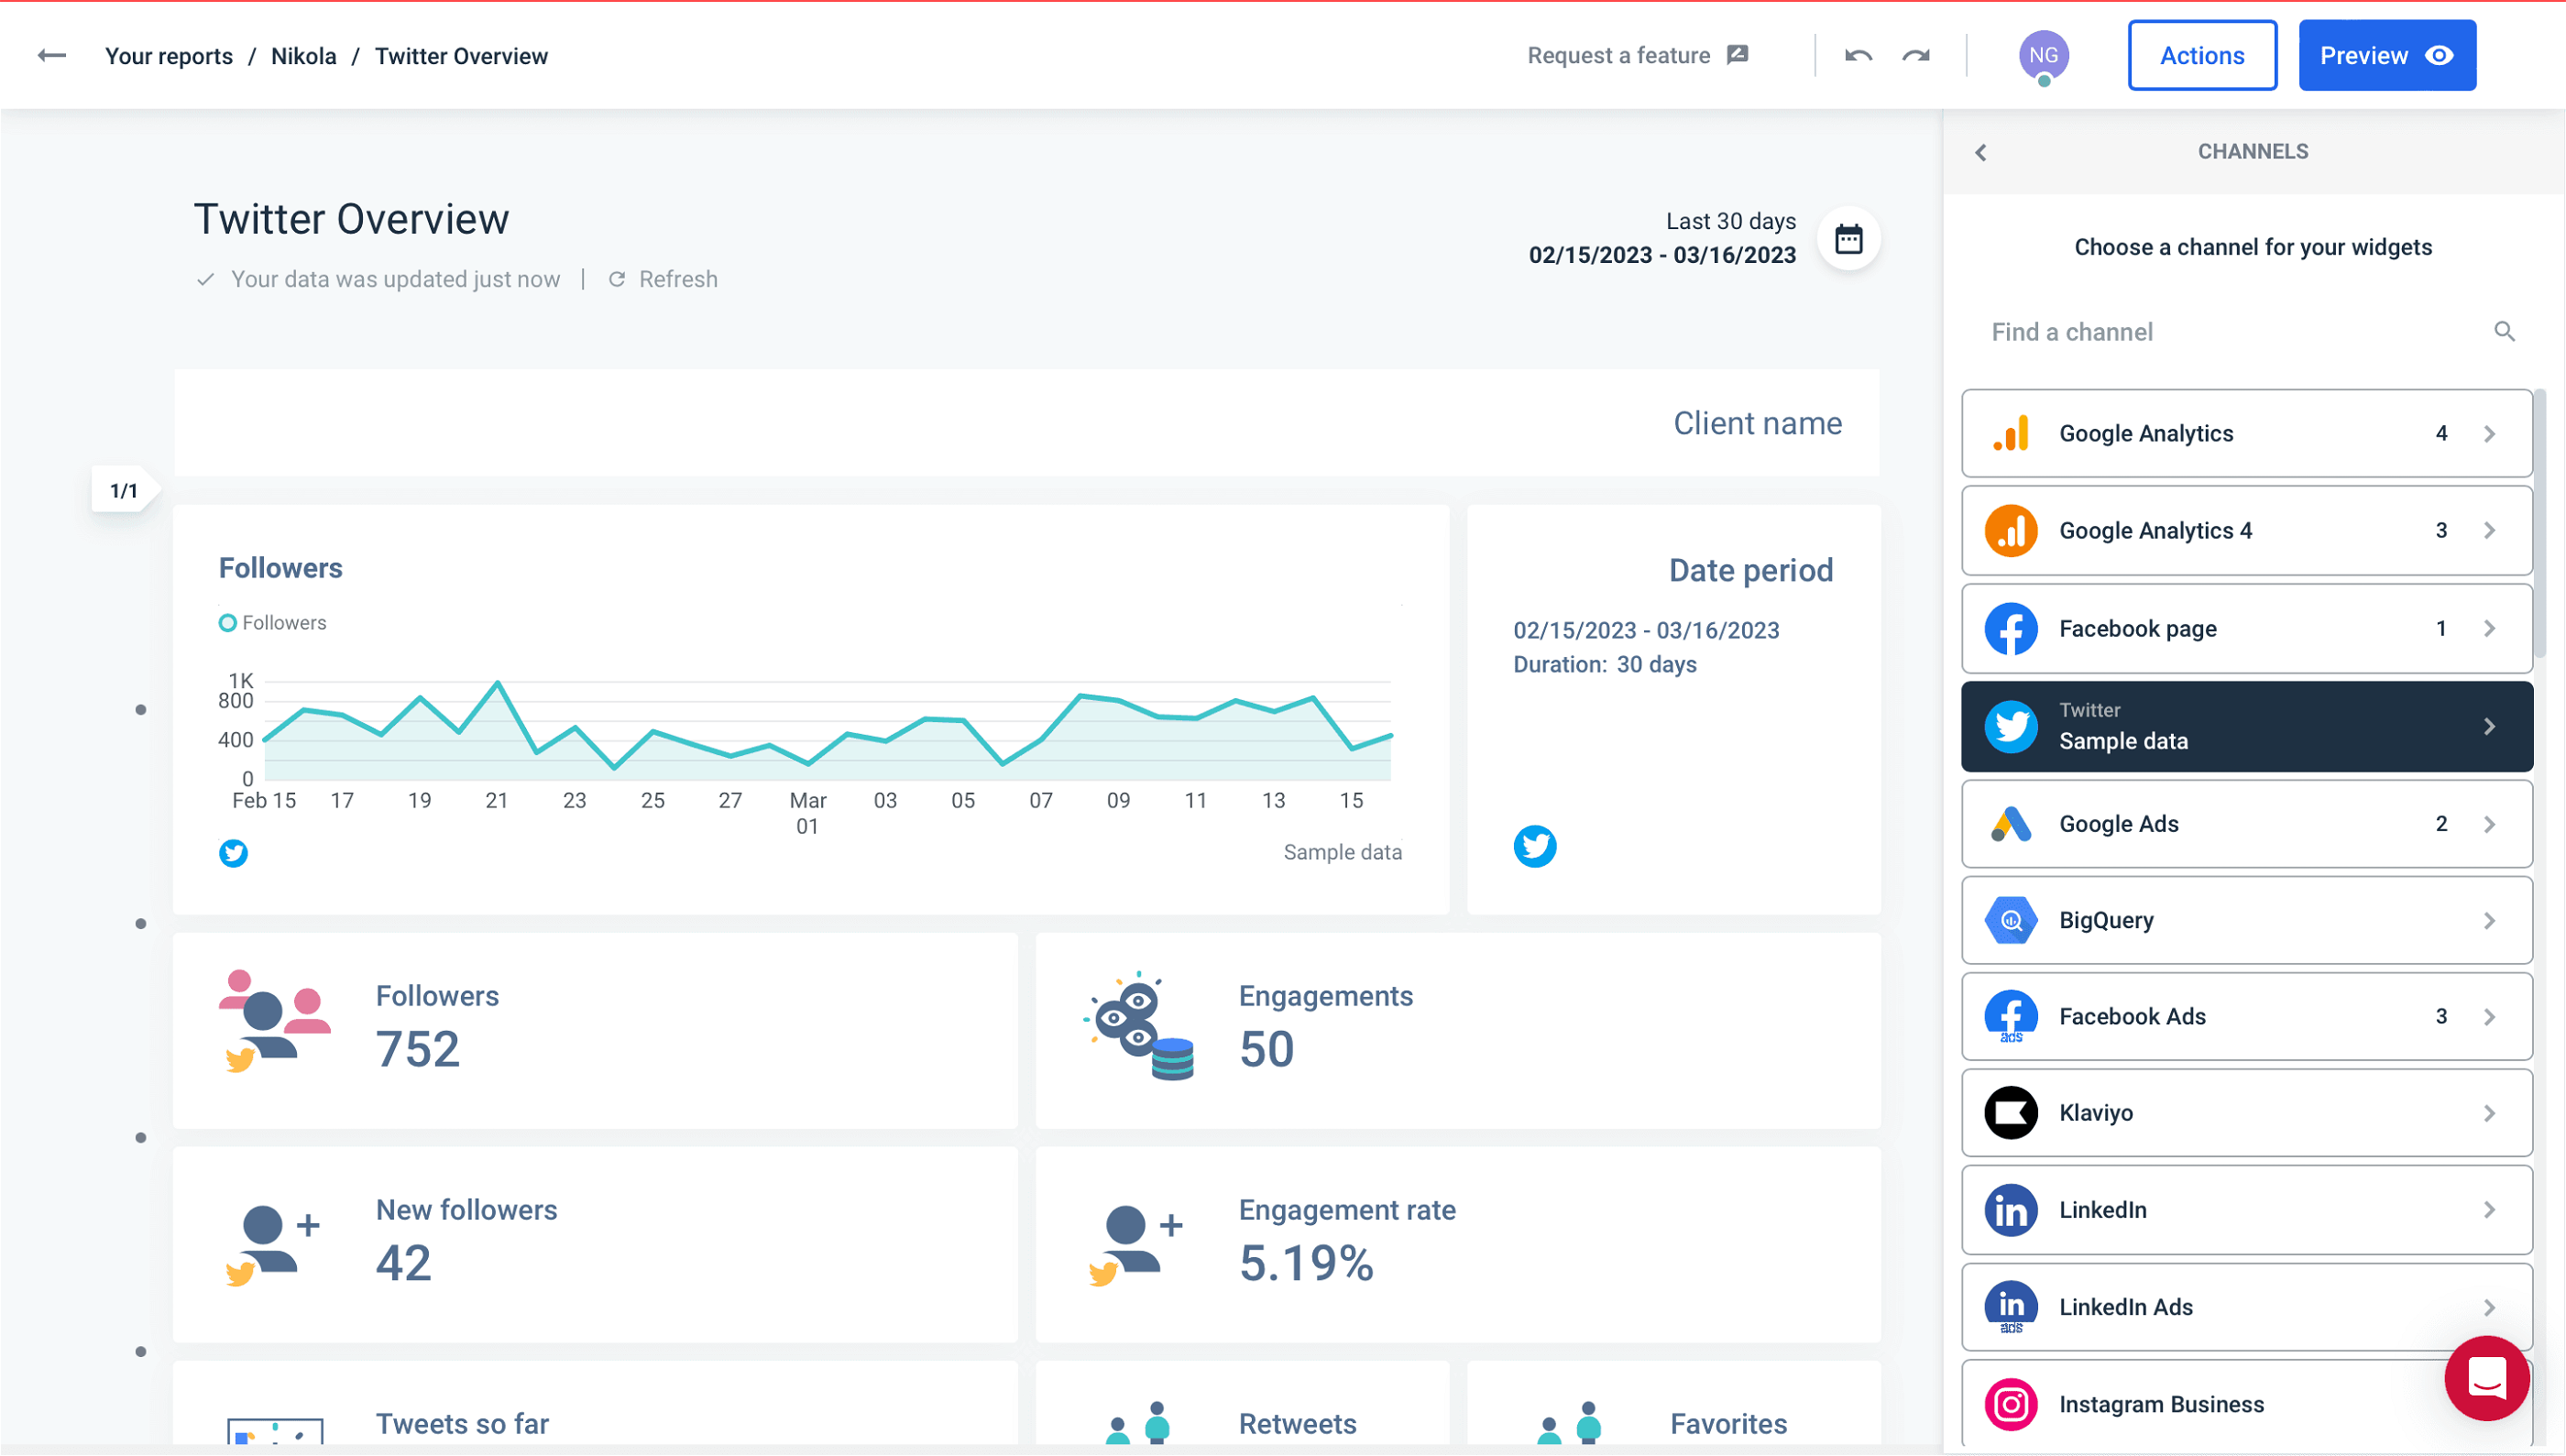
3. Add the Twitter account as a source
Now we’ll show you how to add a Twitter account as a data source.
- Open Whatagraph and click Create new in the top-right corner.
- Choose to Create from template.
- Scroll down to find the Twitter template and click on it.
- Now you have a Twitter report with basic metrics.
- To add a Twitter source, click Actions > Manage Data Sources, and then Browse More Sources.
- Select Twitter Integration and pick one of the available accounts.
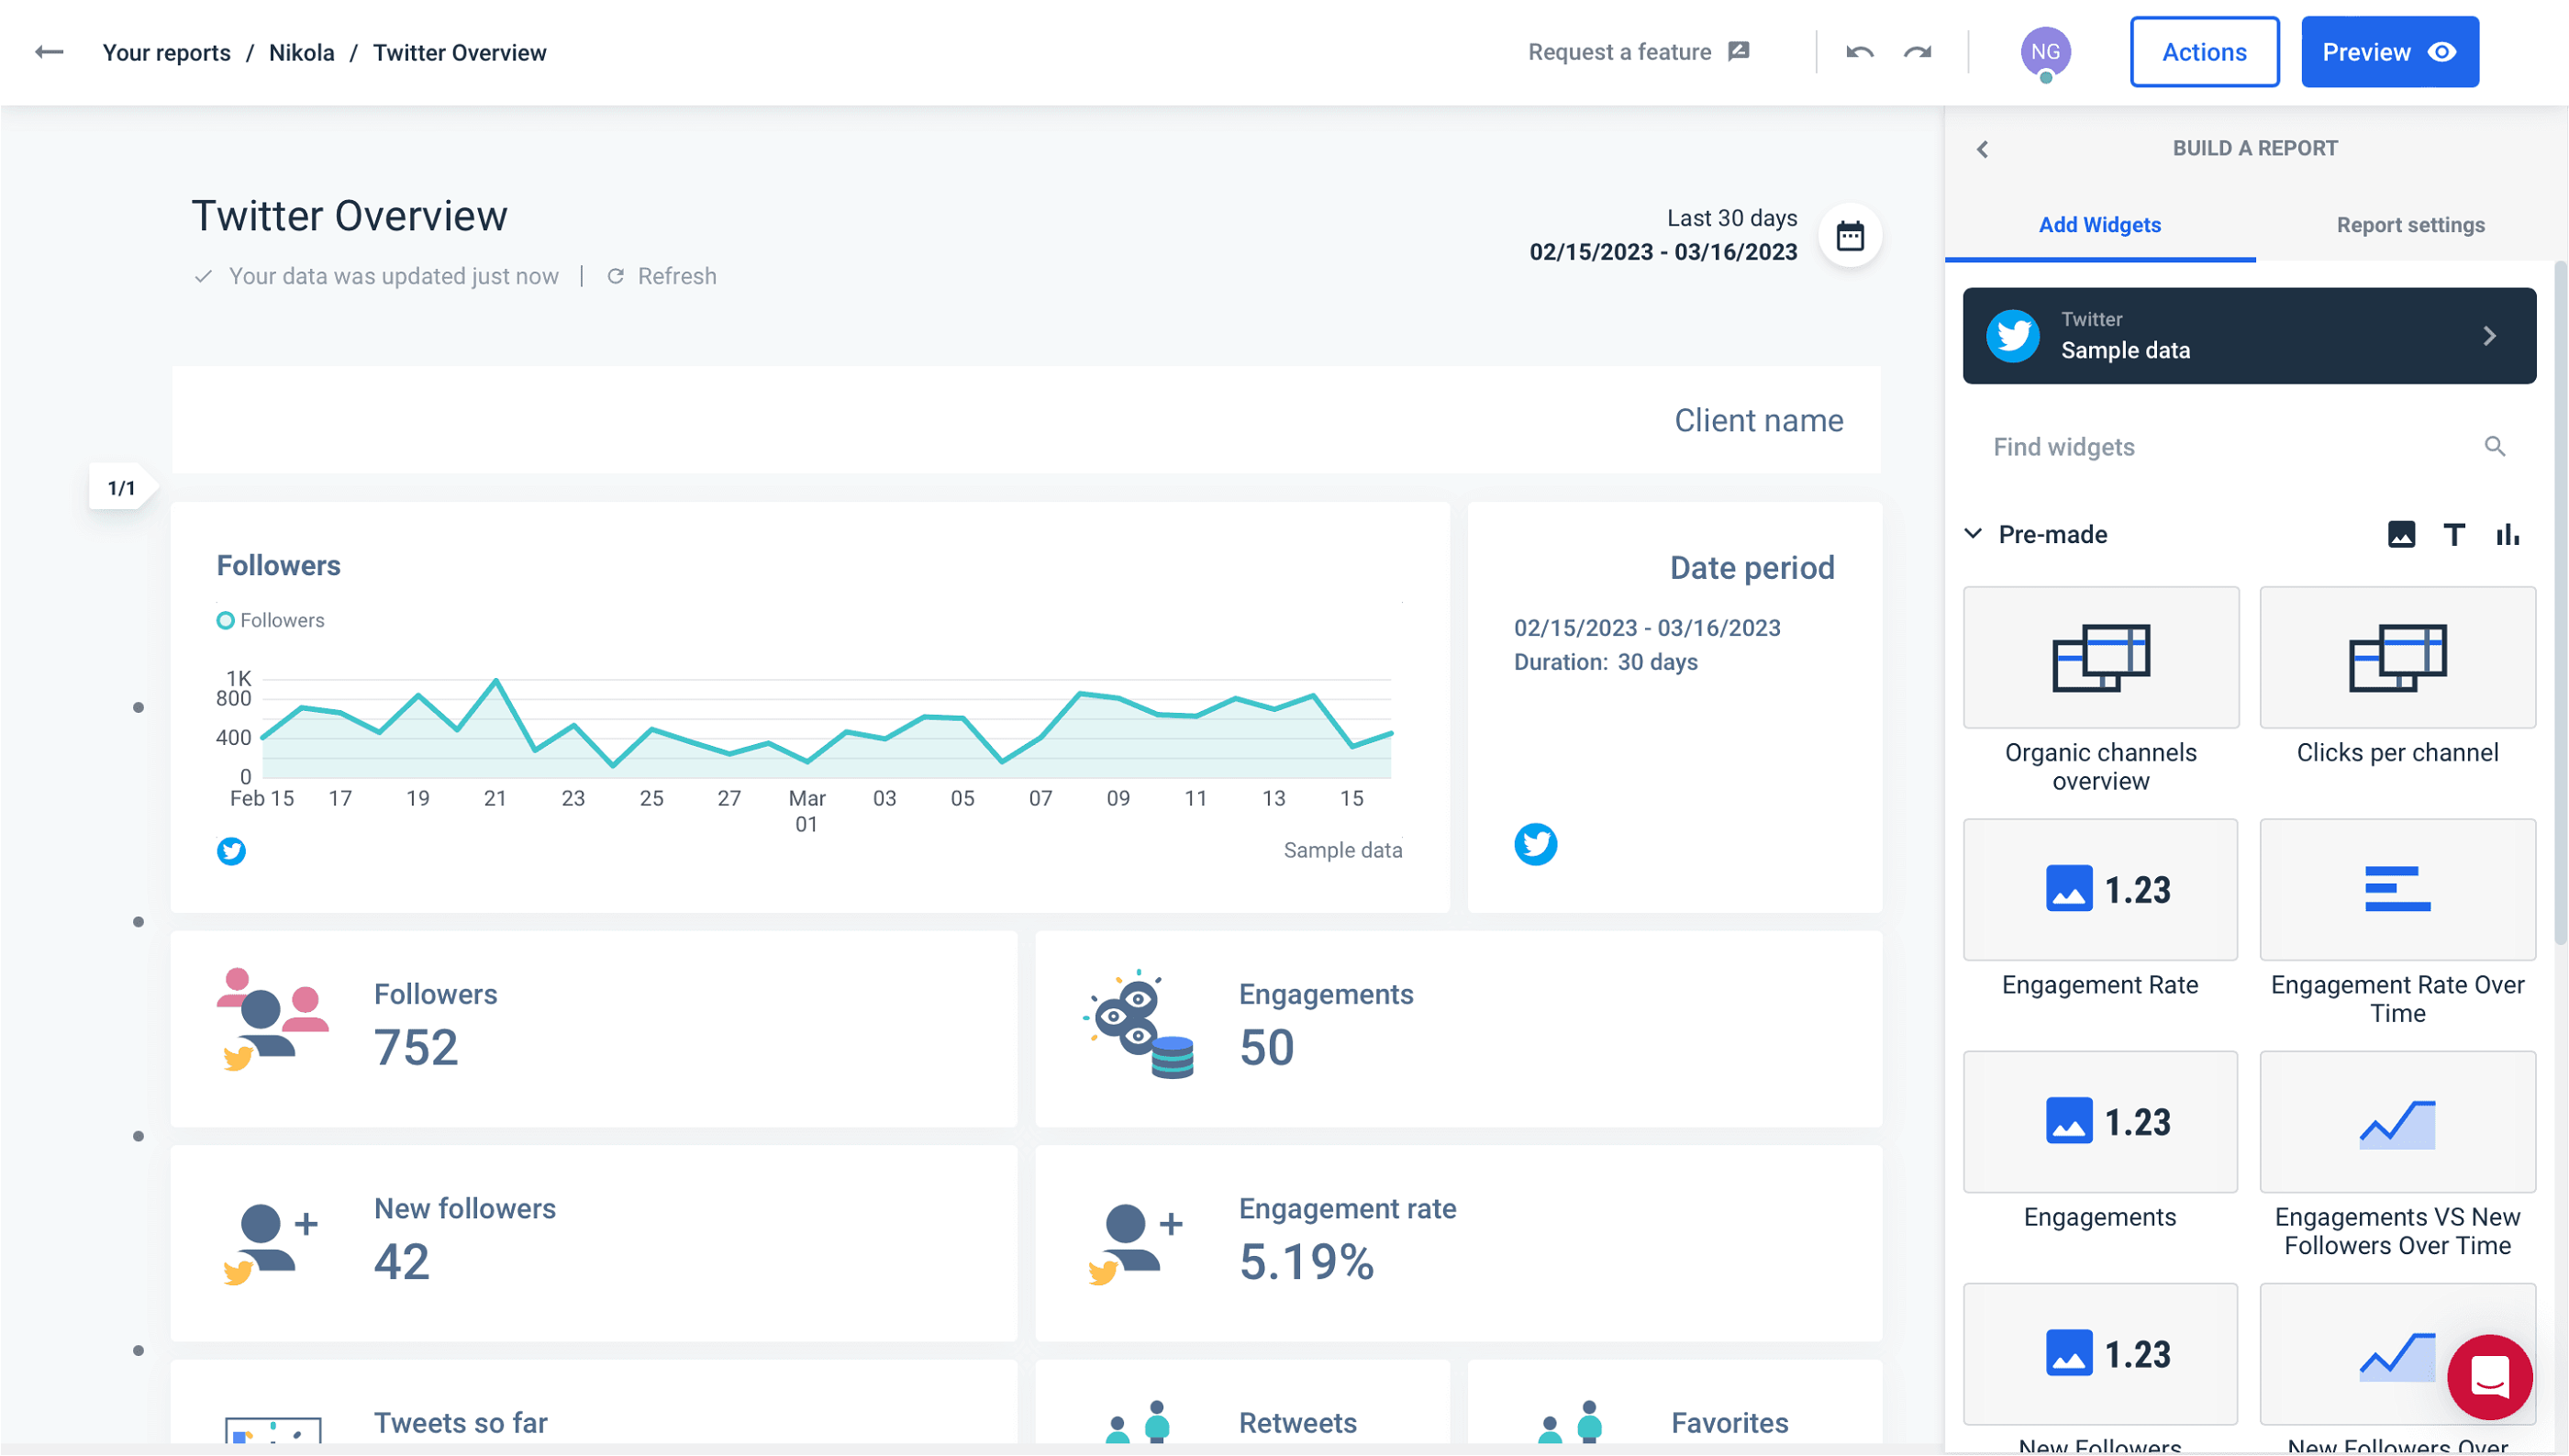
4. Use a report template
Whatagraph’s Twitter template is created to meet your client’s needs with flying colors. It provides an in-depth view of your Twitter account performance and analytics.
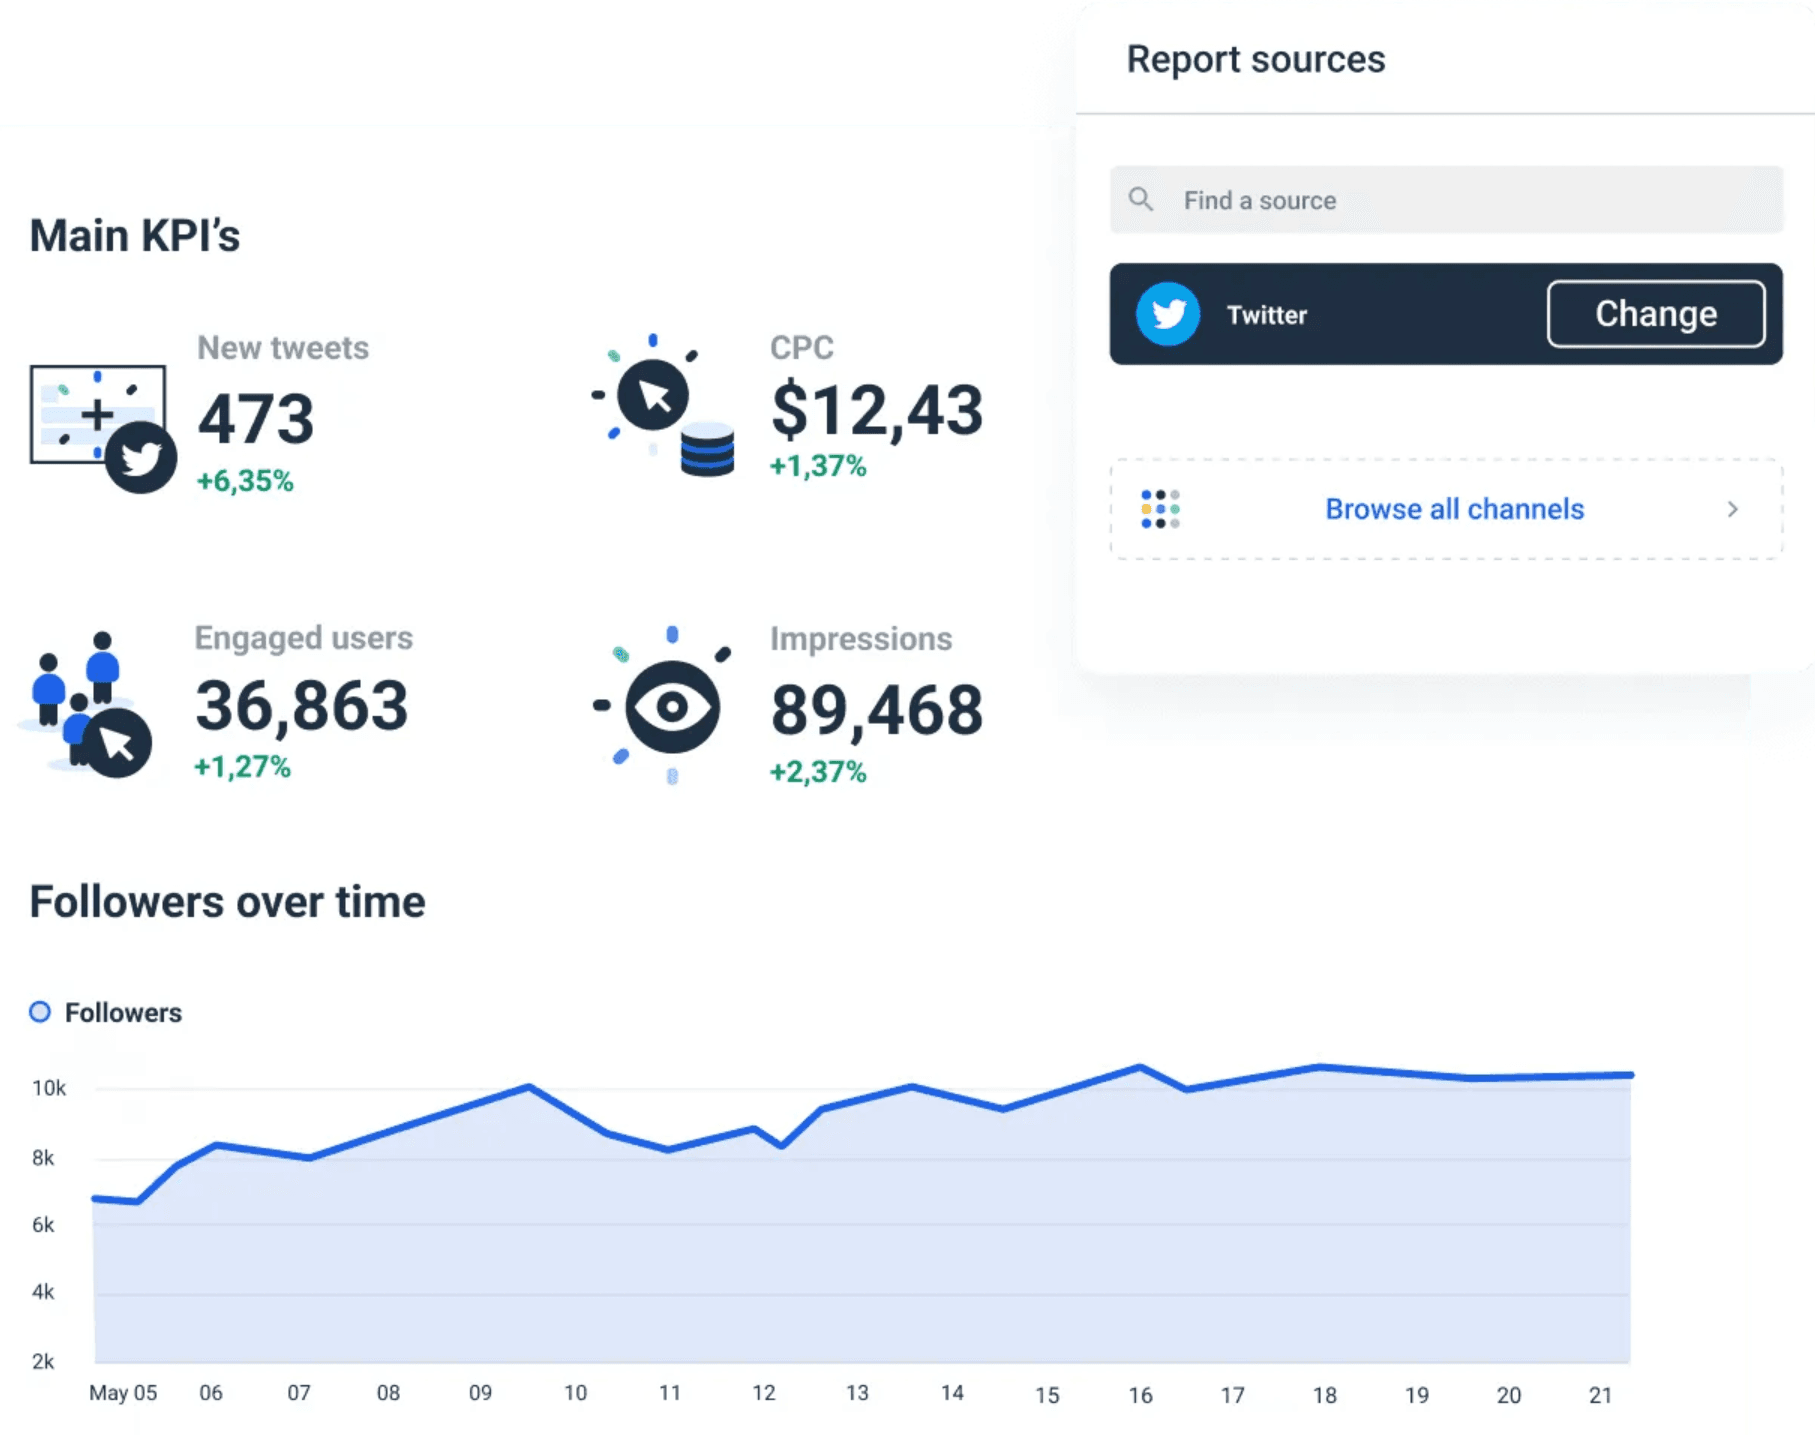
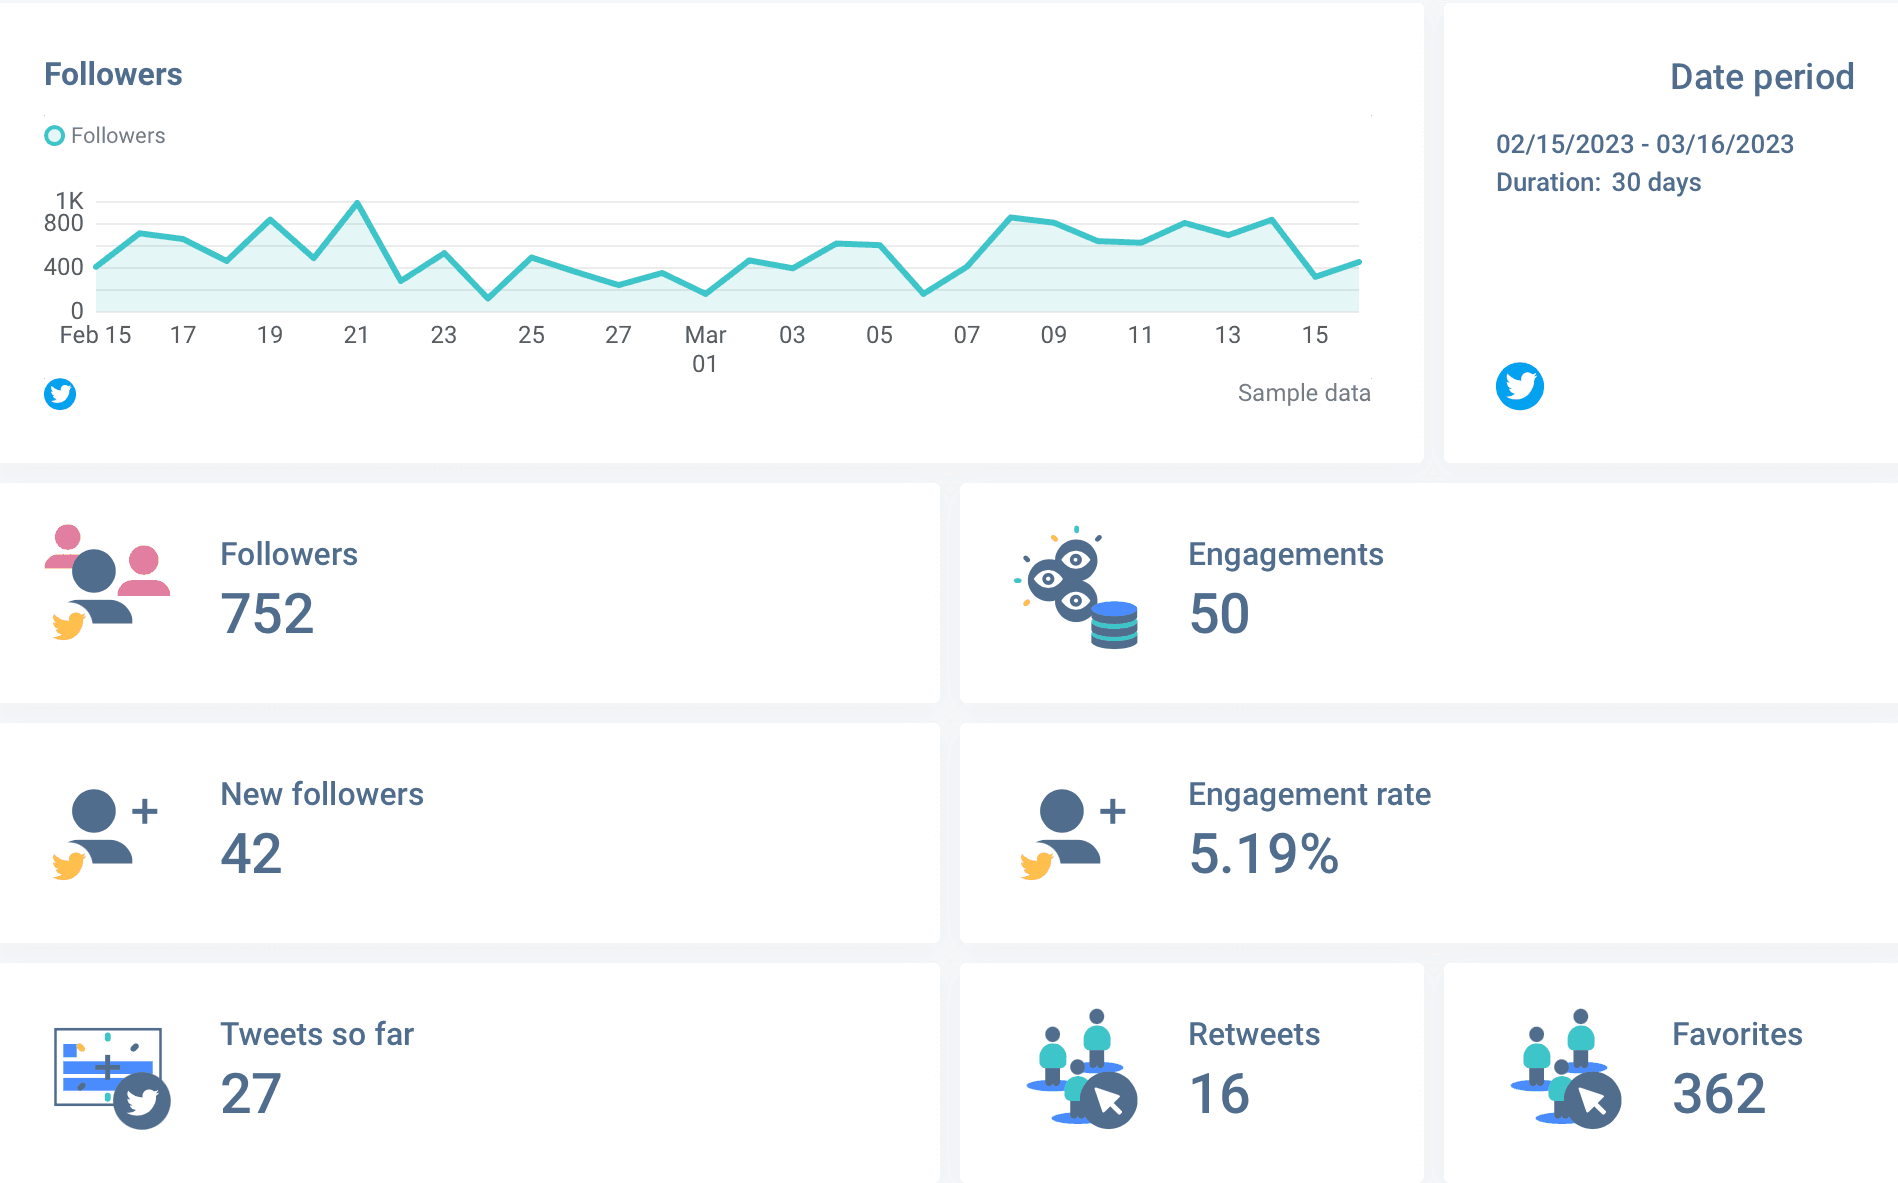
With this template at your fingertips, you can visualize Twitter engagement metrics that impact your campaign performance, like the number of followers, tweet activity, demographics, follower growth, and the number of engagements.
The default Whatagraph Twitter report template has four sections:
- Followers graph
- Campaign data range
- Widgets for Followers, Engagements, New followers, Engagement rate, Tweets so far, Retweets, and Favorites.
- Tweet performance table
Keep in mind that you can easily edit this report layout, which we’ll explain in the next section.
5. Edit the report to your client’s liking
When you create a basic Twitter report, you can choose to change it by introducing additional widgets for different dimensions and metrics.
Feel free to customize your Twitter report template by adding graphs and charts, images, text boxes, calendars, and more.
Edit the name of your report, add your or your client’s logo, or change the color scheme of the design elements and make the report look more like your or your client’s branded paper.
But Whatagraph allows you to go one step ahead and impress the clients by making the report look like you created it from scratch.
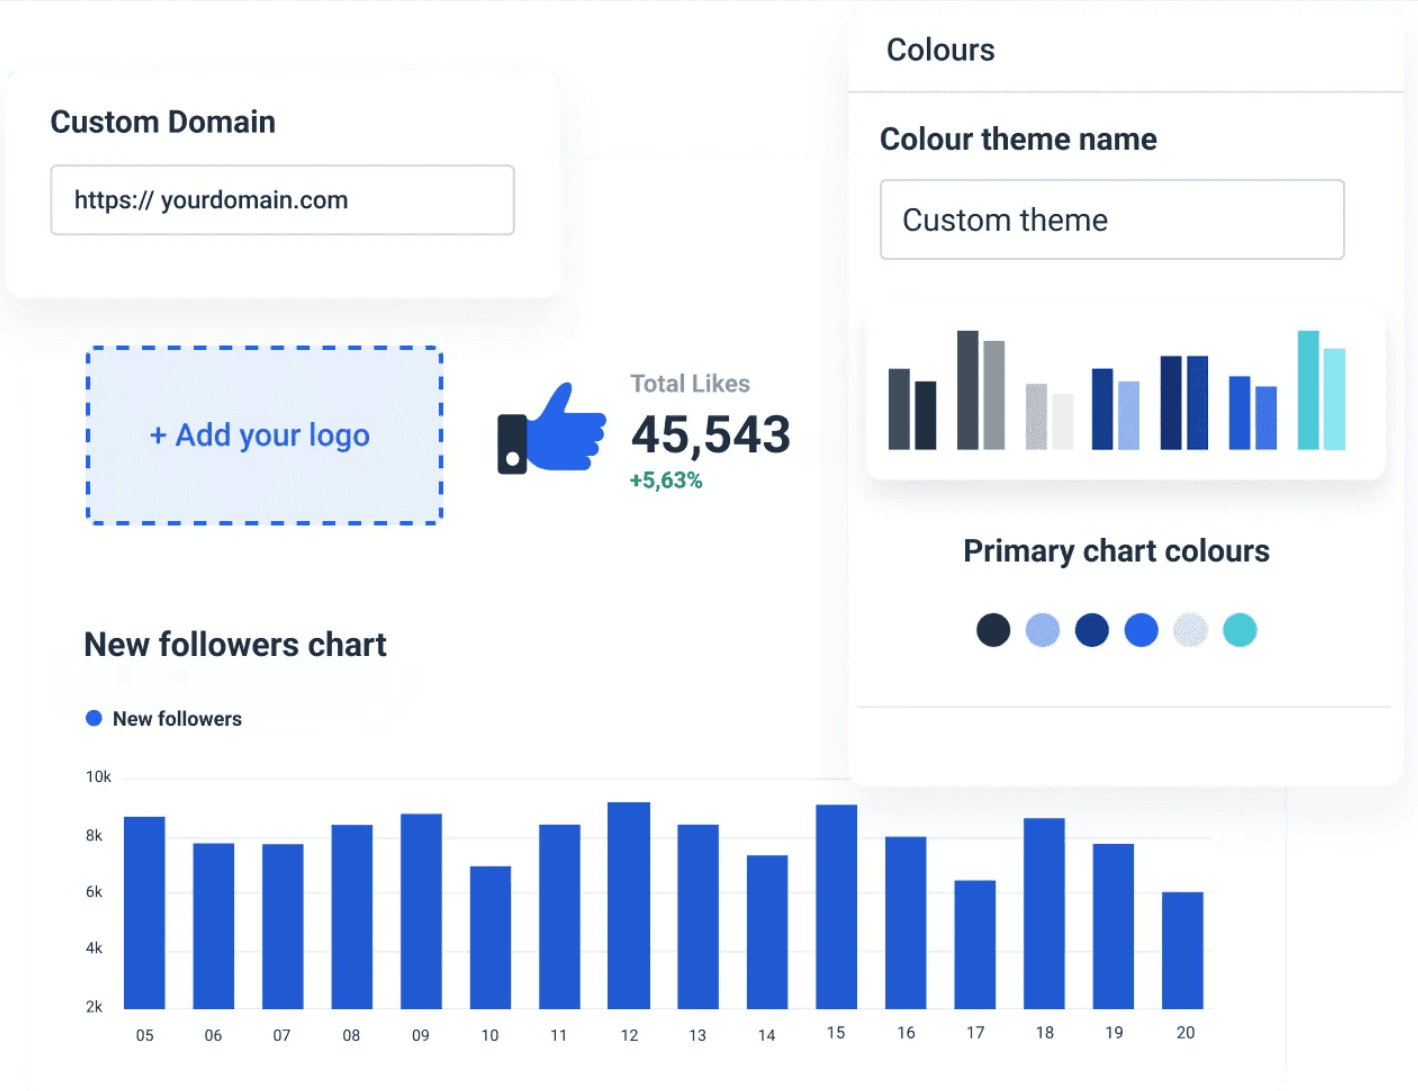
Use the white-labeling option to remove the Whatagraph logo from your reports for good.
6. Automate the report delivery
Once your Twitter report looks just like you imagined it, there’s little else to do but automate the delivery. This allows you to set up your report and schedule it for delivery in mere minutes.
A client wants a Twitter report delivered every week? Others ask for a biweekly or monthly report? No problem.
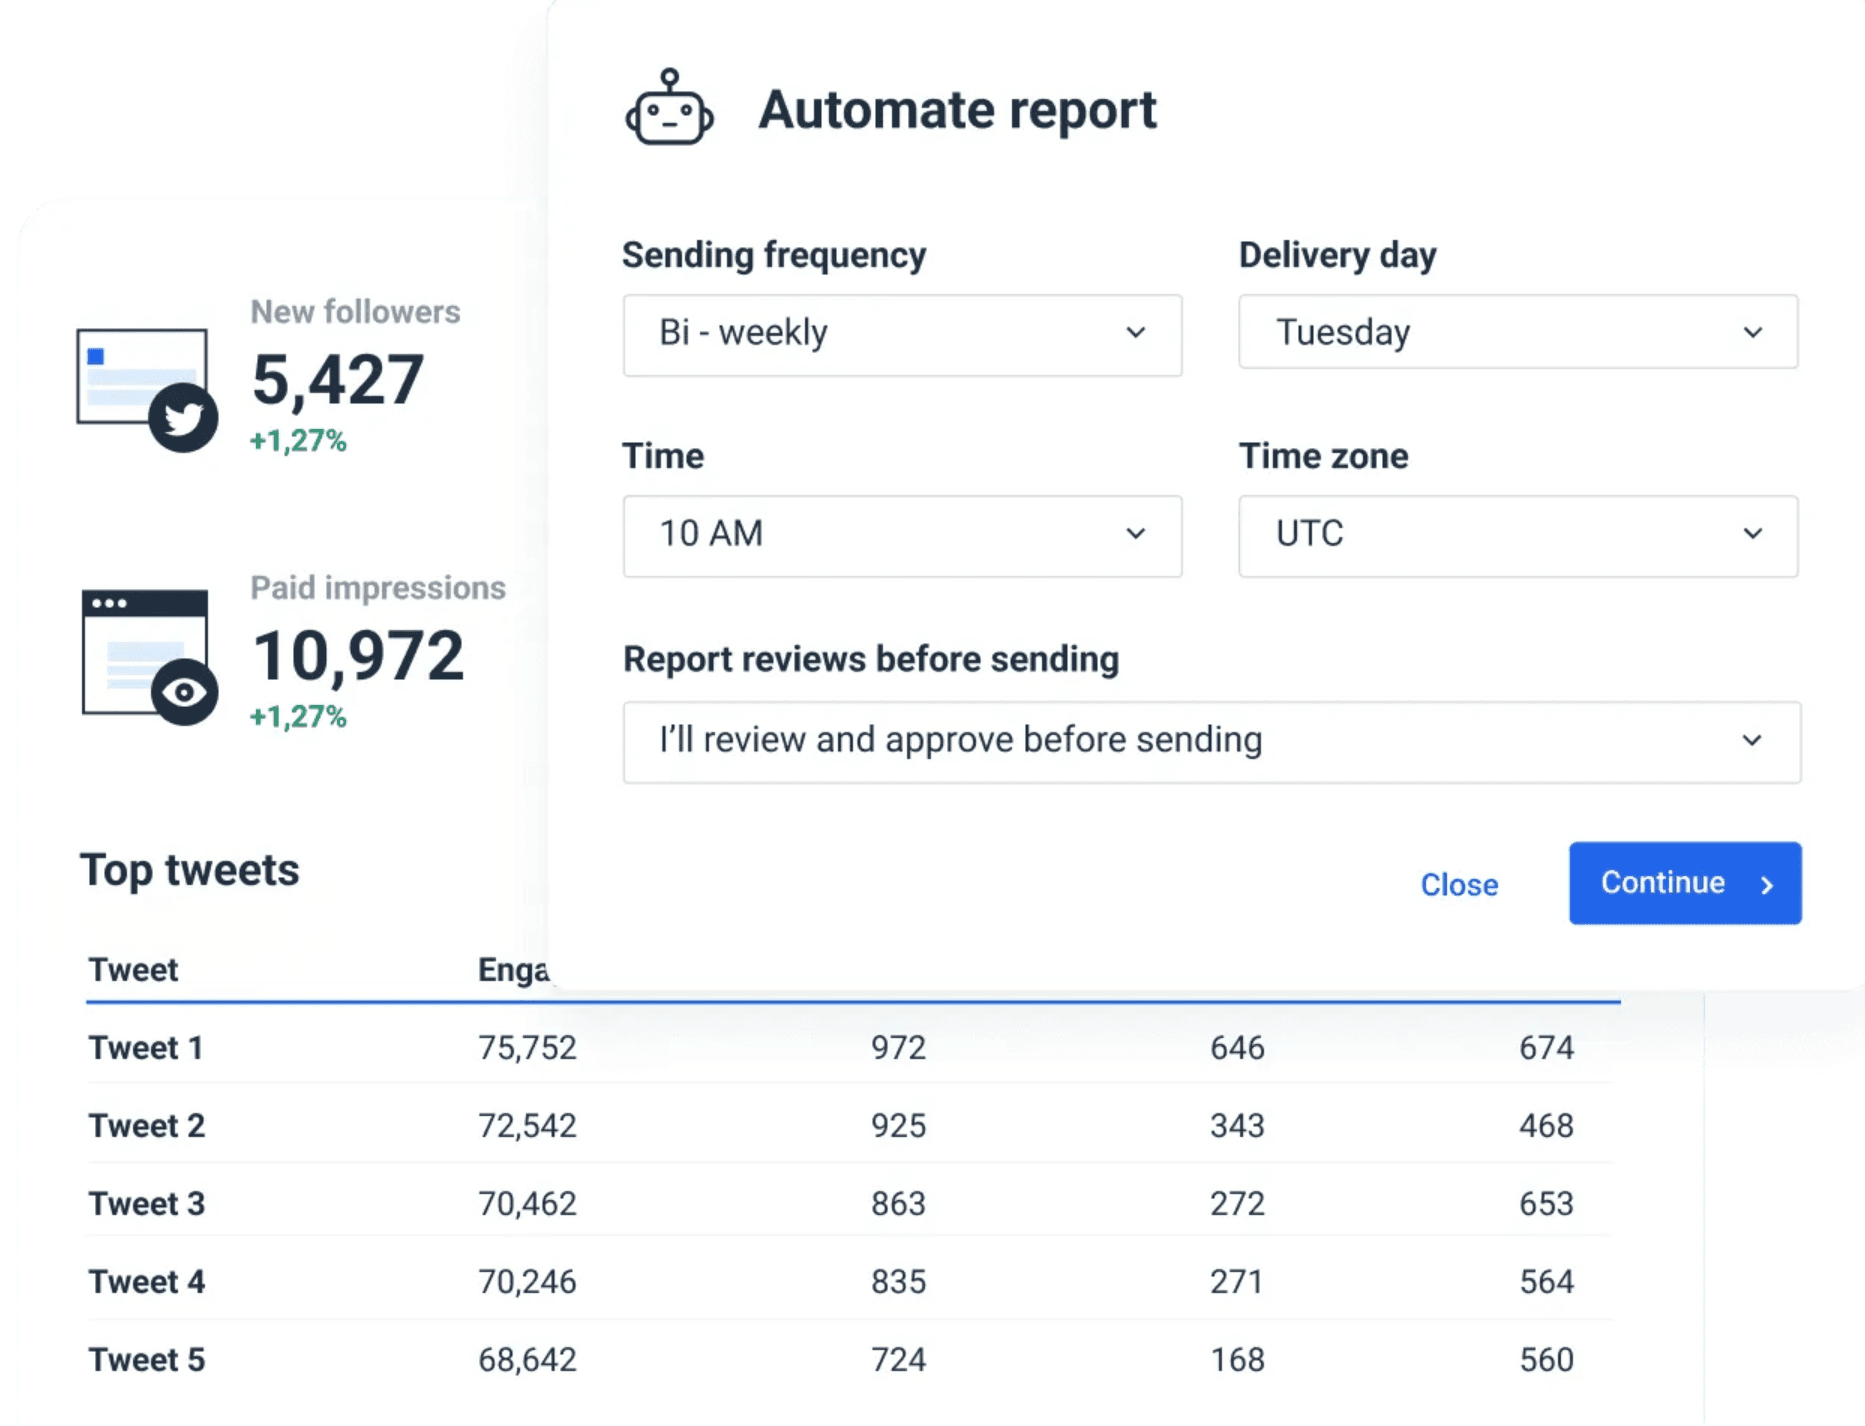
With Whatagraph, setting those schedules becomes the least of your concerns – and in a good way.
Set the sending interval for each account, the period you want to report on, and the number of recipients, and every Twitter report will be delivered on autopilot.
How will you create your next Twitter report?
Twitter analytics collects a large amount of data on your client’s Twitter followers’ behavior. In any case, the torrent of Twitter activity metrics is overwhelming to such an extent that only a thoroughbred reporting tool can convert those stats into actionable insights.
Now you can use Whatagraph to create thrilling Twitter analytics reports in just minutes and set up automated delivery so that every client receives their report on time and without your intervention.
But Whatagraph is not one of those tools where the lowest price plan gets you a bit more than trial options.
Even with the most basic package, you get to create an unlimited number of Twitter reports.
Apart from Twitter reports, Whatagraph allows you to create all sorts of social media marketing, SEO, paid media, CRM, and eCommerce reports using data from over 40 platforms.
Sign up for a free trial to test what Whatagraph can do today, and you’ll be amazed at how easy it is to automate your reporting game.
Published on Mar 21 2023
WRITTEN BY
Nikola GemesNikola is a content marketer at Whatagraph with extensive writing experience in SaaS and tech niches. With a background in content management apps and composable architectures, it's his job to educate readers about the latest developments in the world of marketing data, data warehousing, headless architectures, and federated content platforms.