Twitter Integration
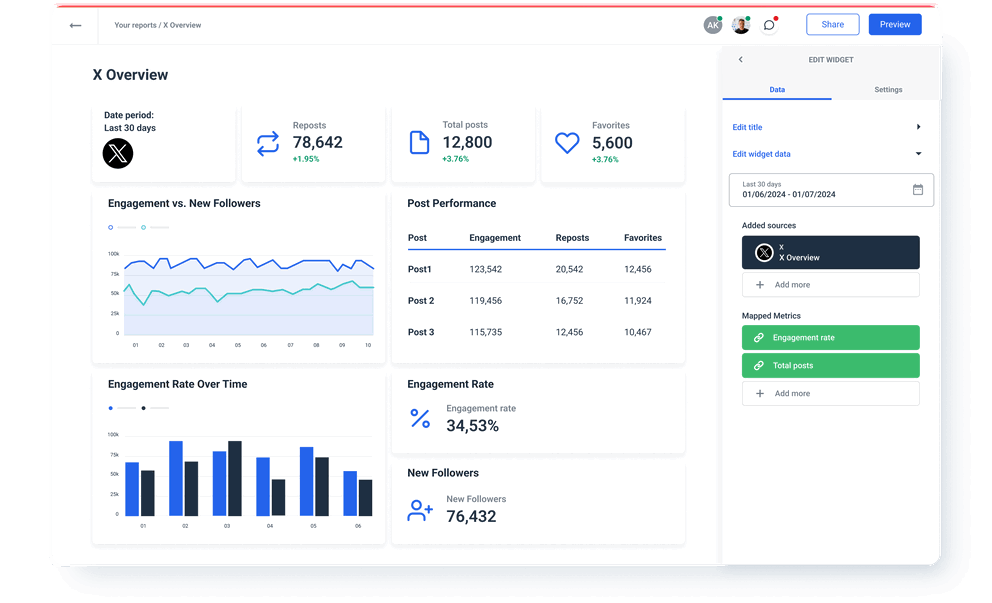
Connect your Twitter data and use Whatagraph’s advanced visualization to analyze and share the performance of your Twitter campaigns. A fully managed Twitter integration pulls data directly from your Twitter account to our stunning custom reports. In a few clicks, discover how Twitter users engage with your tweets. Blend and organize Twitter metrics before visualization to present only the most impactful endpoints. Share insights from your marketing data automatically as scheduled emails or live links.
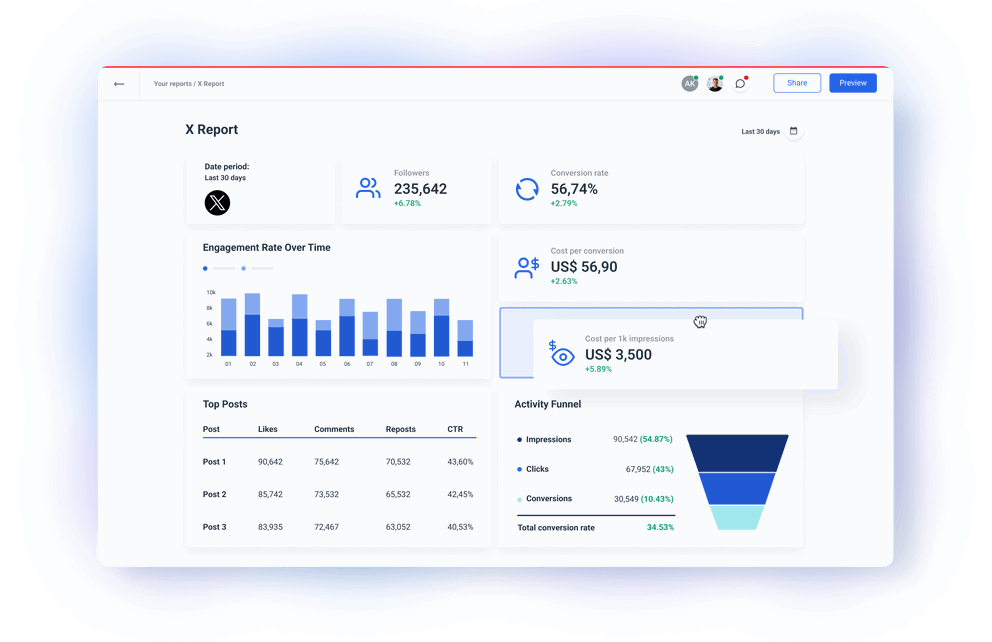
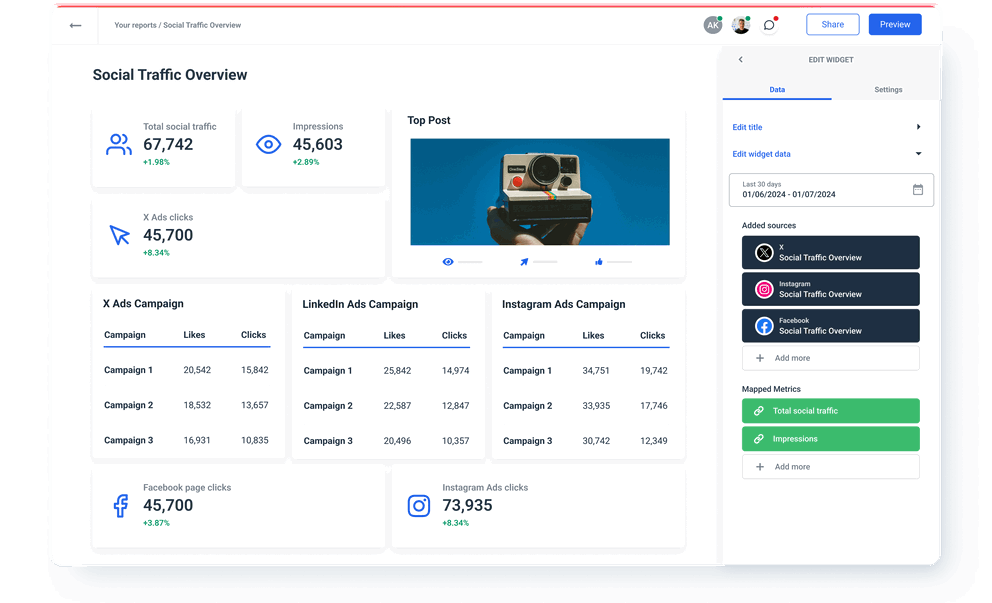
Manage all your Twitter metrics via a direct connector to Twitter API

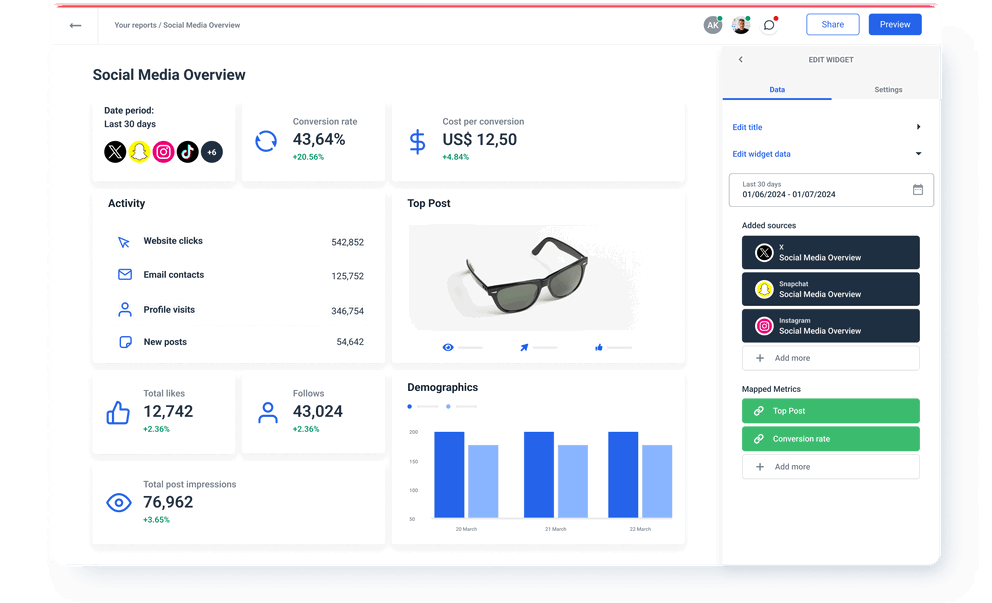
Blend your Twitter insights with data from other social media
Check out related integrations:


Explore marketing automation and custom report features


Pick a template and start reporting


FAQs
All your questions answered. And if you can’t find it here, chat to our friendly team.
What other marketing data sources can I connect with Whatagraph?
Apart from your Twitter data, you can connect a range of popular marketing platforms like Google Analytics 4, social media like Facebook Page and LinkedIn, PPC like Google Ads, Microsoft Advertising, LinkedIn Ads, CRMs like Salesforce and HubSpot, email marketing and e-commerce platforms like Shopify and BigCommerce. If you can’t find the integration for your data source, you can connect it via a Custom API or by exporting it to Google Sheets or BigQuery data warehouse and adding it as a source.
Is Twitter API integration available in all pricing plans?
Yes, Twitter API integration is available in all pricing plans, along with 45+ more integrations.
Do I need Looker Studio to visualize Twitter data?
No, you don’t need Looker Studio (Google Data Studio) or any other tool to visualize your Twitter data. Whatagraph is an all-in-one marketing data platform to connect, organize, visualize, and share all your data. This makes Whatagraph a better choice than other data platforms that provide only the functionality to connect Twitter sources, so users need to use a separate tool to visualize their data insights.
How to connect Twitter data to Whatagraph?
Whatagraph has a pre-built Twitter connector, so you don’t have to purchase and configure third-party data connectors. However, due to changes in Twitter API’s functionality, you’ll need to set up a Twitter developer account and generate the API key.
To set up a Twitter developer account:
1. Visit Twitter developer platform
2. Log in using your Twitter account
3. Once logged in, click on the Developer portal located in the top right corner of your screen.
4. Select the Basic subscription option and click on the Subscribe to Basic button.
5. You will be prompted to describe all of your use cases for Twitter's data and API. Provide the following explanation: "Twitter API access will be utilized to retrieve marketing and analytics data from connected Twitter profiles using the Whatagraph platform to generate marketing reports. This automation aims to streamline manual processes. The acquired data will be used for marketing purposes and to analyze tweet performance."
6. Ensure that you agree to the terms and conditions by checking the appropriate boxes.
7. Proceed to add your payment information. Click on the "Add card & Subscribe" button.
To generate the Consumer and Secret keys to Whatagraph
1. Go to your Twitter developer dashboard.
2. Now go to your project and project app and click on the "Key" option, which will display your keys and tokens.
3. In the "Consumer keys" section, click on "Regenerate" to obtain new keys. Copy the keys for later use.
Treat the API key and secret as login credentials. Store them securely for future use. If lost, you'll have to regenerate them and re-verify the connection with new keys.
4. You will also need to add the callback URL for the integration to work. While still in the project app, go to the Settings tab, scroll down to the User authentication settings and click Set up (or Edit).
5. Scroll down to the App info section to add the Callback URL / Redirect URL as follows:
https://live.whatagraph.com/add-integration/twitter
Then make sure that you have selected Web App, Automated App or Bot in the Type of App section.
6. Copy the keys you have saved and add them to your Twitter integration in Whatagraph's source manager.
7. Your account should be verified successfully.
You have successfully created a connection to your Twitter API. Create a custom report or dashboard and add your Twitter account as a source.
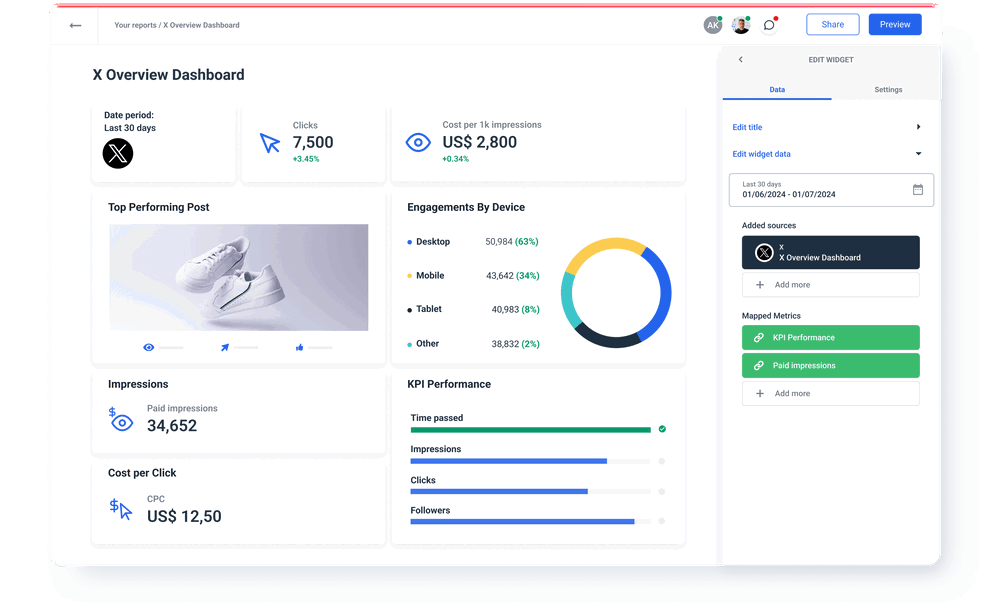
When you connect Twitter data to Whatagraph, you can organize datasets to get more granular insights by device, campaign ID, date, etc. You can visualize data in various widgets and share the insights via automated email attachments or live links for near real-time access.
Effortlessly create reports and dashboards


What others think about Whatagraph
I made a switch from GDS and Sheets for reporting to Whatagraph, and I am saving literal hours each week on performance report creation. Our small firm actually managed to onboard 2 new clients as a result of all the time we saved on managing data and reporting. The customer service is also really helpful and easy to reach.

Capterra verified review by
Mindaugas S., Marketing Consultant
Having active customer support to help fix any issues was a big contributor, but we also really liked the ability to save templates and connect sources to multiple charts/widgets at once without having to edit them individually. And having the grid layout is much easier to stay consistent with than the free form setup that Data Studio has.

Capterra verified review by
Nico T., Media Planner
The system has standard templates that are easy and fast to use. Also you can build your own report with lightning speed. It is very easy to use, has a lot of integration, and let get started very fast.

Capterra verified review by
Rasmus Bernt K., External Senior Management Consultant
We love Whatagraph - we would definitely recommend and our account manager is great! I love how easy this tool is to use, everyone on the team finds it much more user-friendly than other dashboards. Integration was easy, we sent some example reports to the team who duplicated these for us. We literally had to log in and send it to our clients!

Capterra verified review by
Stephanie S., Digital Director
We are showing our clients the work that we're doing for them and this is incredibly important for our clients ROI. They want to see results and having a tool like Whatagraph that can show data from virtually every source we use is hugely important.

Capterra verified review by
John S., SEO Strategist
The tool is easy to use; you do not need to have development resources. Even my junior project managers are capable of making campaign reports in minutes. There are a lot of pre-made templates you can use as well as many pre-made widgets.

Capterra verified review by
Erman E., Marketing Specialist
Really easy to connect data sources within the tool. The library of report templates has been helpful. The customer support team has been responsive to all of our needs. Our team enjoys the simplicity of setting up the reports and how the data is presented.

Capterra verified review by
Brent N., Director of Operations
Easy to create really beautiful graphs and reports which can help other team members to understand the most important takeaways. I especially like the automated report function, so I don't have to check on the same thing repeatedly.

Capterra verified review by
Orsolya S., Online Marketing Manager