What are data analysis tools?
Data analysis tools are applications and programs that capture and analyze data about business intelligence, its customers, and competitors in order to improve processes and discover insights for transformation tools, and data-driven decision making.

May 03 2021 ● 8 min read

Data Analytics Tools
Data analysis is always done with the purpose of answering specific questions. Their techniques are similar to business analytics and business intelligence.
Here are some of the most popular and big Data Analytics Tools that we suggest: Zoho Analytics, Sprinkle, Whatagraph, HubSpot, Xplenty, Zoho Analytics, and Google Fusion Tables.
In order to make the best decision on which software we need to choose as an analyst, we have selected a list of the top data analysis tools that have various focus and features, organized in software categories and represented with an example of each.
Data Analysis Toolpak
Data analysis tools assist businesses in gaining information from consumer data and uncovering trends and patterns in order to make better business decisions.
There are several online data analysis resources available to you, whether you want to conduct simple or advanced data analysis.
Thanks to no-code machine learning software, advanced data analysis is now easier than ever, allowing businesses to reap the benefits from huge amounts of unstructured data and build no-code dashboards.
Here are the main groups of tools for data analysis and their benefits.
Tools For Bussines Intelligence
Power BI tools are one of the most regularly used methods for performing data analysis. These tools, which are specialized in business analytics, would be useful for any data analyst who wants to analyze, track, and report on important findings.
Self-service, predictive analytics, and advanced SQL modes make these technologies easily adaptable to any level of experience, without requiring extensive IT involvement. Our data analytics tools article will be incomplete without including business intelligence, and datapine is one example that meets the majority of the needs of both novice and experienced users.
Tools For Statistical Analysis
Multiple programming languages exist to make (data) scientists' work simpler and more efficient. They refer to computation techniques that also include a range of statistical techniques to manipulate, explore, and produce insights.
Science has its own set of rules and situations that require special attention when it comes to statistical data analysis and modelling, thanks to the expansion of different languages that are now available on the market. In this section, we will look at R programming, which is one of the most common tools for data analysts. Although there are other languages that specialize in (scientific) data analysis, R is the most widely used.
Languages For General-Purpose Programming
A number of data problems are solved using programming languages. We've already covered statistical programming. Now, we'll look at general ones that use letters, numbers, and symbols to construct programs and include formal syntax.
As you must write software that will eventually solve a problem, they are also known as text-based programs. C#, Java, PHP, Ruby, Julia, and Python are a few examples, but there are several more on the market. In this section, we will present Python as one of the best resources for data analysts who also have coding skills.
Tools For Predictive Analysis On Their Own
Predictive analytics is one of the advanced techniques used by analysts to predict future events by combining data mining, machine learning, predictive modelling, and artificial intelligence, and it deserves a special position in our list of data analysis tools as its popularity has increased in recent years with the advent of smart solutions that allowed analysts to simplify their predictive analysis.
You should bear in mind that several of the BI tools covered in this list have built-in predictive analytics solutions that are simple to use.
In this section, we will concentrate on standalone, specialized predictive analytics that businesses use for a variety of purposes, from detecting fraud with pattern detection to optimizing marketing strategies by analyzing customer behavior and transactions.
ETL Tools
ETL is a process used by businesses of all sizes all over the world, and as a company expands, chances are you will need to extract, load, and turn data into another database (data warehouse) in order to analyze it and create queries and access control.
There are three main types of ETL tools: batch ETL, real-time ETL, and cloud-based ETL, each with its own set of requirements and features that cater to various business needs.
Industry-specific Analytics Tools
Although many of the methods on this list are used in multiple industries and are used on a regular basis in analysts' workflow, there are others that are explicitly designed for a single industry and cannot be used in another.
As a result, we chose to include one of these solutions on our list, despite the fact that there are several others, industry-specific data analysis programs and software.
Unified Data Analytics Engines
If you work for an organization that generates large datasets and requires a big data management solution, centralized data analytics engines could be the best solution for your analytical processes. To make quality decisions in a big data setting, analysts need resources that enable them to fully monitor their company's robust data environment. That is where machine learning and AI come into play.
Spreadsheet Applications
Spreadsheets are one of the oldest ways of data processing. There is a small chance that you haven't produced at least one spreadsheet to analyze your data if you work in any industry, company, or organization.
Often used by people that don’t have high technical abilities to code themselves, spreadsheets can be used for fairly easy analysis that doesn’t require considerable training, complex and large volumes of data and databases to manage. To look at spreadsheets in more detail, we have chosen Excel as one of the most popular in business.
Data Visualisation Tools and Platforms
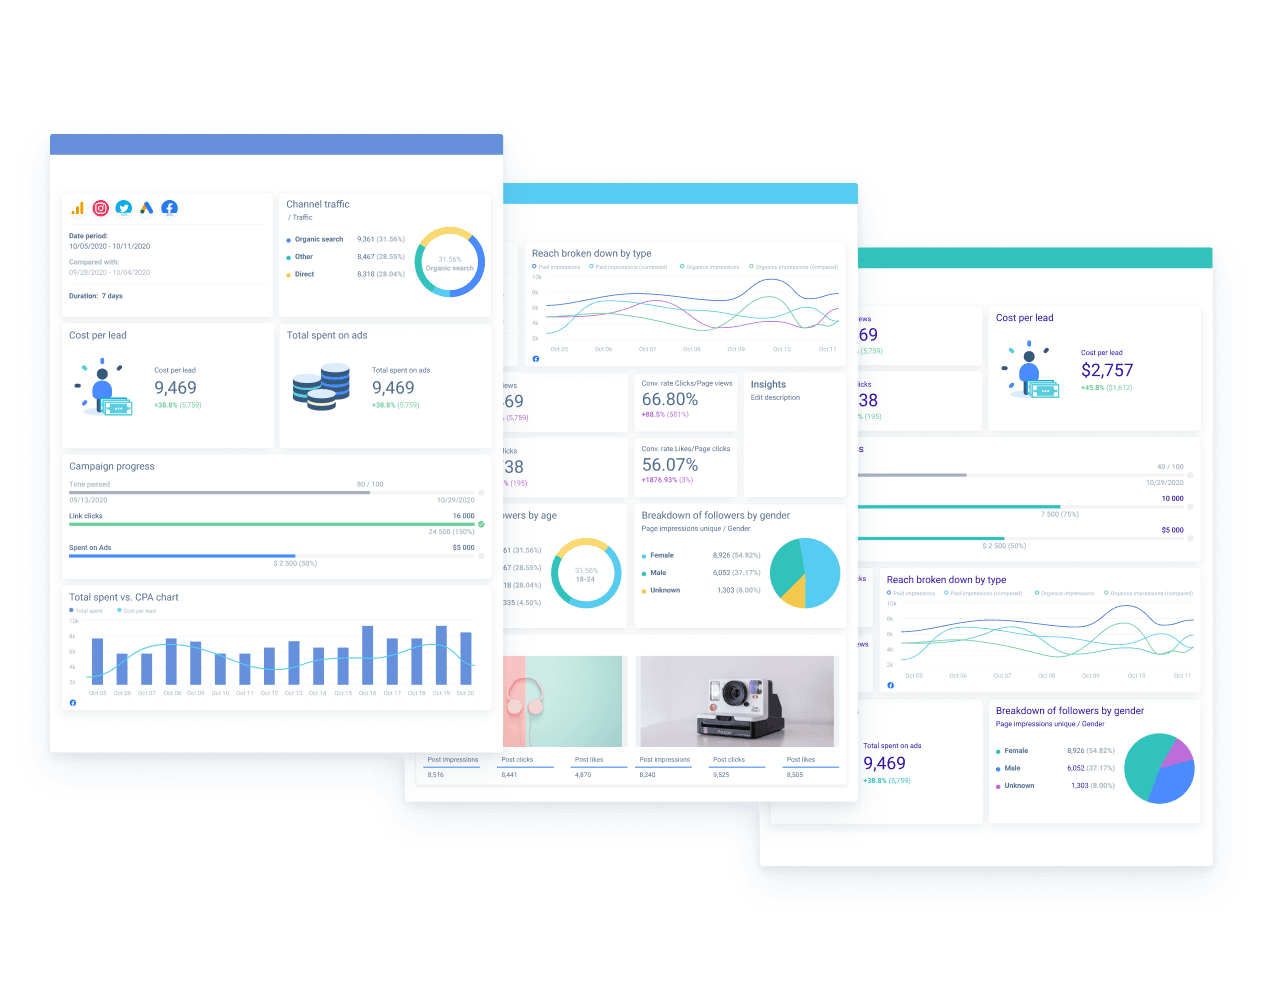
Data visualization has evolved into an essential method in research processes. If you're an analyst, you've almost certainly had to create a visual representation of your research or use some kind of data visualization. It is important to note that there are distinctions between professional data visualization tools, which are often incorporated into the previously described BI tools, and free data visualization tools. Try Whatagraph which can be a perfect solution for your needs. 
FAQ
Is Excel A Data Analysis Tool?
Yes, it is. Excel uses powerful data analysis formulas as a method of an analyst. It deserves its own category because this important tool has been in the hands of analysts for a long time. Excel, although often regarded as a conventional method of study, is still commonly used around the world. The explanations are straightforward: there aren't many people who haven't used or come across it at least once in their careers.
It's a fairly versatile data analysis tool that allows you to build your analysis by simply modifying rows and columns. If this section is completed, you can export your data and send it to the appropriate recipients.
Therefore, Excel can also be used as a reporting tool. It does not have an automation function like the other tools on our list, so you must manually update the details. Excel has evolved from an interactive version of the accounting worksheet to one of the most widely used resources for data analysts, capable of creating pivot tables, manipulating smaller volumes of data, and repairing with the tabular method of analysis.
Is SQL a data analysis tool?
Yes, SQL is Programming Language that easily organizes structured data.
It is a standard language for communicating with databases that are particularly useful when dealing with structured data. This programming language, which is used to search, add, update, and delete data, among other things, makes it simple to organize structured data. It is widely accepted in the data science community and is one of the analyst techniques used in a variety of market cases and data scenarios.
The explanation is simple: since most data is stored in relational databases and you need to access and unlock its meaning, SQL is a vital component of business success, and analysts can gain a competitive edge by learning it.
There are many relational database management systems available, such as MySQL, PostgreSQL, MS SQL, and Oracle, and learning these data analysts' resources would be extremely beneficial to any serious analyst. We'll concentrate on MySQL Workbench because it's the most popular. Because SQL is used to store the majority of structured data, programs written in the language can easily unlock data for powerful results.
What are data analysis tools and techniques?
Answer these questions and you’ll be well on your way to finding the best data analytics tool to fit your needs:
1. Determine the form of data to be analyzed.
You must first determine what sort of data you want to analyze before selecting a data analysis tool. Is the information quantitative or qualitative? Quantitative data, which is mostly numerical data contained in spreadsheets and databases, is simple to turn into visual insights using data processing software in Excel and business intelligence tools like Tableau.
2. Determine who will be in charge of data management.
Do you have a group of data scientists and engineers who are familiar with SQL, R, and Python? These programming languages are often used in data processing tools and are easily understood by those with a coding background.
3. Determine the budget and timetable.
Finally, the cost and time required to include data analysis tools would have an impact on your decision. When comparing data analysis software, you should consider what you should pay for what you use or whether there is a recurring subscription fee. You must also remember the costs of infrastructure.
Published on May 03 2021

WRITTEN BY
Indrė Jankutė-CarmaciuIndrė is a copywriter at Whatagraph with extensive experience in search engine optimization and public relations. She holds a degree in International Relations, while her professional background includes different marketing and advertising niches. She manages to merge marketing strategy and public speaking while educating readers on how to automate their businesses.