


What is a Facebook Ads report generator?
A Facebook Ads report generator pulls your campaign data out of Ads Manager and turns it into clear, structured reports you can actually use, share with clients, and make decisions from.
Ads Manager gives you the raw numbers. But it wasn't built for client communication, cross-channel analysis, or agency scale. The tables are dense, the exports are clunky, and there's no way to blend Facebook Ads data with Google Ads, TikTok, or any other channel your clients are running.
That's where dedicated Facebook advertising reporting software comes in. A good tool does three things:
- Connects directly to your Facebook Ads account and pulls data automatically, no manual exports required
- Organizes and standardizes your data so metrics are consistent across campaigns, accounts, and channels
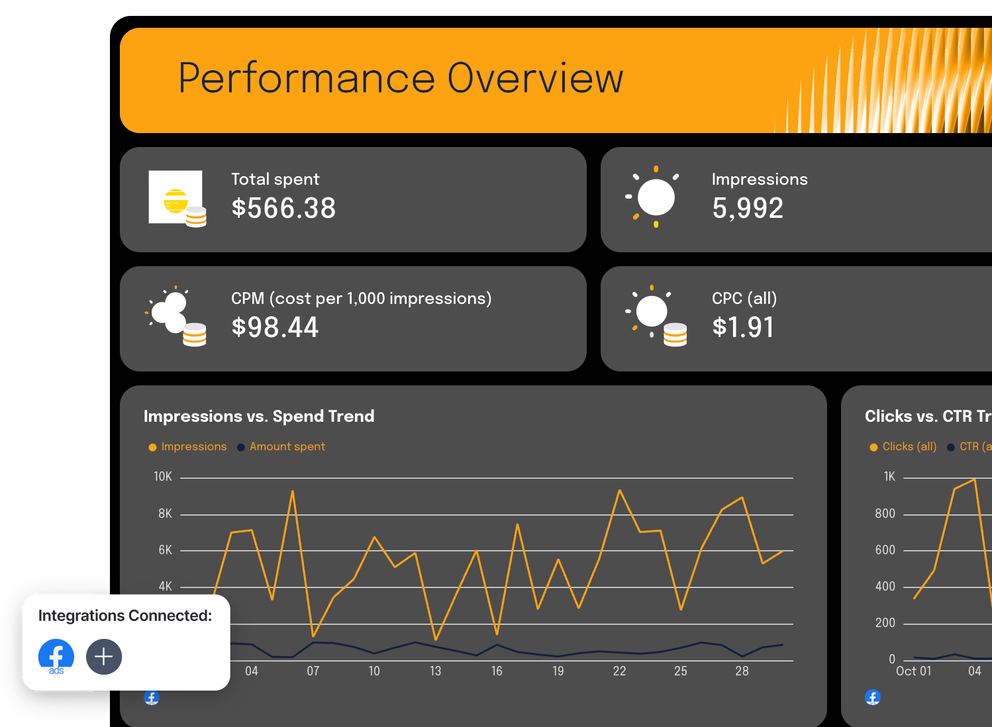
- Visualizes and shares that data in branded, client-ready reports that update on their own
How to choose the best Facebook Ads reporting tool?
Not all Facebook Ads reporting software are created equal.
To get the most out of your tool, we recommend looking for one that offers:
1. Ease of use
You shouldn’t be a developer to be able to build a Facebook Ads report.
Anyone on your team—from senior marketers to junior account managers—should be able to create reports that highlight key Facebook Ads metrics.
Prioritize Facebook ads tracking tools with:
- Pre-made Facebook Ads dashboards and report templates
- An interface that’s easy to learn for all users (not just the internal expert)
- Drag-and-drop widgets and charts for visualizing ad performance
- Data aggregation to combine Facebook Ads data with other sources
- Reliable customer support for troubleshooting issues
All this means your team can build Facebook Ads reports without spending hours on manual work or technical know-how.
2. Stable integrations
Stable integrations are a must, as they prevent having daily connectivity issues or inconsistent data.
To solve this, the best platforms offer fully managed Facebook Ads integrations.
No extra setup or connectors needed, which makes the integrations more stable, seamless, and reliable.
And not only should Facebook Ads integration exist, but other integrations should as well. After all, you probably want to add insights from multiple data sources into your reports.
Aside from Facebook Ads integration, look for integrations with:
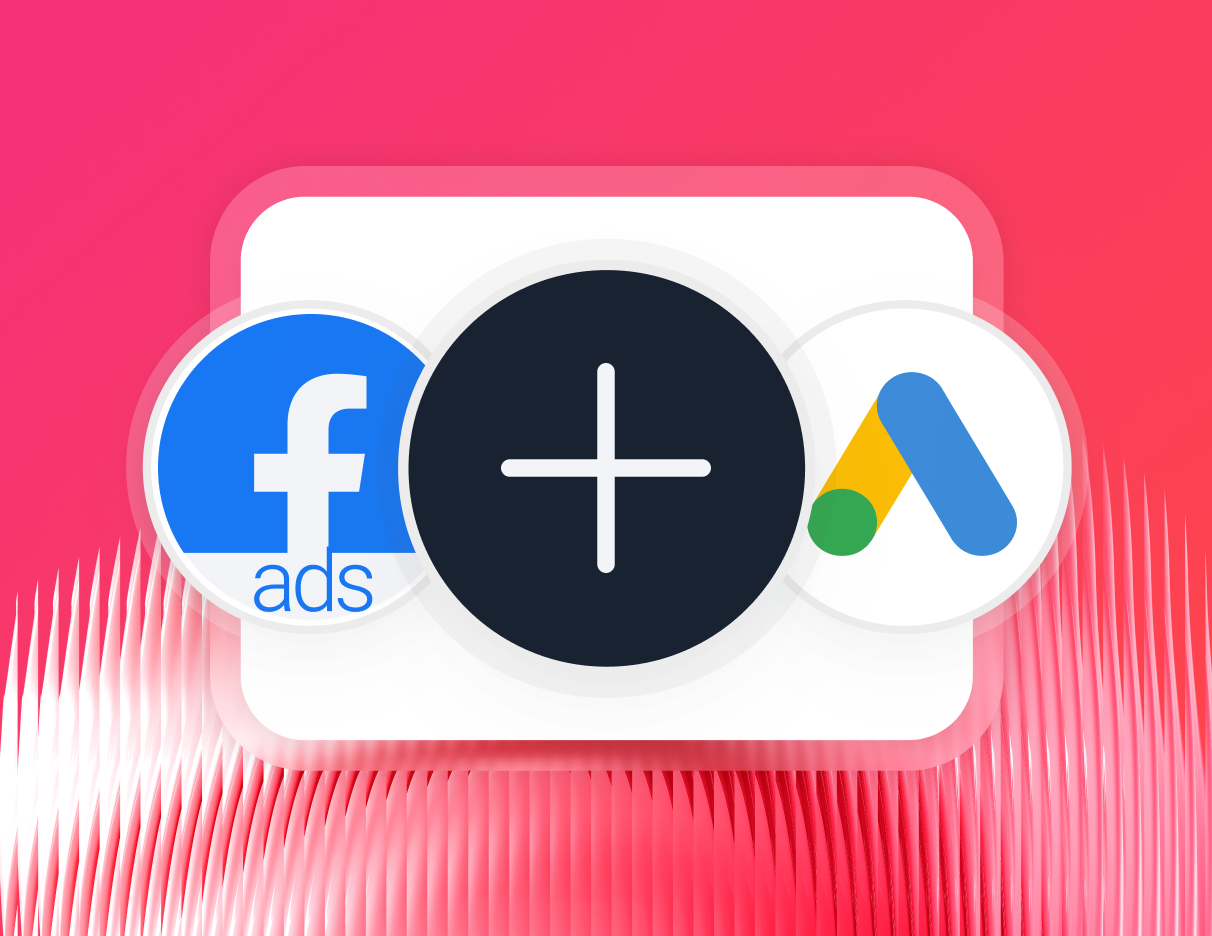
- Paid advertising platforms, like Facebook Ads, Google Ads, and TikTok Ads
- Social media platforms, like Facebook, Instagram, and LinkedIn
- SEO tools, like Ahrefs, Semrush, SE Ranking, and AccuRanker
- Analytics tools, like AppsFlyer, Google Analytics, and Matomo
- Email marketing tools, like ActiveCampaign, Klaviyo, and MailChimp
Whatagraph integrates with all of these, and much more. You can choose from 55+ fully-managed integrations and start pulling data in just a few clicks.
3. Highly customizable
On Whatagraph, you can pick and choose which metrics/KPIs you want to highlight using drag-and-drop widgets.
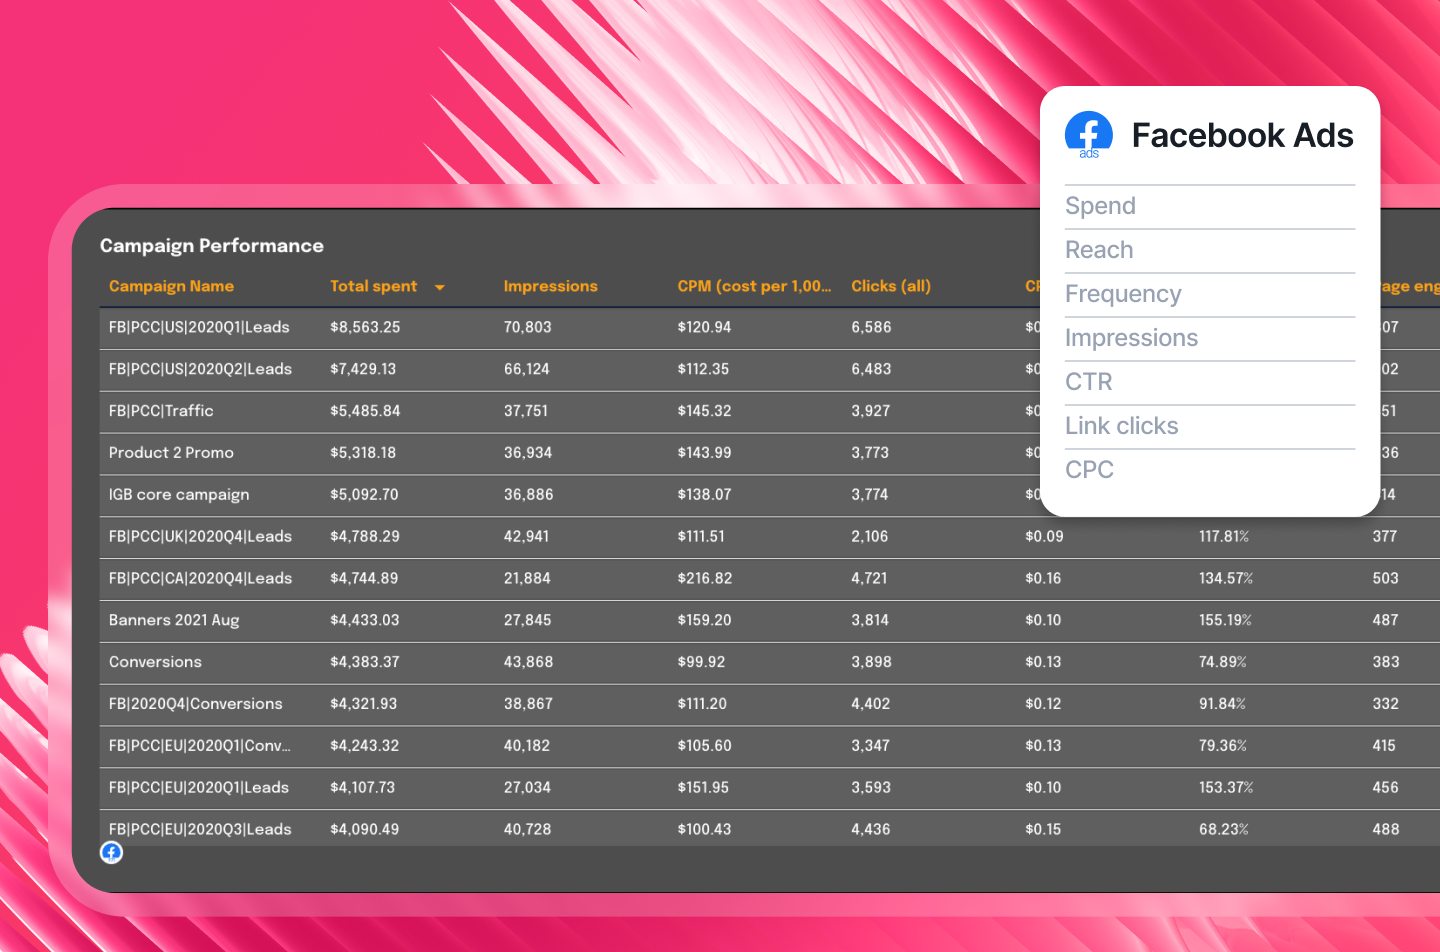
The metrics differ for each channel, but for Facebook Ads, you can highlight:
- Performance metrics, like reach, impressions, clicks, and CTR
- Conversion metrics, like unique purchases, CPC, and off-site conversions
- Engagement metrics, like unique likes, page engagement, and video plays
- Catalog segment metrics, like adds to cart with shared items value
- Converted product metrics, like content views and website purchases
These can be displayed individually, or you can combine multiple metrics into one widget and create custom metrics and dimensions.
For example, say you want to report on "Add to cart" across Facebook Ads and TikTok Ads. You can set up a custom metric for this, such as:
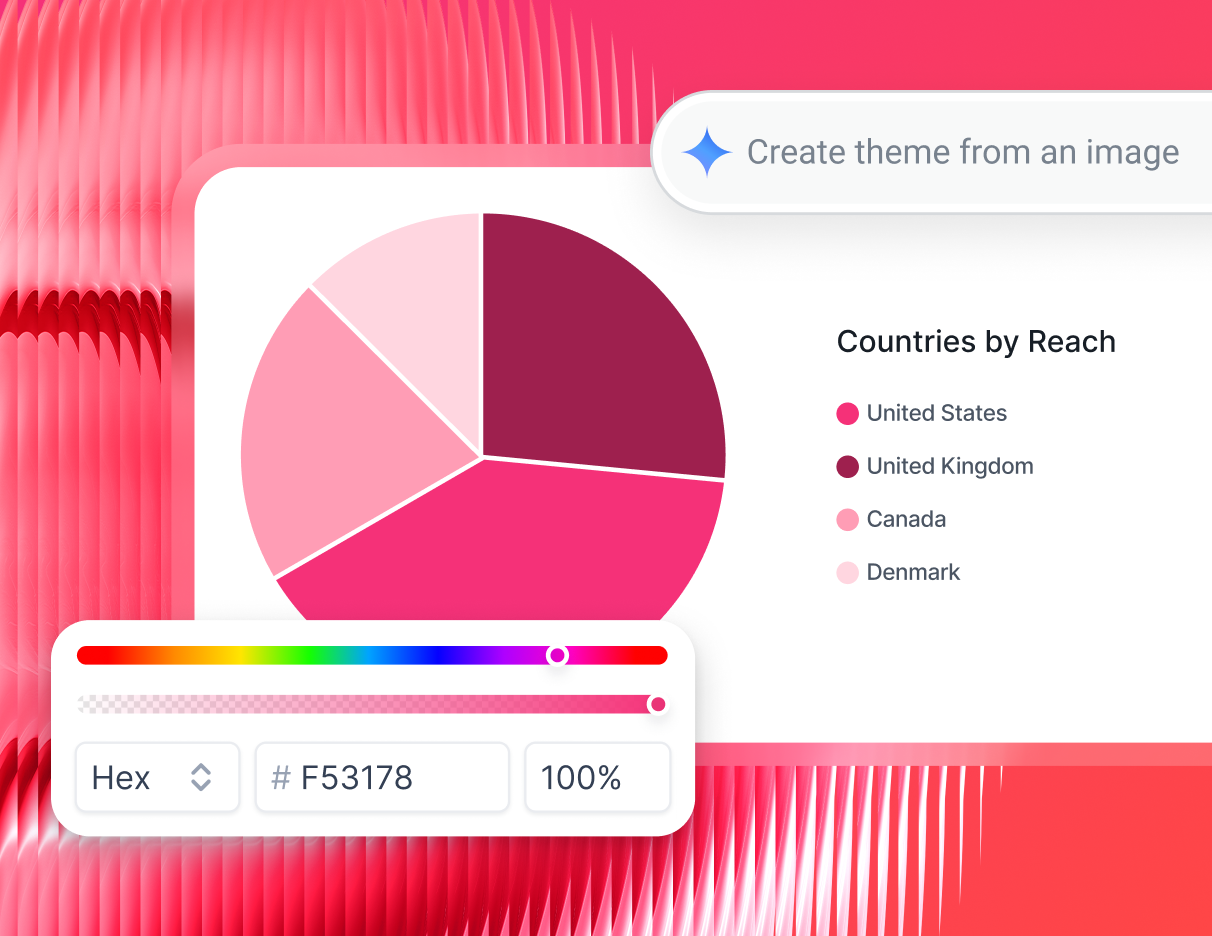
Not only can you customize data, but also the look of the reports.
With Whatagraph IQ, you can simply upload a screenshot of your brandbook or type in a prompt and Whatagraph automatically applies the fonts and colors to your report in seconds.
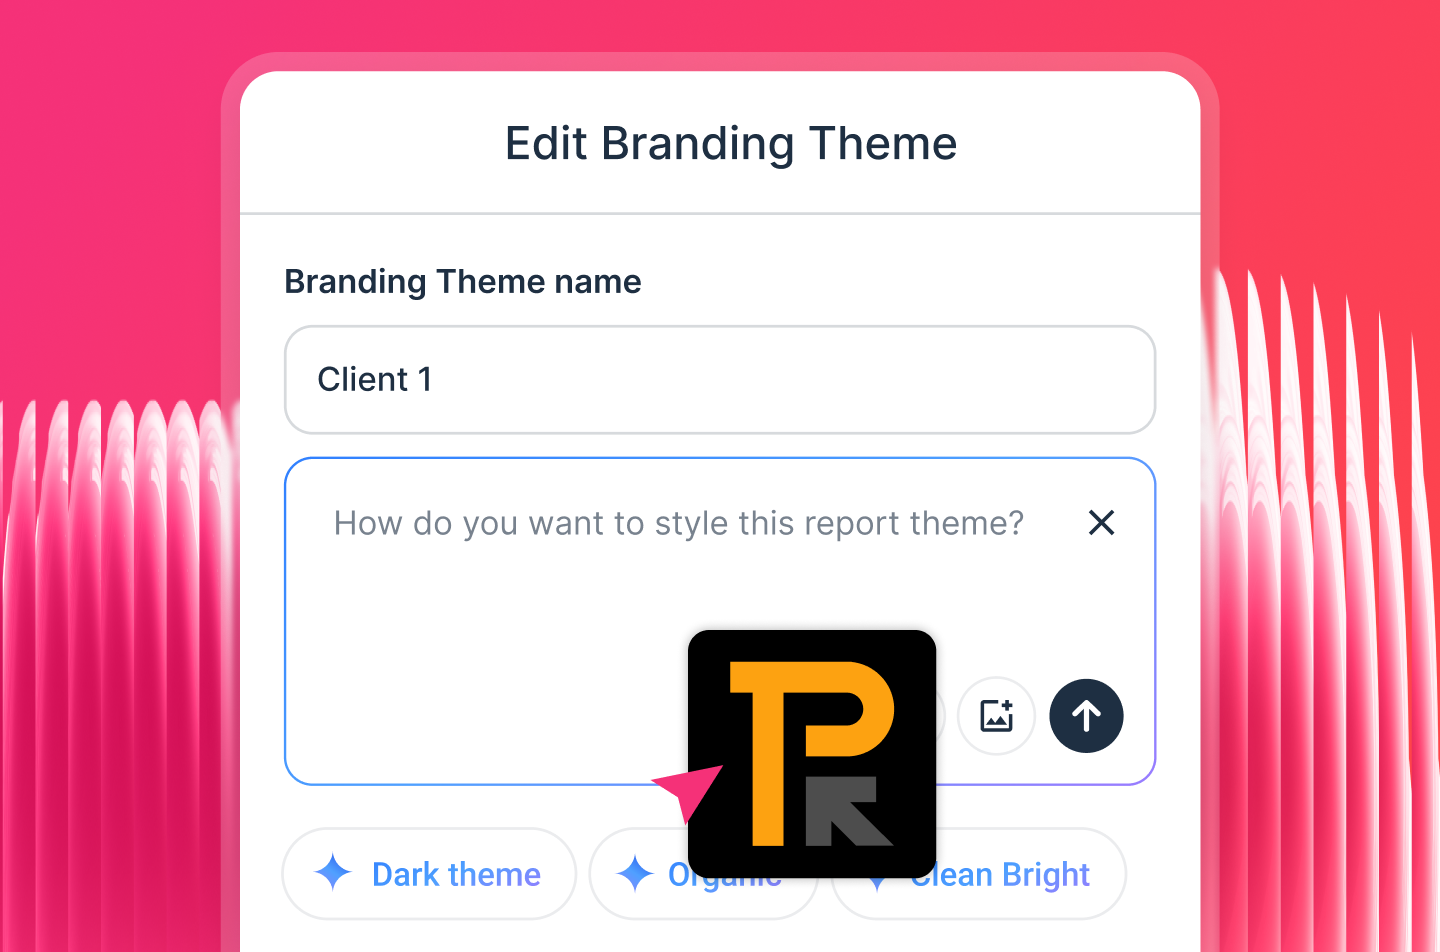
Having access to custom reports and white-labeling is important, especially for marketing agencies that value full control over the look and feel of their reports.
4. AI insights and summaries
You can automate many parts of reporting, but how about writing performance summaries? Or, getting insights from your Facebook ad account?
AI reporting features solve these.
On Whatagraph, you’ve got access to two innovative AI features:
- AI chatbot: Ask the AI chatbot any questions you have about your Facebook Ads data. For example, “Which ad set had the best ROAS this month?” or “What was our top-performing campaign by CTR?”
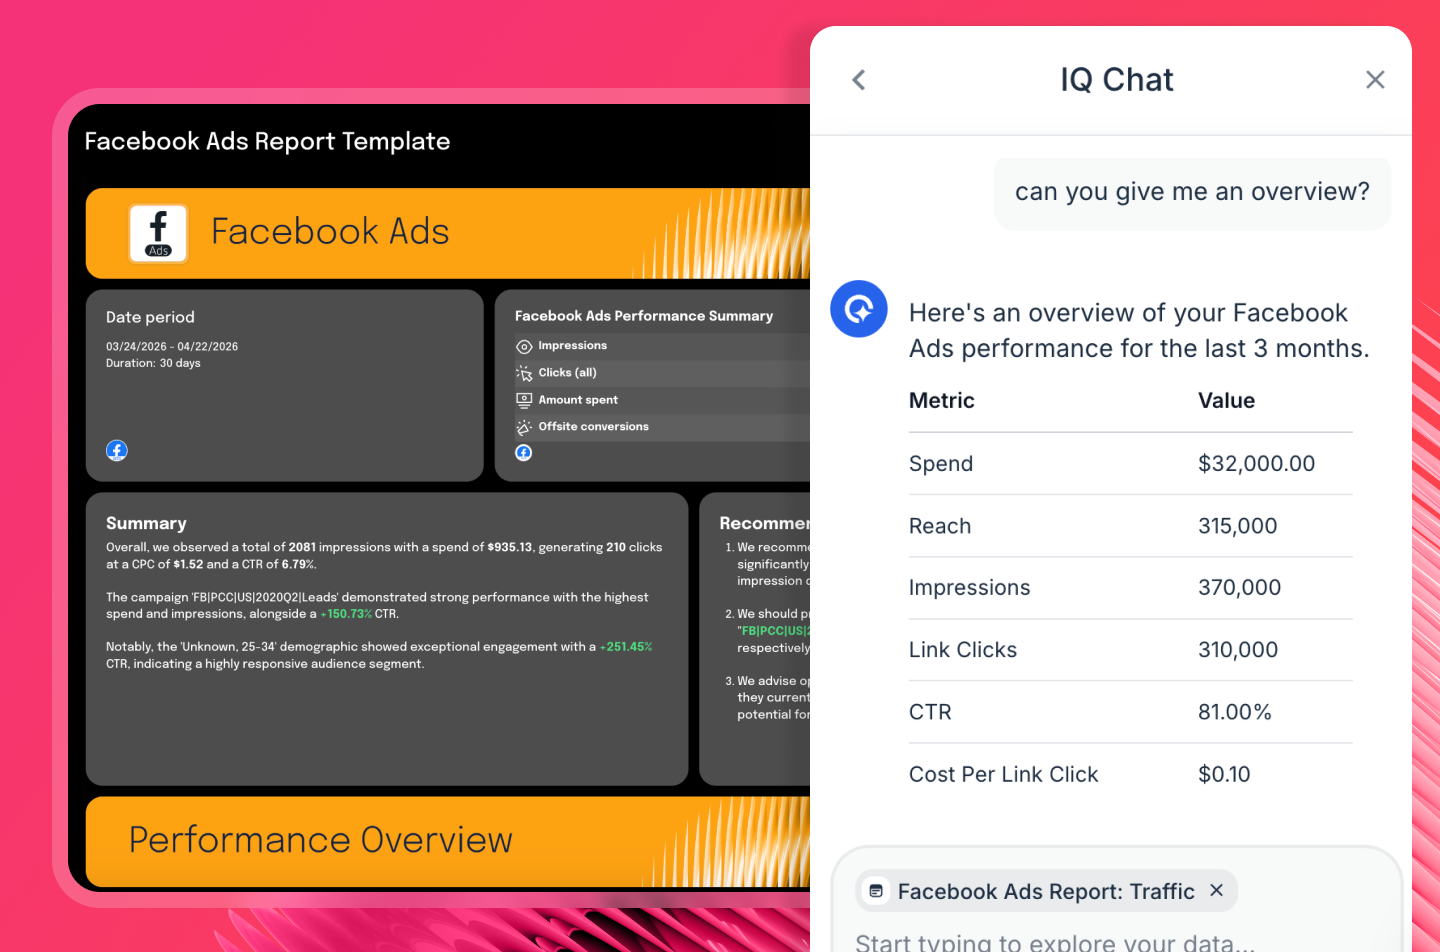
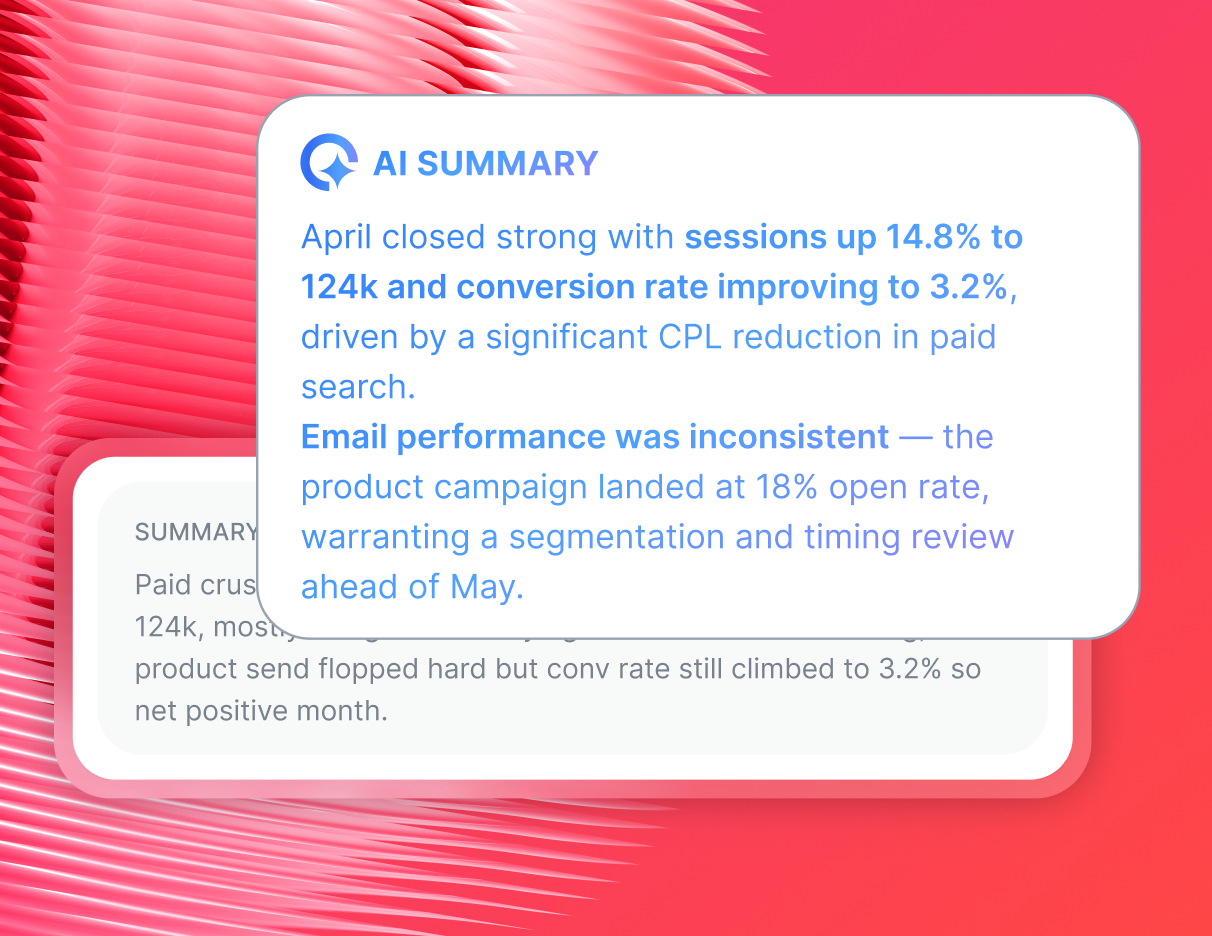
- AI summaries: Ask AI to write a Facebook Ads performance summary, which you can add directly to your reports. Edit it further to add a bit of a human touch.
All of this means you don’t have to write summaries from scratch.
You can instantly turn Facebook marketing data into clear insights that you can show to clients.
5. Fast and friendly customer success
No matter how easy your Facebook Ads reporting tool is, you may still need help going through things.
At Whatagraph, all users (no matter their plan) can reach us via live chat. We promise first response times of under 4 minutes, and most issues are resolved within four hours.
On the more advanced plans, you'll be assigned a dedicated Customer Success Manager who will help you:
- Migrate your data from your previous tool (if you were using one)
- Set up your first folders, dashboards, and reports
- Make custom data blends, metrics, and dimensions
- Anything else you need help with
How do I automate Facebook Ads reporting with Whatagraph’s Facebook Ads report generator
If you're still exporting CSVs from Ads Manager, pasting them into spreadsheets, and rebuilding the same report every month, there's a better way.
Whatagraph connects directly to your Facebook Ads account and handles the heavy lifting, so you can deliver Facebook automated reports to clients without the manual grind. Here's how the whole process works.
1. Connect your Facebook Ads account
From your Whatagraph workspace, select Facebook Ads, authenticate with your login, and your data starts flowing immediately. No devs, no third-party connectors, no API setup.
Instead of manually exporting data every time you need a report, Whatagraph pulls it automatically and keeps it up to date.
Need to report across more than just Facebook? Pull in data from 60+ fully managed integrations, including:
- PPC: Google Ads, Meta Ads, LinkedIn Ads, Pinterest Ads, TikTok Ads
- Social: Instagram, TikTok, YouTube, Facebook
- E-commerce: Shopify, BigCommerce, Magento
- SEO and Analytics: GA4, Semrush, Ahrefs, SE Ranking, Matomo
- Email: Mailchimp, ActiveCampaign, Constant Contact
Every integration is managed by Whatagraph's engineering team, so you're never the one dealing with broken connections. Uptime has averaged 99.95% over the past 6 months, with engineers on call around the clock if anything goes wrong.
2. Organize your data
Raw data from Facebook Ads Manager is messy.
Campaign names are inconsistent, metrics don't match across platforms, and blending data from multiple accounts is a manual nightmare.
Whatagraph works as a Facebook campaign tracker across all your client accounts, letting you standardize, blend, and organize everything before a single chart gets built:
- Group campaigns by channel, ad group, geo, or audience
- Standardize metric naming across platforms and accounts
- Blend cross-platform data (e.g., Facebook Ads and Google Ads in one unified view)
- Apply tags and folders to organize by client, account manager, or region
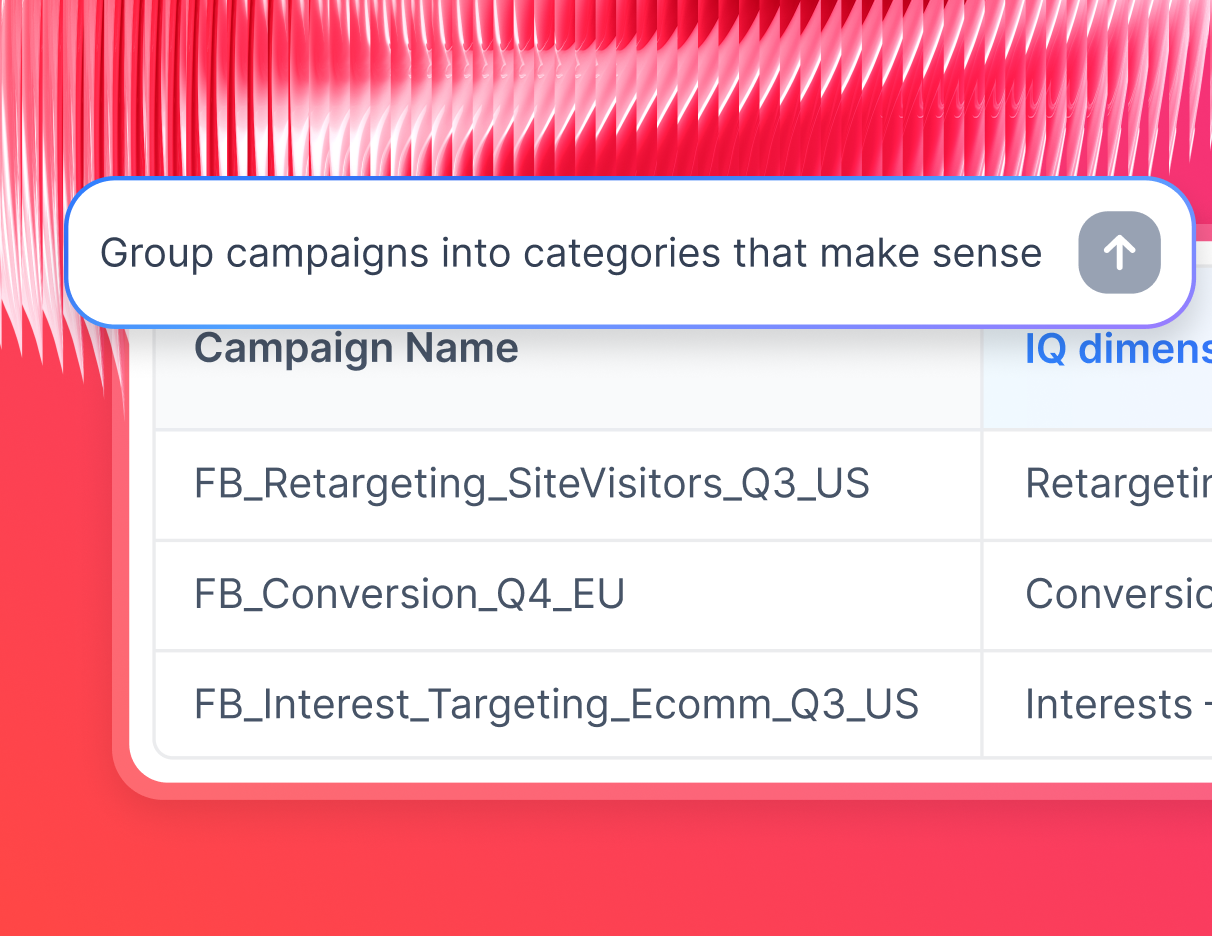
On advanced plans, IQ Dimensions takes this even further. Instead of building custom dimensions manually, just describe what you need and AI handles it:
- Custom blends on demand. Tell IQ to combine all spend from Meta, TikTok, and Google Ads into one Paid Media metric and it builds it instantly
- Custom metrics without formulas. ROAS across channels, Add-to-Cart conversions, custom funnel KPIs, generated in seconds with no coding required
- Messy campaign names, fixed automatically. Got "FB_US_SpringSale_23" and "MetaUSA_Spring23" living as separate rows? Tell IQ to group them and it creates a clean, reusable dimension across all your reports
3. Create automated Facebook Ads reports for clients
This is where knowing how to create Facebook reports the old way, widget by widget and tab by tab, becomes completely optional.
Tell Whatagraph IQ what kind of Facebook ad campaign report you need and it builds the whole thing:
- Charts, KPIs, tabs, and layouts generated from a single prompt
- IQ Themes automatically applies your client's brand colors, fonts, and icons from a logo upload
This means less learning curve and more time doing things that matter.
https://youtu.be/M49D5LQZdhg?si=VgE1LDYtXqlaOM0M
Prefer to stay hands-on? A blank canvas with drag-and-drop widgets gives you full control:
- Adjust labels, sizes, icons, and layout
- Apply custom formulas to any widget
- Match color schemes to client or agency branding
- Set reporting periods, currencies, and visible sections
And with linked templates, you never have to update the same report twice. Edit the master once and every client report connected to it updates automatically.
4. Monitor performance across all accounts
Beyond client-facing reports, use Whatagraph as a Facebook ad tracker for your internal team.
Internal dashboards called Overviews give your team a single place to:
- See KPIs across all Facebook campaigns and clients at once
- Spot underperforming campaigns before clients do
- Track Account Manager performance across the book of business
- Set spend caps, CTR benchmarks, and custom performance goals
Filter by client, campaign type, region, or manager, however your ops are structured. Your team stops bouncing between platforms and starts making decisions from one place.
5. Use AI to write summaries and answer performance questions
Numbers alone don't retain clients. Clear, confident explanations of what those numbers mean do.
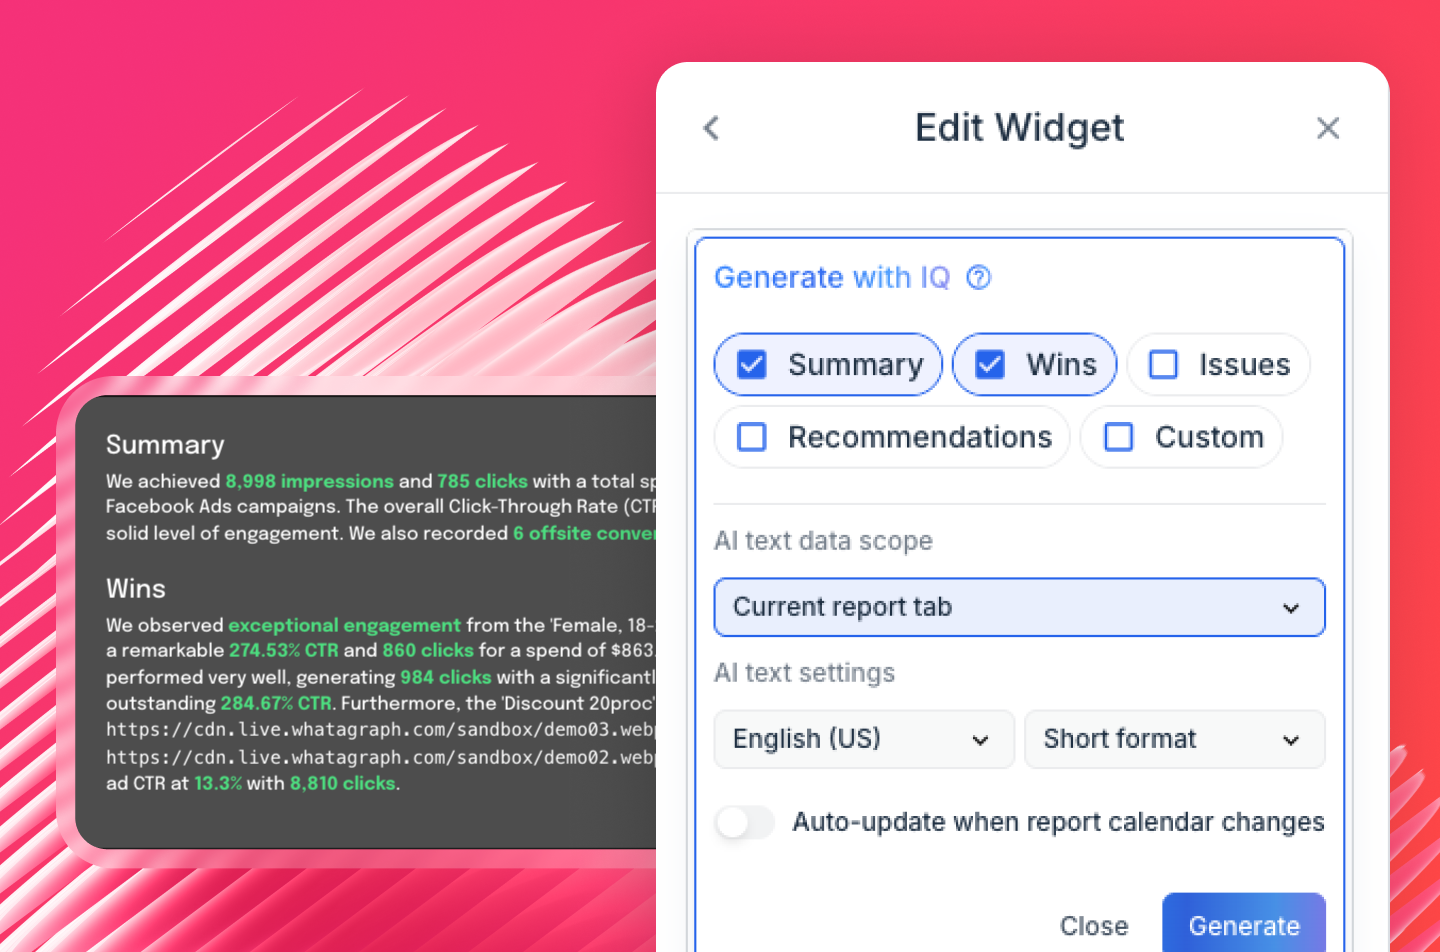
Instead of writing performance commentary from scratch every reporting cycle, Whatagraph AI generates summaries directly inside your reports:
- Pick the format: Summary, Wins, Recommendations, Issues, or a custom prompt
- Choose the length and tweak the tone before it goes to the client
- Summaries are available in 18 languages for global agency teams
Try it out for yourself here:
Your internal team gets the same benefit.
Anyone can type a question like "Which campaign had the best ROAS last month?" or "Compare Facebook Ads performance across all my clients" and get a plain-English answer instantly, pulled from your actual Facebook Ads data. No pivot tables, no digging through Ads Manager.
6. Share and schedule reports
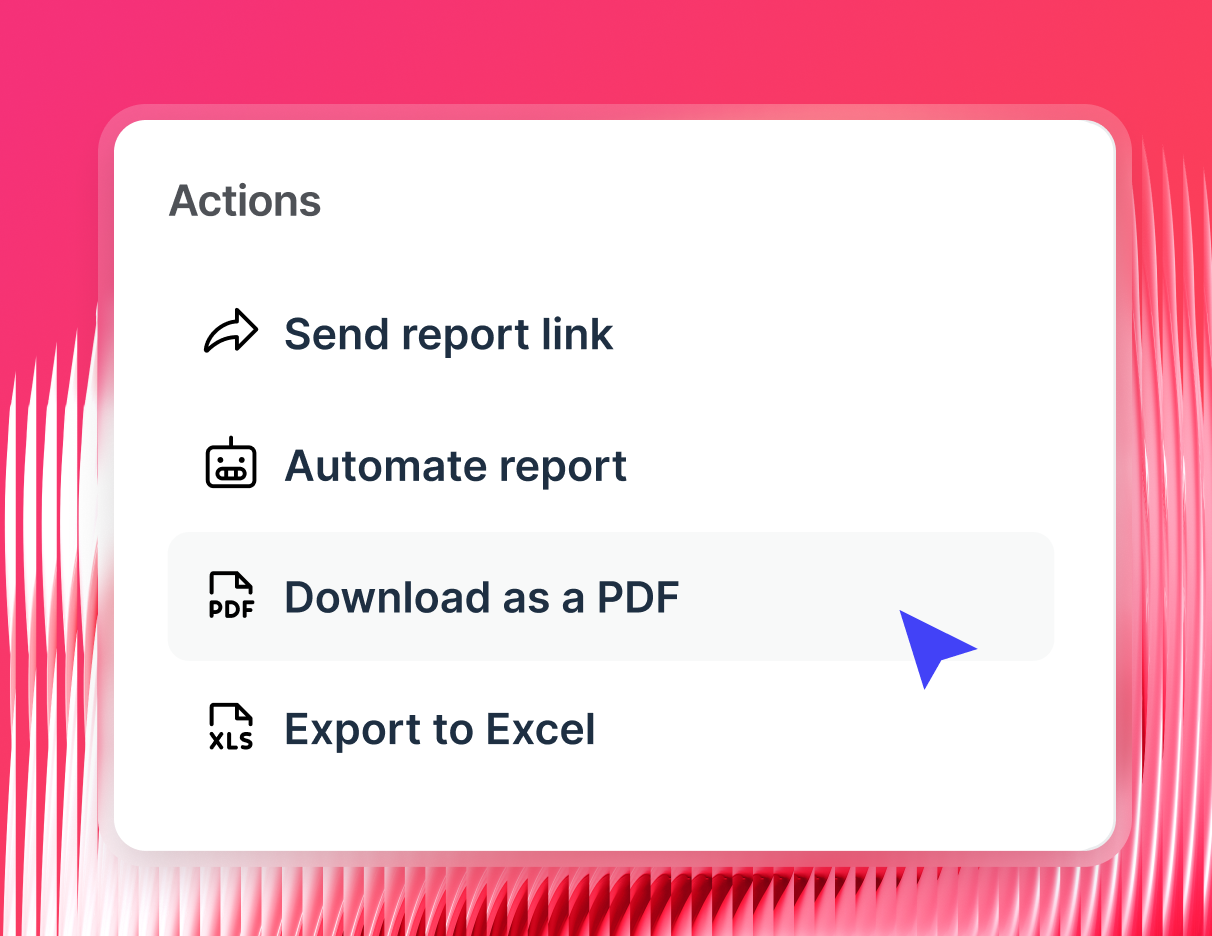
Reporting Facebook Ads to clients doesn't have to mean attaching a PDF and hoping they read it. Whatagraph gives you full control over how and when reports land:
- Automated emails: Set the cadence, daily, weekly, or monthly, and reports go out without you touching them
- Live links: Clients see real-time data every time they open it, no login required
- PDF or CSV exports: For offline access or internal archives
- White-label delivery: Your domain, your branding, your sender address, Whatagraph stays invisible
And if clients want to dig deeper themselves, turn on IQ Chat so they can ask questionsWhat key metrics should be in a Facebook Ads report?
What key metrics should be in a Facebook Ads report?
Tracking the right Facebook Ads metrics depends entirely on what your campaign is trying to achieve.
Lars Maat, Co-Founder of Maatwerk Online, one of Europe's leading digital marketing agencies, puts it simply: the metrics that matter for an ecommerce campaign are fundamentally different from the ones that matter for lead generation.
Here's how his team structures it.
Ecommerce campaigns
For ecommerce clients, every metric ties back to revenue. These are the top KPIs his team tracks:
- Purchases: the core conversion event; how many people actually bought
- Revenue: total value generated from Facebook Ads campaigns
- ROAS: return on ad spend; the clearest signal of campaign profitability
- Cost: total spend across campaigns for the reporting period
- Cost per purchase: how much it costs to drive one transaction
- Conversion rate: the percentage of clicks that result in a purchase
- Impressions: how widely your ads are being seen
- Clicks: volume of traffic driven from ads
- CPC: cost per click; useful for diagnosing creative or targeting inefficiency
- CTR: click-through rate; signals how compelling your ad creative is
Grab the e-commerce Facebook Ads report template co-created with Lars for free.
Lead generation campaigns
For lead gen, the framework shifts. Revenue isn't always immediately visible in Ads Manager, which means the metrics you track need to reflect the full picture of what a lead is actually worth.
- Website leads: total leads generated from Facebook Ads campaigns
- Amount spent: total budget deployed for the reporting period
- ROAS: return on ad spend, factoring in offline conversion data where possible
- Cost per lead: how much each lead costs to acquire
- Impressions: reach and visibility across your target audience
- Clicks: traffic volume driven by campaigns
- CTR: engagement signal for ad creative performance
- CPC: cost efficiency of clicks across ad sets
Grab the lead generation Facebook Ads report template co-created with Lars for free.
Why CPL alone can be misleading
This is where Lars's approach gets particularly valuable. His team doesn't just look at how many leads a campaign generates, they look at how many of those leads actually become clients.
As Lars explains:
In Meta Ads, we don't focus on the number of leads. Instead, we look at how many new clients actually come from those leads. You might have one campaign with 100 leads at €10 CPL and another with 10 leads at €80 CPL, on paper, you'd kill the second one. But what if that second campaign brings in 9 clients, while the first only brings in one? That's why offline conversion tracking in Meta Lead Gen campaigns is so important.
The takeaway for agencies: a Facebook Ads report that only shows CPL is an incomplete picture. Connecting offline conversion data to your Meta campaigns, and surfacing that in client reports, is what separates agencies that prove real ROI from those that just report surface-level numbers.