


What is a marketing deck, and how do agents help?
A marketing deck is a visual slide presentation that turns raw numbers into a data story for stakeholders and clients. You can use it to pitch services to clients, report monthly or quarterly performance metrics, and recommend marketing strategies.
Clients and stakeholders are more likely to digest and understand decks better than reports and dashboards filled with numbers.
But most agencies still build client decks manually. Here’s what we’ve heard across marketing agencies:
- A US casino-marketing agency merges decks from its media, social and digital teams. The chief creative officer said: "we build a keynote document or a PowerPoint document, and we just do some screenshots and sort of throw those in there." Across clients, that adds up: "if you got 15, 20 clients doing that, you got 20 hours, you know, a month going just towards that."
- A UK agency builds a monthly deck per client, with every department adding its own slides. Its head of paid media said: "with the decks, it's ... manual, so we just go into each of the sources manually on a separate tab and kind of copy it across."
- A UK full-service agency builds its decks in Google Slides. Its SEO lead said: "we had to manually take screenshots and chuck them in, type out summaries and key findings." A monthly deck takes one to two hours, and a six-month review takes longer.
This Redditor explains it best:

A team lead at a Dutch social agency also told us this about their weekly client deck:
“Creating a deck takes almost eight hours ... now 99% of the time just goes into showing the data and showcasing the data.”
With IQ Agents, AI agents that work inside Whatagraph, you can automate this process.
There’s no context switching or screenshotting involved, because decks are built from the same governed data foundation and reports you built on Whatagraph so the same numbers and insights show up everywhere. And you save a ton of time because everything is already there.
In Whatagraph, agents can build marketing decks in three ways:
- Using Gamma through an external MCP connector - this is great if you already have a Gamma account
- Using computer browser and creating a downloadable Powerpoint - great if you’re used to Powerpoint or if your client prefers that
- Using HTML artifacts - best option if you want to stay inside one platform and reduce context switching and multiple tools (also the most comprehensive version)
We’ll show you how this works in the next section.
How to build a marketing deck in Whatagraph using agents
Here’s how to build a marketing deck in Whatagraph using IQ Agents step-by-step:
- Connect your data sources. Bring in the data from all your marketing platforms into Whatagraph through native integrations or let agents build custom API integrations.
- Build your governed data foundation. Standardize dimensions, define metrics, blend data from different channels, combine data from different sources with agents helping you every step of the way. See this cross-channel marketing data page for more details.
- Create monthly marketing reports. Upload a template or a previous report to agents and it’ll build a marketing report for you based on your connected data sources, governed data layer, and time range. You can then schedule the agent to create the report every week, month, or quarter for automated client reporting.
- Write commentary inside reports. Agents can help with this too, taking into account the previous month’s report data and recommendations, external research (like PPC benchmarks), and context from external tools like Slack, Clickup, and Fathom. Read more in detail here.
- Create a custom agent for building presentations. Write in simple language prompt like:
Create an agent that builds presentations from my reports
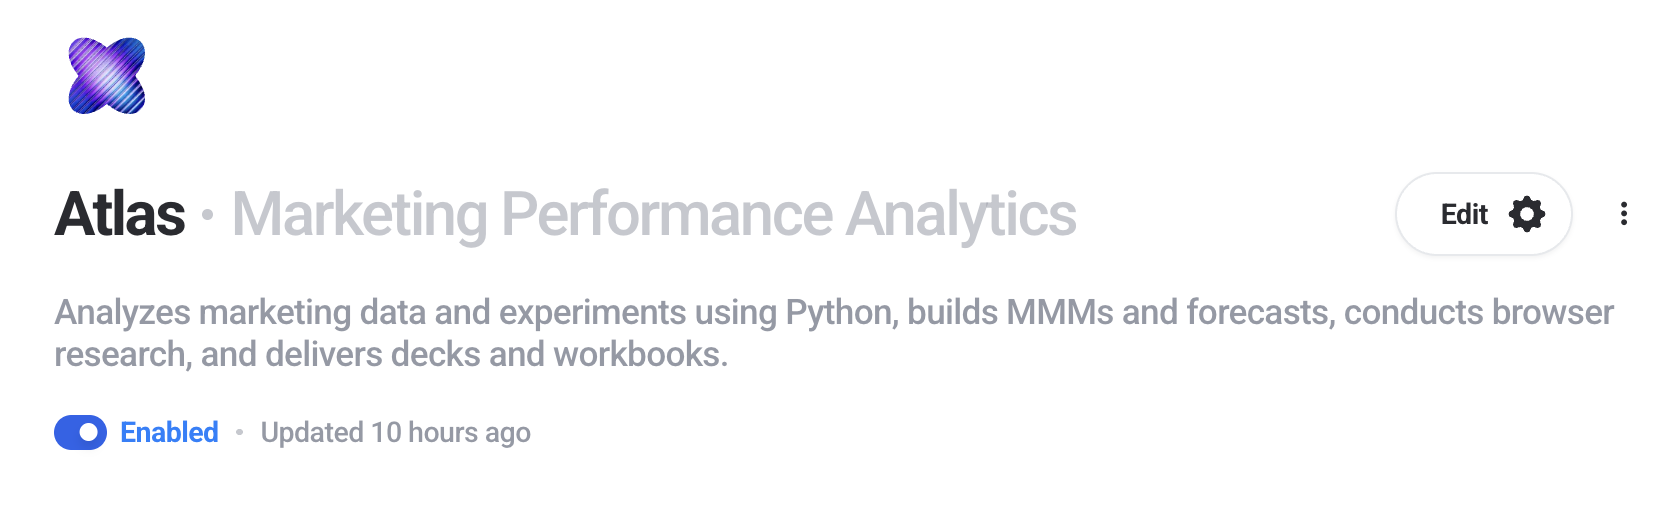
And IQ Agents built me a specialist agent called “Atlas” that does this in seconds:
- Start a conversation inside the agent. Simply say in plain language what report you want it to turn into a presentation, like so:
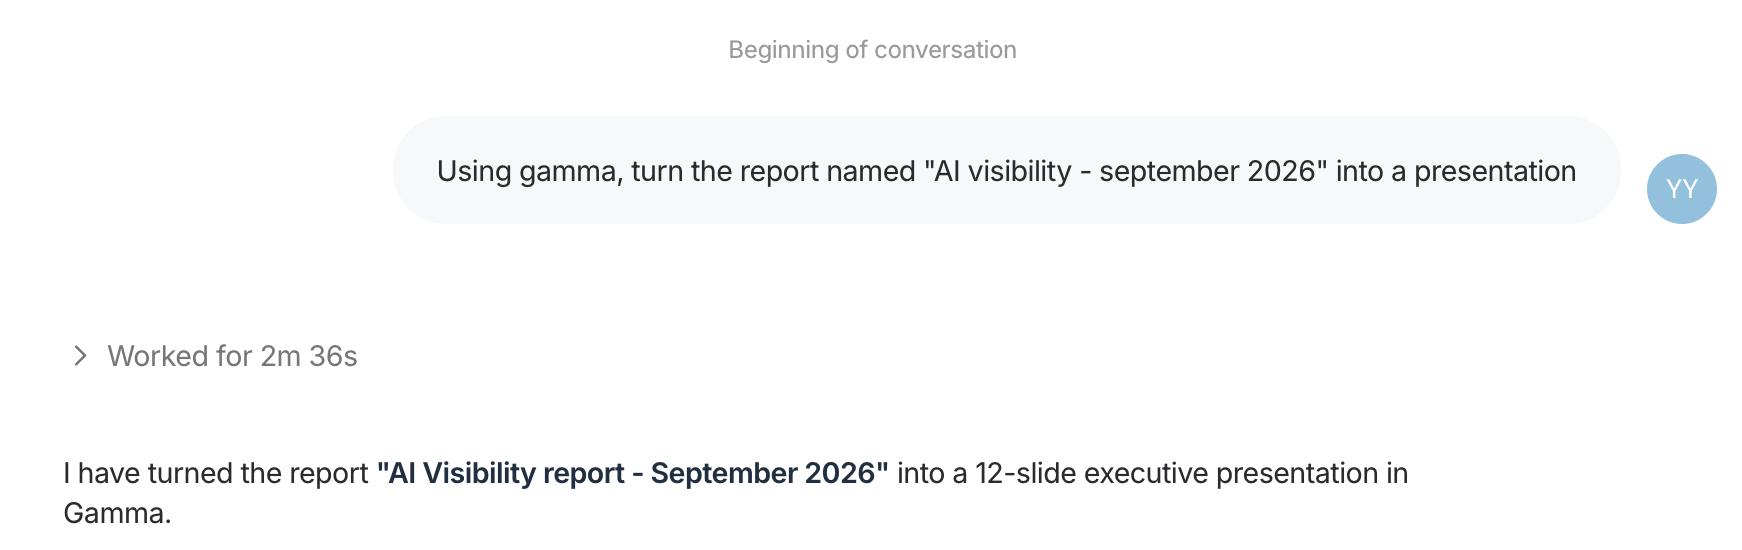
Turn the report named "[NAME]" into a presentation
That’s it, really. The agent reads the report and commentary and turns it into a deck with a visual story.
It took 2 and half minutes for Gamma:
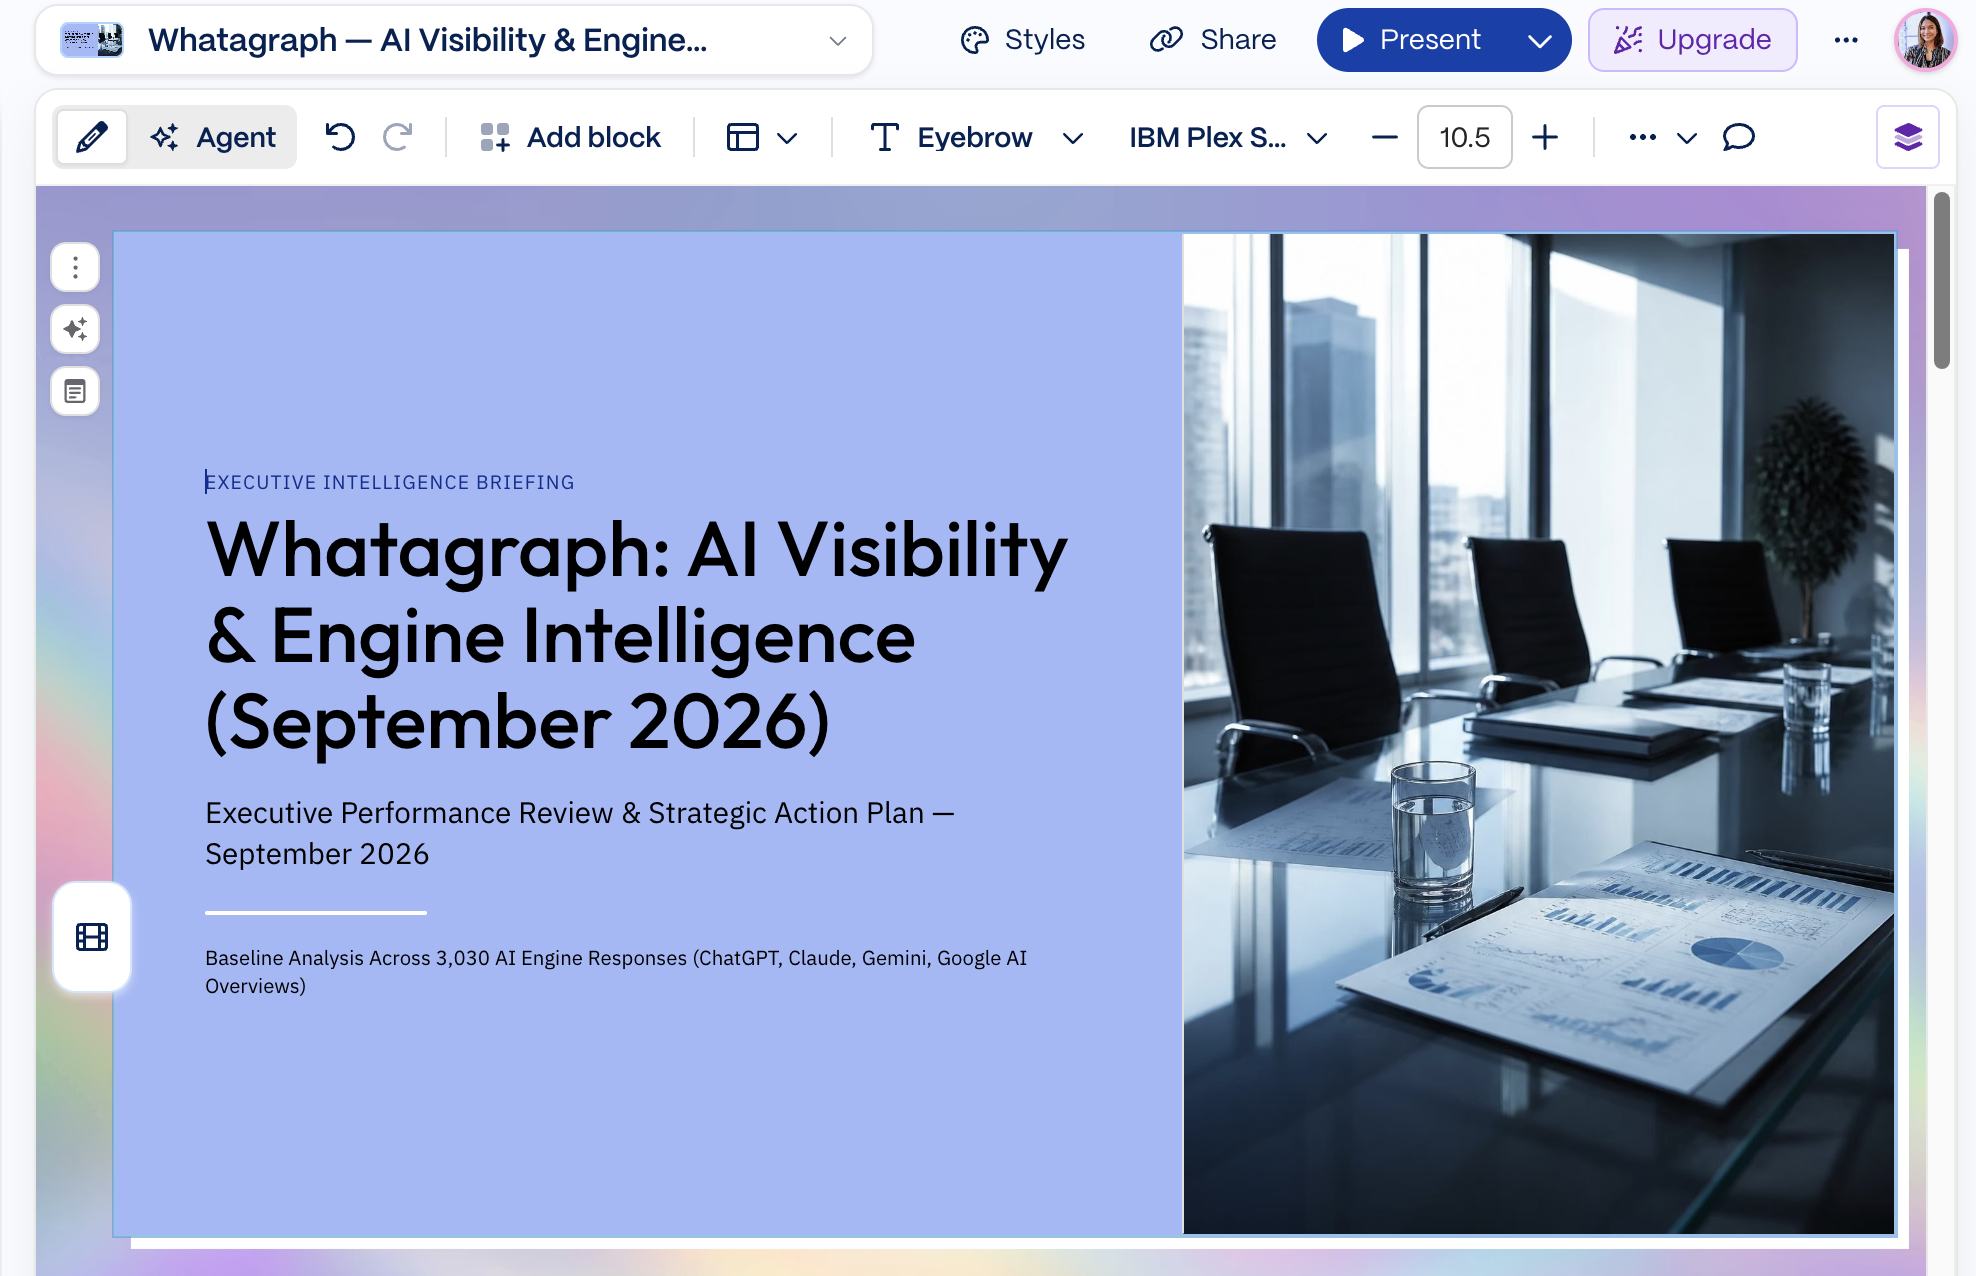
As always, the Gamma output was beautiful. But it requires having a Gamma account in the first place and takes you to a separate tool.
Then it took around 5 minutes for computer to turn it into a Powerpoint:
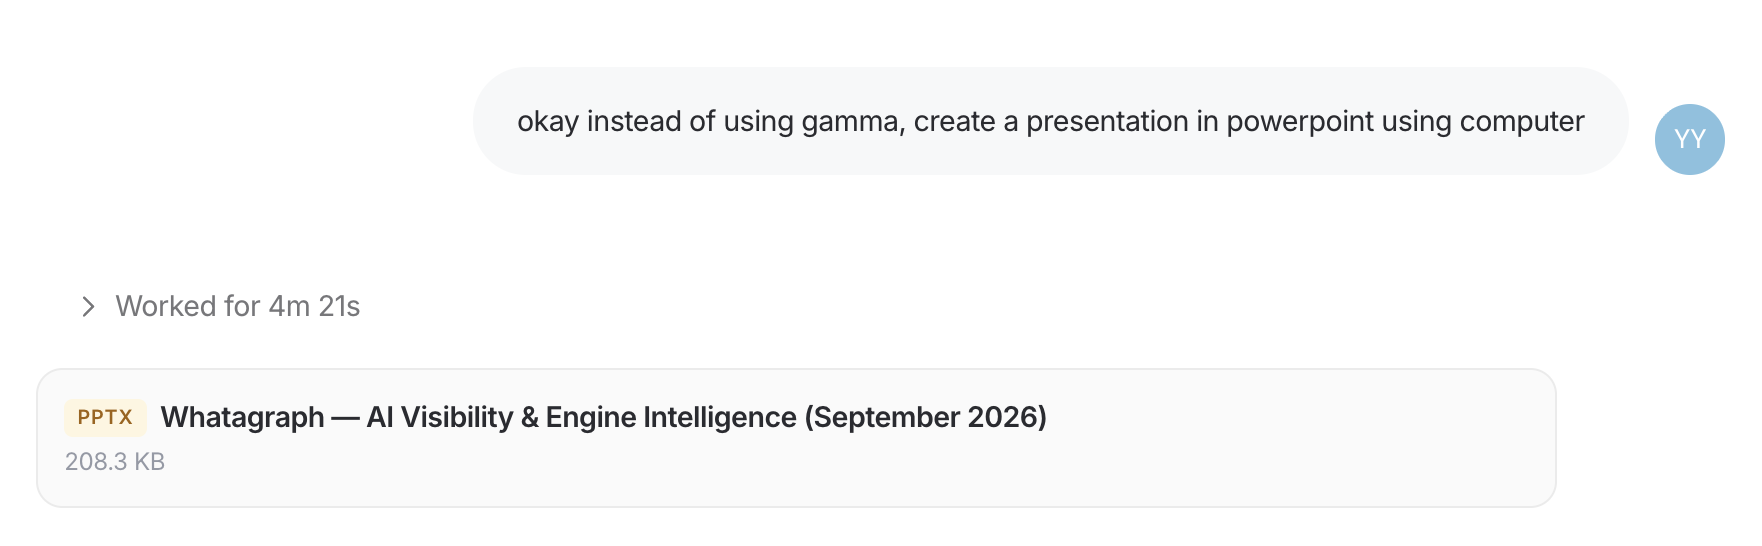
The output (opened with Keynote on Macbook) is a bit raw but my prompt was also very raw. You can tweak it further to make it branded and beautiful.
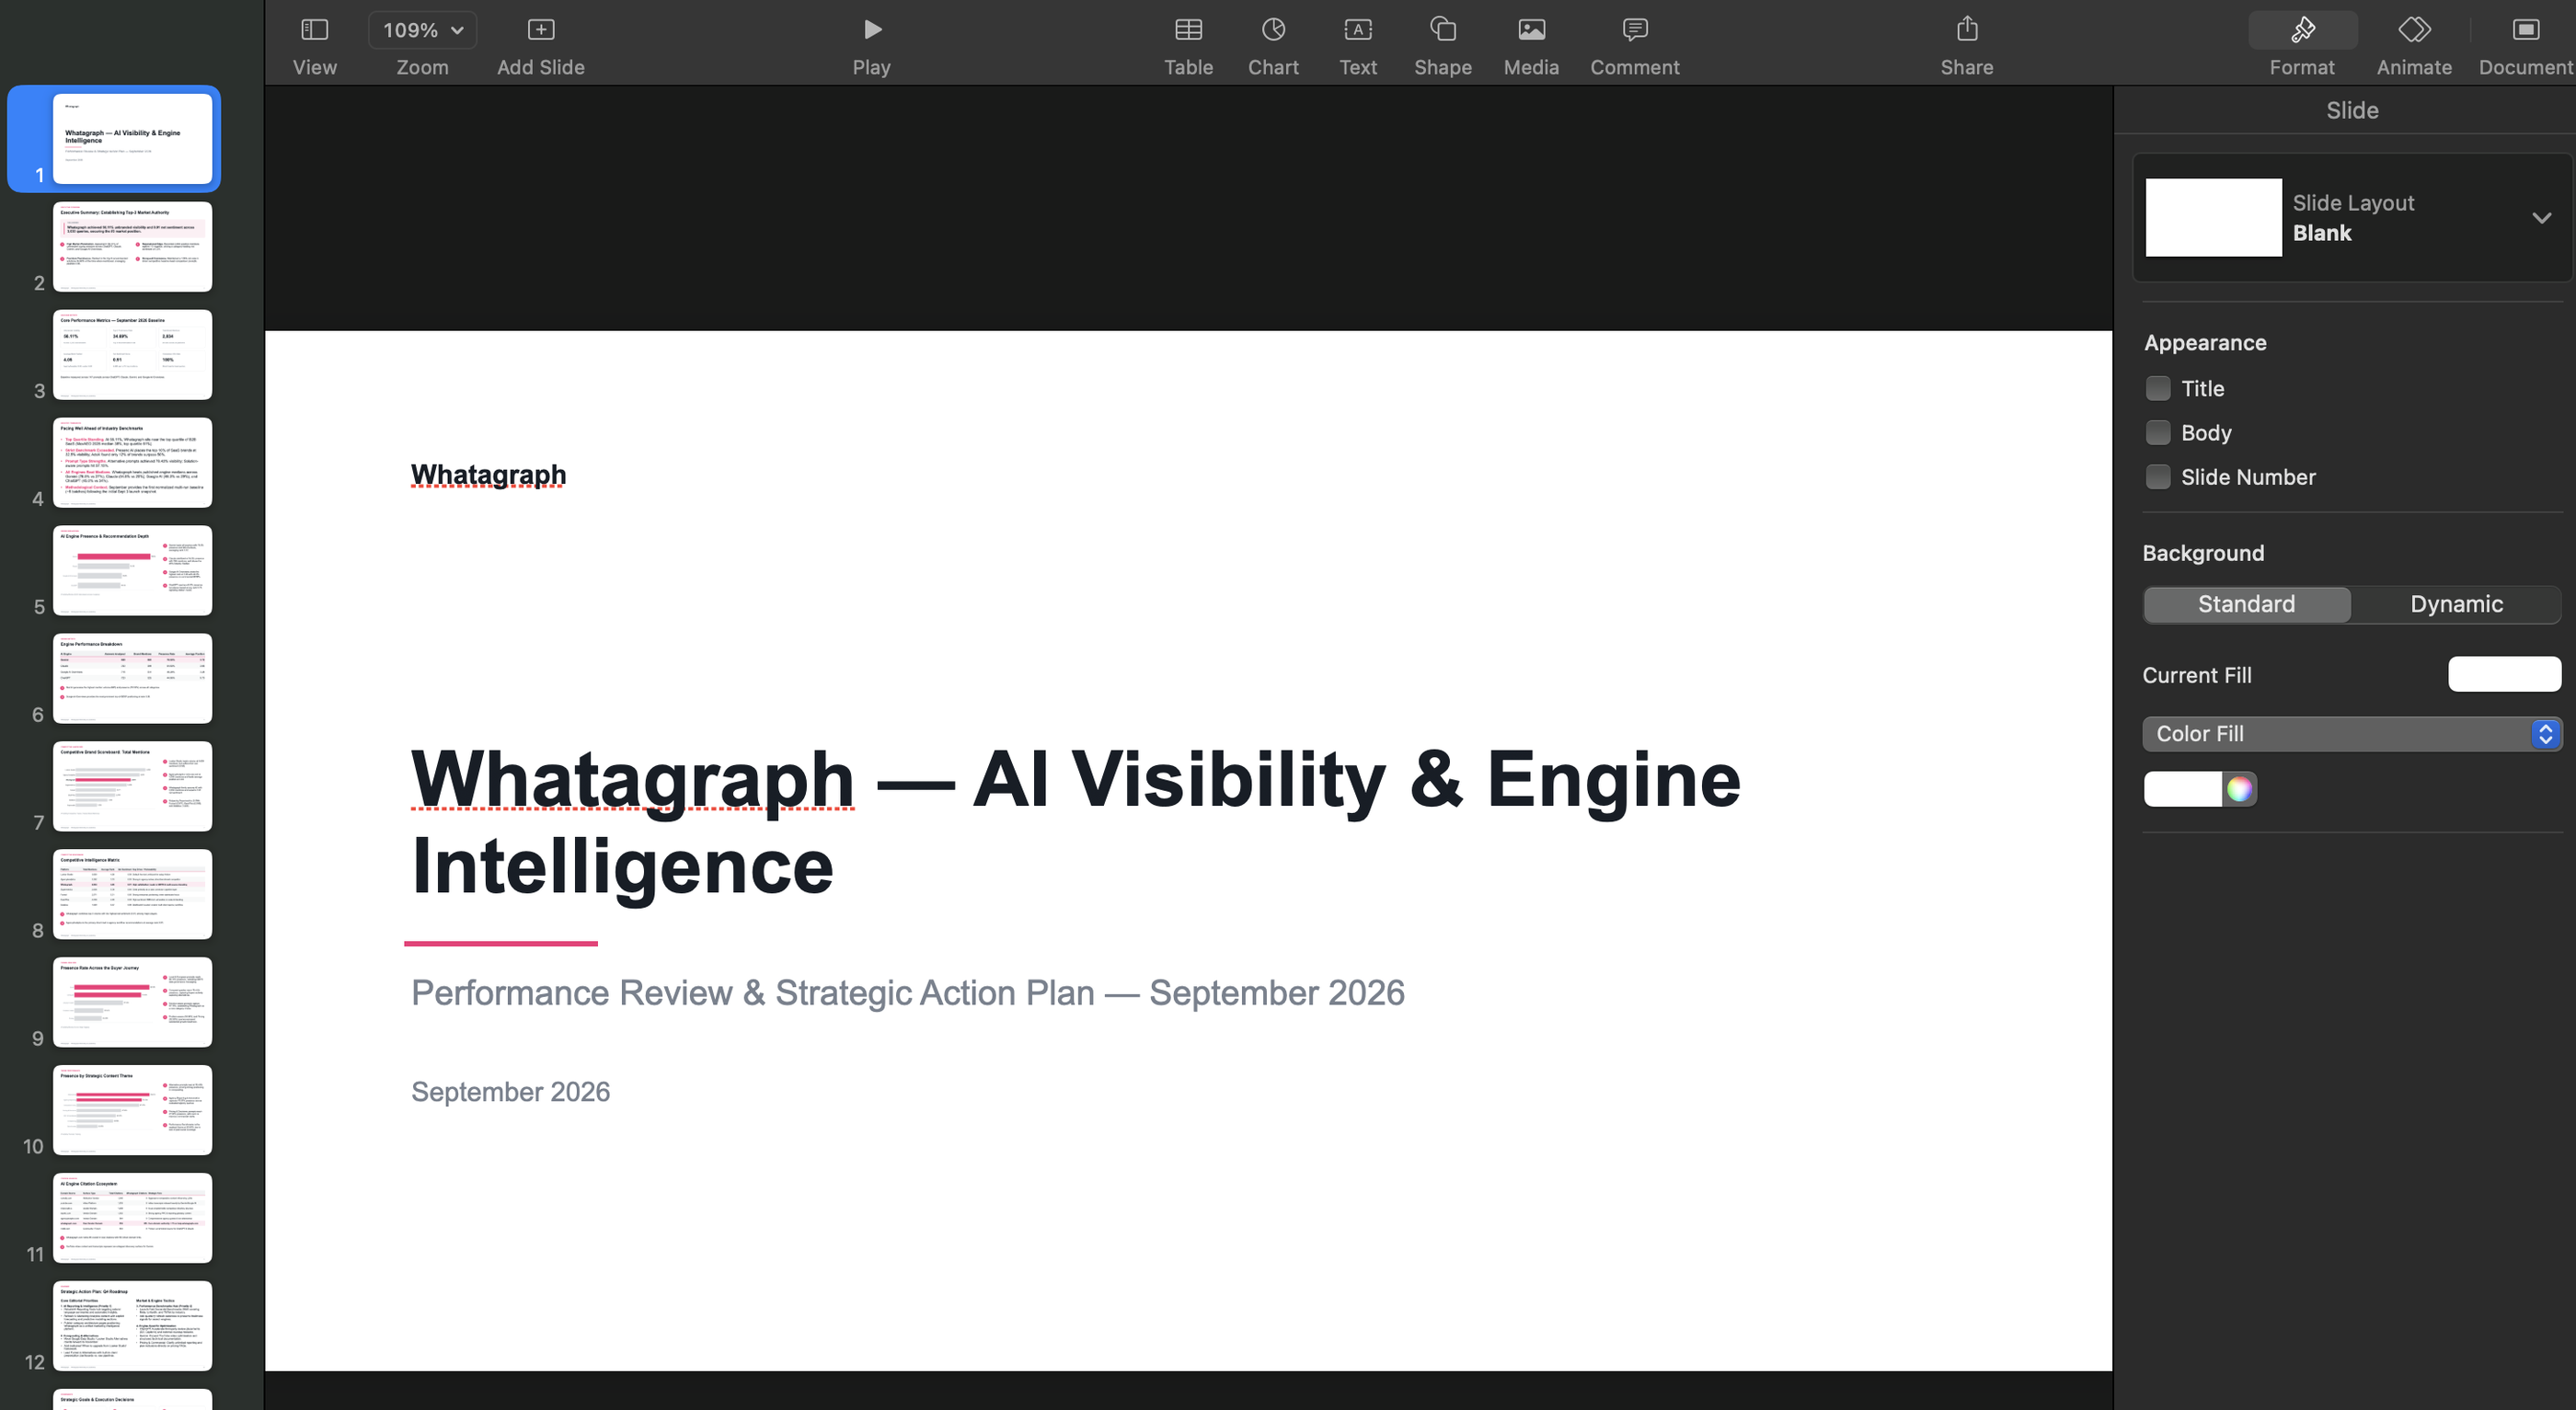
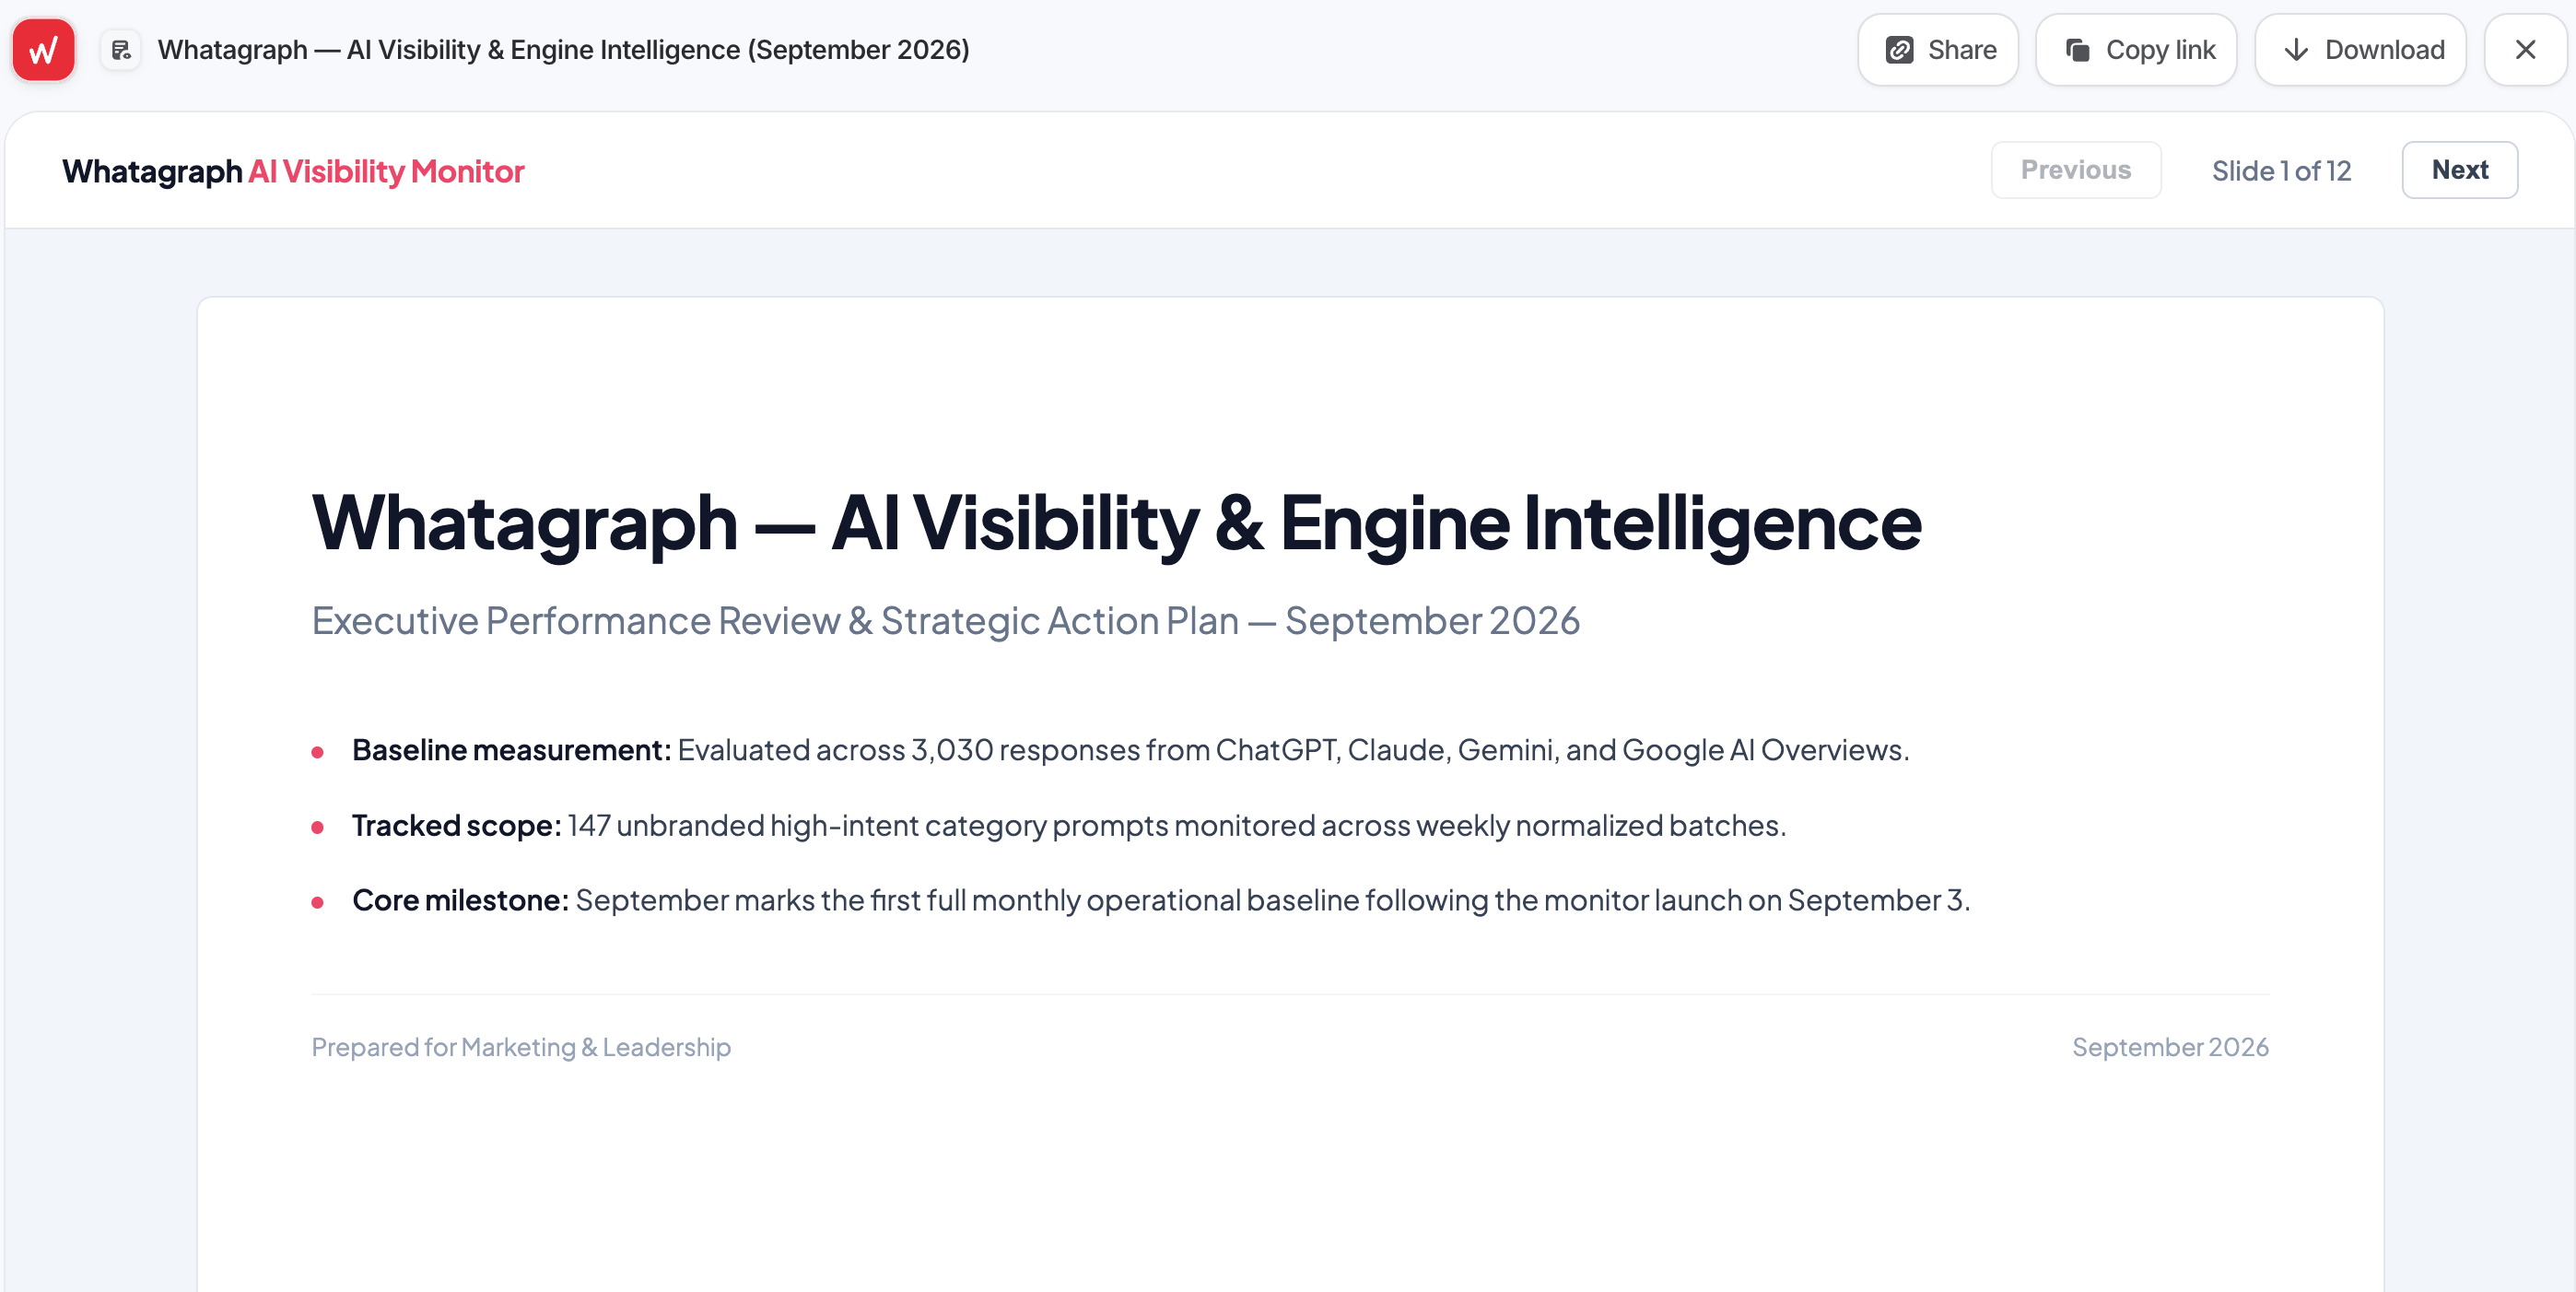
For HTML, it only took about 2 minutes:

My personal favorite was the HTML because the output is available inside of Whatagraph so I don’t need to context-switch to another tool, it’s the most on-brand, and the data story is much more comprehensive and easy to understand.
You can then share this HTML artifact with the rest of the team with password protection.
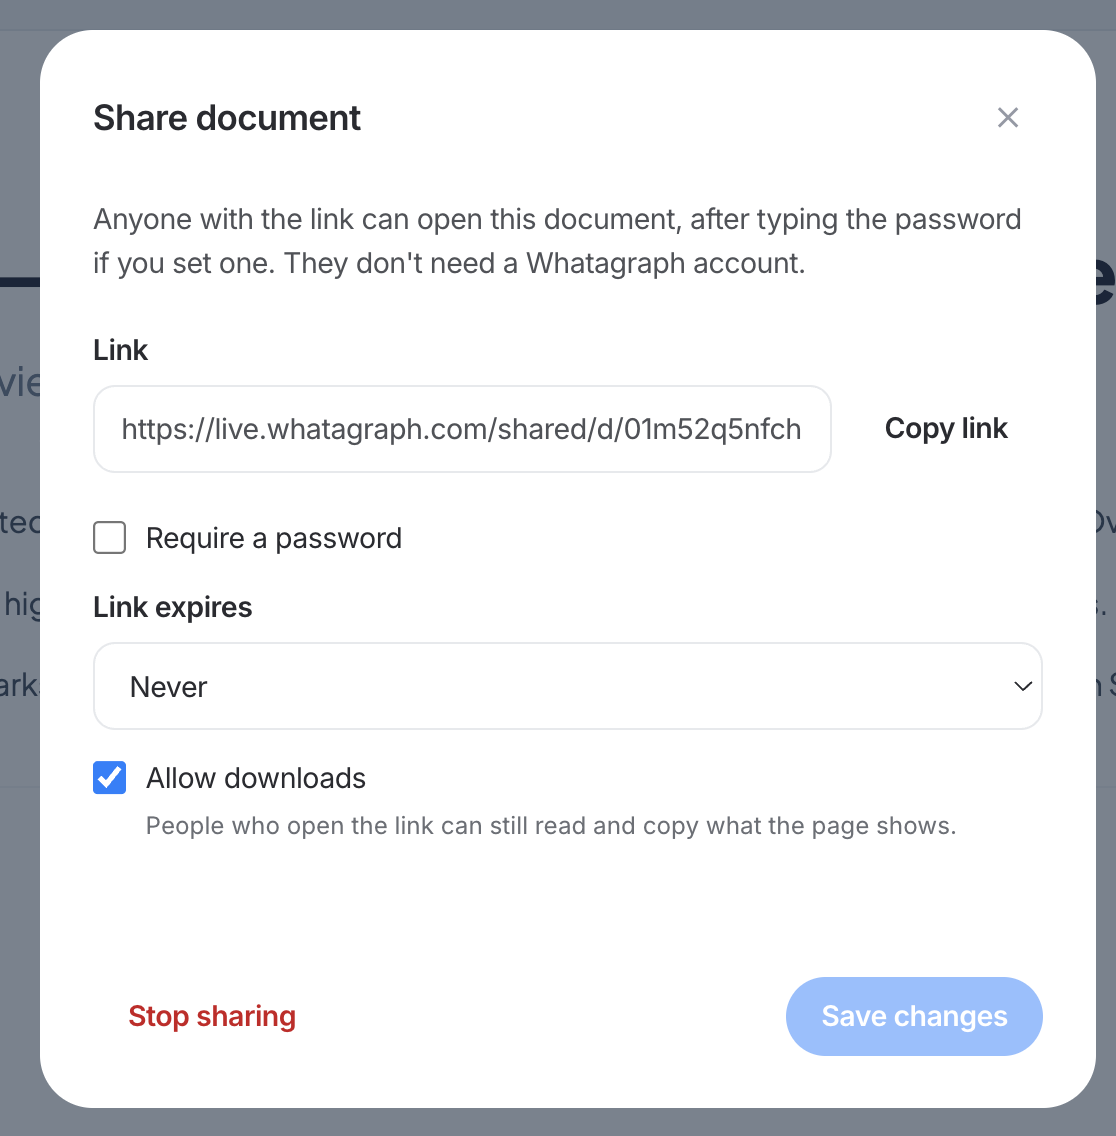
The agents don’t send anything to the client automatically (unless you want it to, but we don’t recommend this). Once it gives you the output, you review the deck, make adjustments, and only send it off the client once you’re satisfied.
Then, you can schedule this for the next month or quarter once you’ve aligned on a specific structure and template you want to use with the agent. You can still have the agent deliver the output to you first before you send it off to clients so you can check everything.
Marketing decks: automated vs. manual
Building a marketing deck by hand means screenshotting numbers from reports and adding them manually into slides. An agent builds the slides from the report, so your team only reviews them.
| Manual | With an agent | |
|---|---|---|
| Getting the numbers | Screenshots and retyped totals | Read straight from the report |
| Changes vs. last period | Worked out by hand | Taken from the report's comparisons |
| Slide copy | Written from scratch | Drafted from the report and its commentary |
| Updating next quarter | Rebuild or relink every chart | Run the agent again with new dates |
| Your team's time | Building the deck | Checking and presenting the deck |
What are the benefits of automating marketing decks?
- Time back. A UK full-service agency's SEO lead said automating decks could "trim that down from two or three hours to half an hour 50 minutes of just checking something and go this looks fine we can send it to them."
- Better margins on small retainers. A UK social agency said of its clients: "they might pay us four hours, but it takes us six or eight."
- The same numbers in the deck and the report. The agent reads from the Data Hub, where Whatagraph stores and cleans your data, so the slides show the numbers your client sees in the report.
- Consistent decks across clients. Every deck follows the same brief and slide order, no matter who builds it.
- More time on the story. Your team spends its time on what the numbers mean, not on screenshots.
Best practices for marketing decks
- Start from the report. Agree on the report first, so the deck has one source. It helps to structure a campaign report around the campaign's goals.
- Lead with the explanation. A Dutch Google Ads agency said: "the key principle is explanation first and the data is there to support your explanation instead of there's data and I need to explain the data."
- Keep one idea per slide. A client should get each slide's point in a few seconds.
- Lock the dates. An agency that serves financial-services firms said: "I keep the dates locked rather than rolling so we can have a point in time reference for each month or quarter."
- Wait for late conversions. Google Ads reports conversions by click date, so the most recent numbers may not be complete yet. Build the deck a few days after the period ends.
Common challenges of automating marketing decks
The client wants their own template. Some clients need every deck in their own PowerPoint template, and copying slides into it every month is slow. Attach the template to the agent with computer use, and it builds the deck on that template. Check that the client's fonts, colors and logo live in the template's slide master, so every slide the agent adds follows their look.
Clients insist on a deck. A dashboard is faster, but many clients want slides. A London creative agency founder said: "It has to be a deck. That's the process." With computer use, the agent hands you a PowerPoint file, so the deck fits the client's process.
Numbers in the deck go wrong. Retyping totals leads to mistakes. A US PR agency account supervisor said: "I did the math wrong on that, and the client caught it later." Tell the agent to use only numbers from the report and to flag empty widgets, then check the numbers before you send.
The deck and the live report stop matching. Data keeps updating after you present. A multinational media agency said: "there is no kind of snapshot repository of what was presented." Lock the dates in the brief and save a snapshot of the report, a saved copy you can go back to, when you present.