What is an Analytical Report and How to Create One
Over the last few years, analytical reporting has become a vital part of business intelligence. Instead of making decisions that only seem logical, companies are adjusting their strategies based on data-driven insights from reports.

Apr 17 2020●5 min read


But, what exact fragments go into an analytical report? How do you go about making one? In today’s article, you’ll learn everything about creating an analytical report for your business.
What is an Analytical Report?
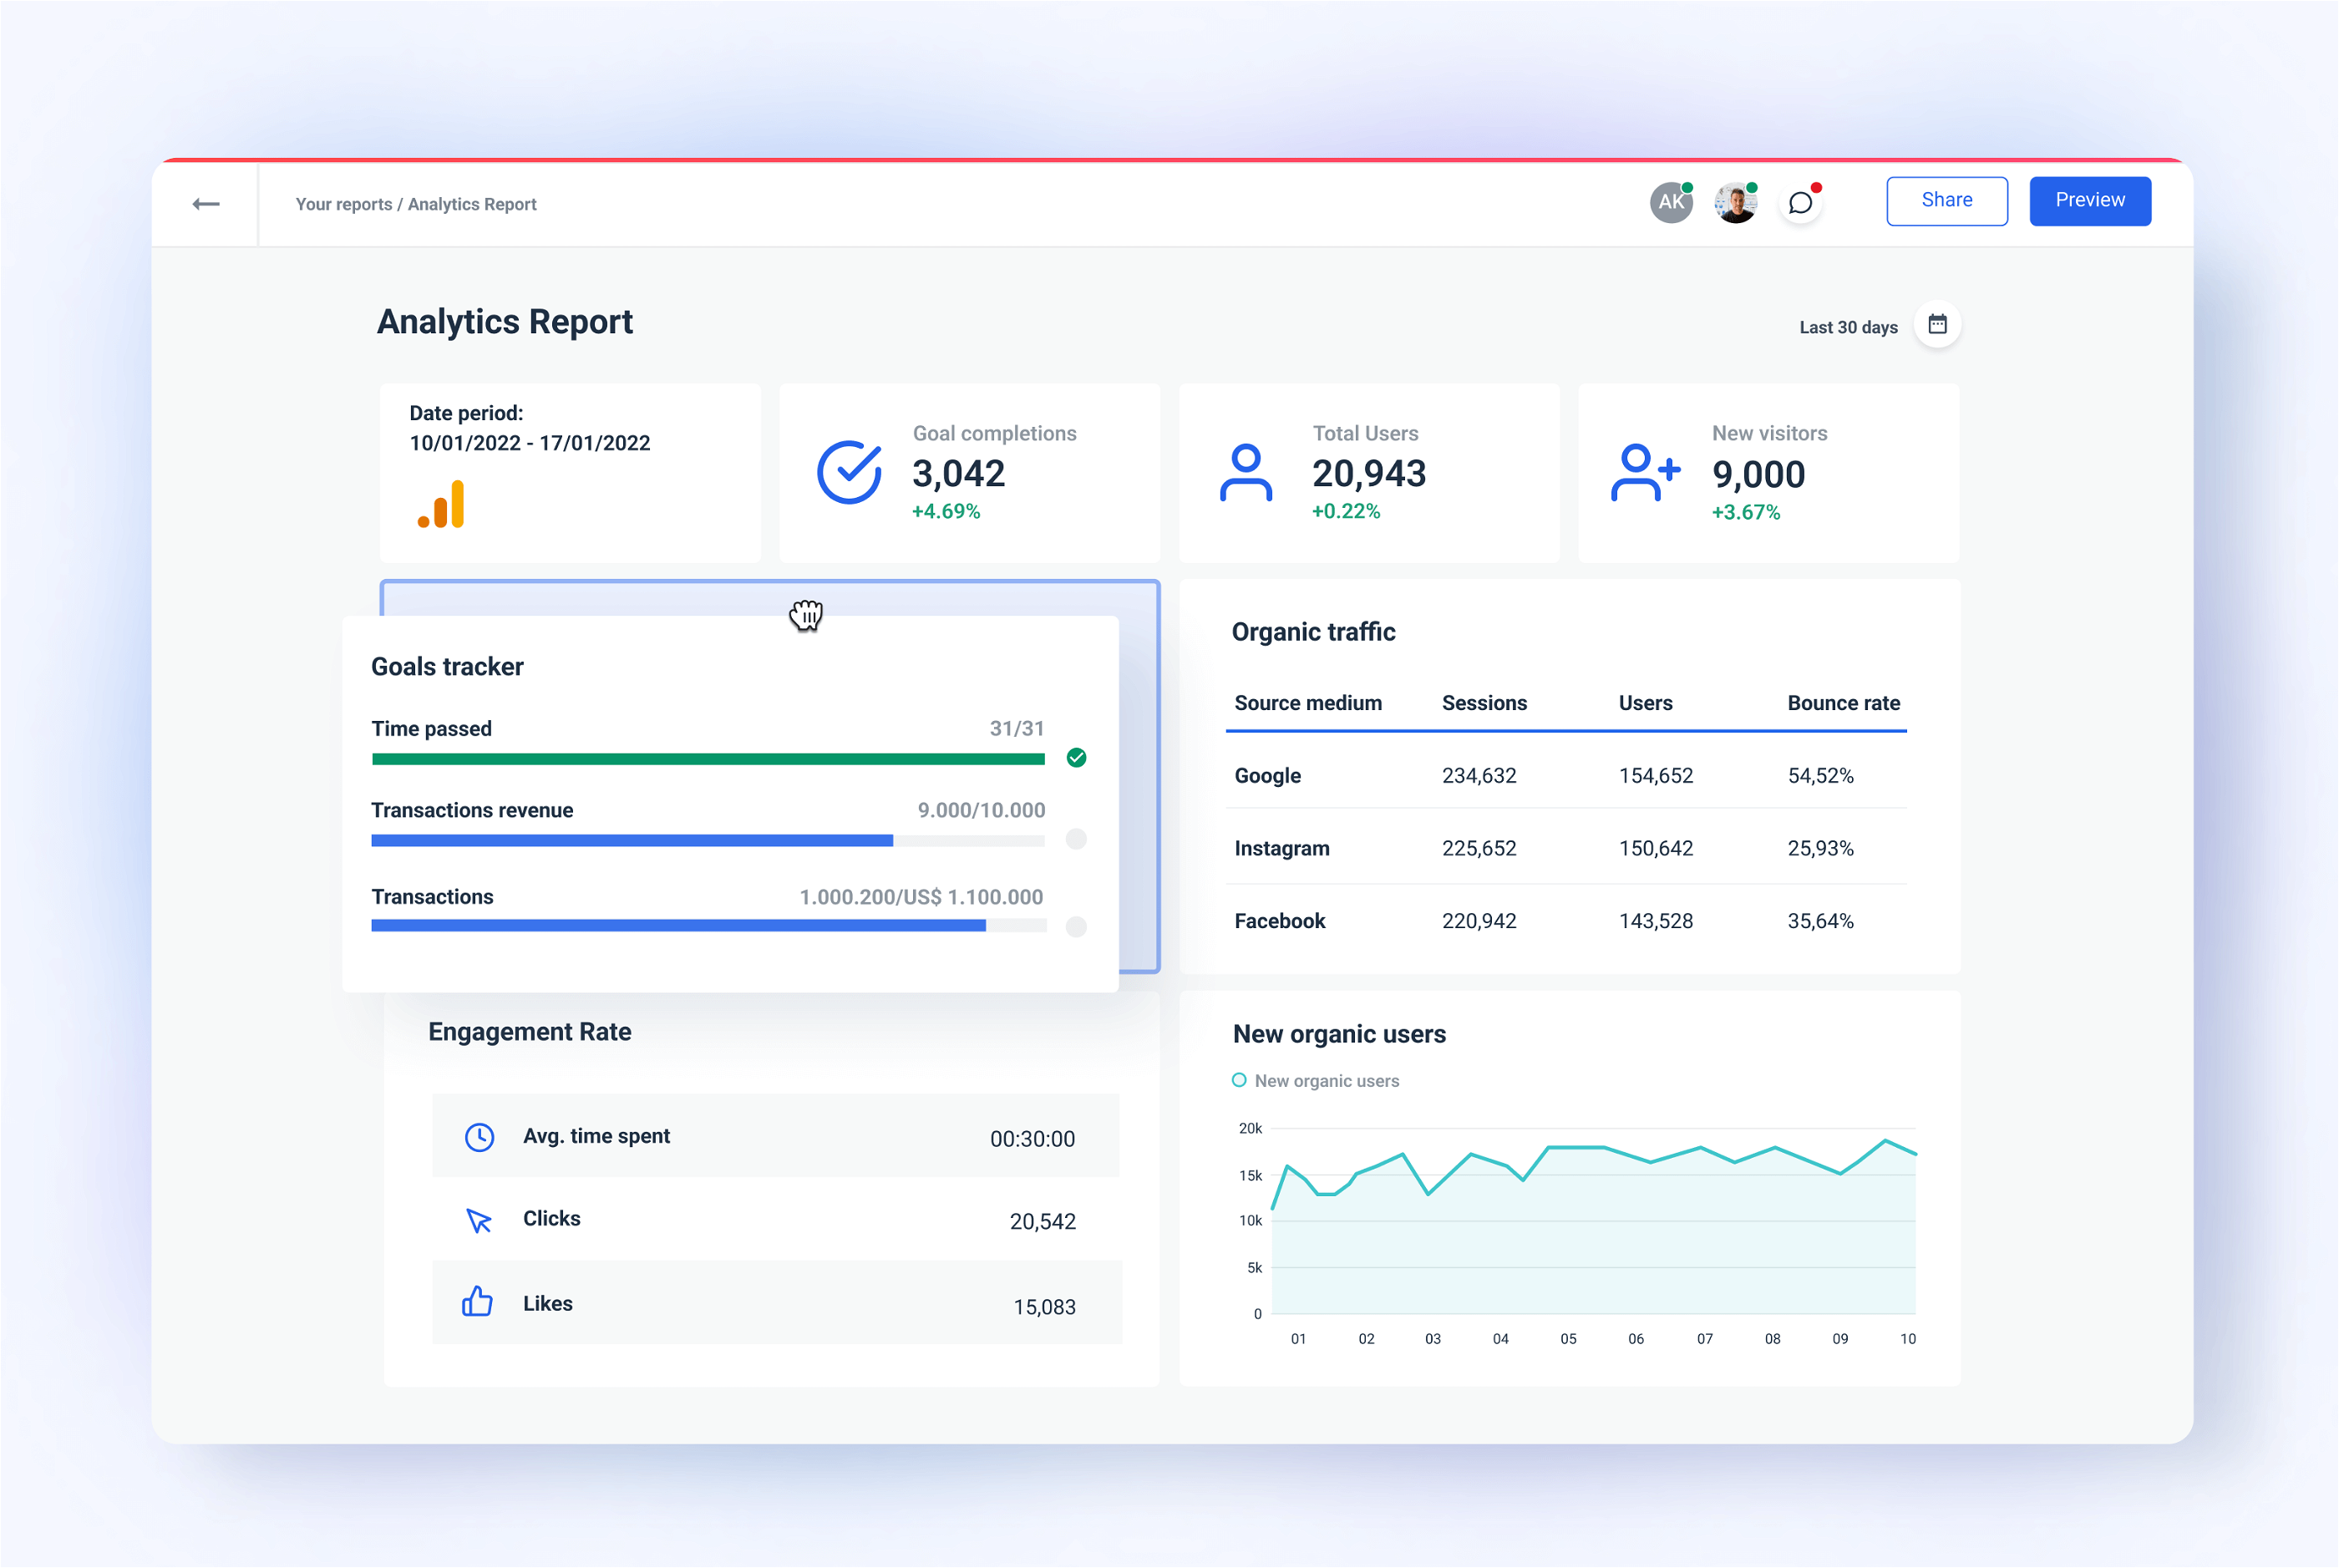
An analytical report is a written business document that companies of all sizes use to explore business opportunities, solve problems, and make more intelligent decisions. This report includes both quantitative and qualitative data to present a complete analysis of the problem.
An analytical report gives your team members:
A better understanding of business and operational activities;
Being able to view, understand, and summarize a large amount of present data about your business through different metrics and data visualization, including graphs and actionable insights;
Letting the stakeholders view online dashboards and interact with data using data visualization tools;
Decision-makers have the ability to weigh options between multiple solutions that impact their bottom line.
Analytical report examples:
Two examples of analytical reports are reports that investigate business opportunities and reports used for problem-solving. For example, a report on expanding a company’s product into an additional market and a report on why a specific product has a high return rate.
How to Write an Analytical Report?
Start writing an analytical report by identifying an issue or question you need to answer. Then, collect the relevant information and choose the format for the report. Choose visual elements that suit the type of data you will present. End the report with recommendations based on your findings.
Now that you’ve learned what an analytical report is and what it does, it’s time to start writing one. Based on your preference, you can write your informational report on a piece of paper, use Google Docs or Microsoft Word. But, manual report writing or stitching together data from Excel sheets is too time-consuming, and you may not end up getting any valuable data insights.
If you’re looking to save time and increase your efficiency, get a tool that does the job for you. Whatagraph is one of the reporting tools that make it easy to create analytical reports since it offers analytical report templates which you can use to plan your digital marketing business strategy.
Regardless of the method you choose, your analytical report should include the following:
A title page – including the main topic or purpose and the type of report
Table of contents – in a logical or chronological order
A clause – specifying and presenting the methods used for the activity
The main discussion – broken down into organized sections, including the heading, the sub-heading, and the discussion's body.
The conclusions – according to the results and information gathered in the business report
The recommendations – given by the employee who created the report
Sections for bibliography or appendices – when necessary
To write a successful analytical report, make sure you follow these instructions:
Identify the Problem
The first step to creating an analytical report is identifying the problem and the demographics affected by it. Make sure you describe the problem by including information on where it began, what techniques were used to solve it so far, and their effectiveness.
A great example of an analytical report is one of student tardiness in a selected school caused by social media. In this case, we have a clearly defined problem. We’ve determined that people affected by it are students, teachers, and parents. Then, we’ve determined the key performance indicators, Finally, we list the course of action and methodology used to fix the problem, one being a reward system, which was unsuccessful.
Explain Your Methods
Secondly, you should list the KPIs and methods you’ve used in the analysis report to determine your actions’ success. You should also add one or two new methods to try instead. For example, a report done on a failed ad campaign may reveal that the success factor was determined by surveys conducted on a sample population.
Analyze Data
Analytical reports display a detailed analysis of the information collected through the research methods employed. As you know, the report was built to sort out a specific issue and decide on alternative methods to try. So, it would help if you analyzed the success or failures of the solutions you tried in the first place.
To understand the analysis process better, imagine you’re writing an analytical report on obeying speed limits. You’re assessing and comparing the success and failure of formerly proposed solutions: constructing speed bumps, posting speed limit signs, or using police traffic stops.
Analysis of the information you’ve gathered by trying these methods can help you tell which one was the most effective for your business. You may even find out that a combination of two methods brought you the most success.
Make Recommendations
Lastly, your analytical report should include solution recommendations. And, it would help if you placed these solutions at the bottom of your report. By coming up with a few recommendations, you’ll be able to create data-based decision-making instead of guessing.
What’s the Most Important Aspect of Analytical Reporting?
Although plain data isn’t enough to solve the problem, it does provide the necessary tools to make informed decisions. Even if you don’t get the expected results, data helps you explain and justify your situation.
Simplify and automate your analytical reporting with a powerful yet intuitive reporting platform.
Request a free trial of Whatagraph and start transforming your business data into actionable visual reports and dashboards you can easily share with decision-makers.
Published on Apr 17 2020
WRITTEN BY
Gintaras BaltusevičiusGintaras is an experienced marketing professional who is always eager to explore the most up-to-date issues in data marketing. Having worked as an SEO manager at several companies, he's a valuable addition to the Whatagraph writers' pool.