10 Best Marketing Infographics
Check out this roundup of the best marketing infographics. Visually engaging and easily shareable, these infographics offer insights on social media, SEO, email marketing trends, content marketing statistics, and more!

Mar 21 2018●3 min read


- Marketing Infographics: what are they good for?
- 1. Familiarize yourself with the digital marketing trends
- 2. Understand the popularity of different marketing channels
- 3. Revise your strategy based on social media statistics
- 4. Discover the best times to post on social media
- 5. Check if your media dimensions are up to update
- 6. Learn how to get the most out of influencer marketing
- 7. Optimize your website based on SEO trends
- 8. Make sure you’re ready for the mobile takeover
- 9. Spice up your content marketing strategy with visuals
- 10. Follow best email marketing practices
- Honorable mention
- Conclusion
In today’s world, numerous physiologists and sociologists are actively discussing the condition called clip-thinking. Clip thinking refers to a fragmented information flow, which causes difficulty in perceiving the surrounding world and relationships that exist between separate objects.
Okay, in simpler terms, it’s something like when you’re reading a book and constantly have to go back to the previous sentence to make sense of the full paragraph. The words you consume are so fragmented and leave your brain so quickly, they’re unable to form into a unified piece of information.
The cause of this phenomenon is largely attributed to the rising popularity of TV and the internet. Short, snappy messages and bright visuals became the most engaging way of understanding the world around us. Naturally, it has lead to the rise of infographics. You can make awesome infographics designs using an infographic maker online suitable for all marketing jobs.
Marketing Infographics: what are they good for?
Infographics are a type of data visualization that consolidates information about a certain topic in an easy-to-understand overview using images, charts, and minimal text or a data visualization dashboard. If I had to describe infographics in one sentence, I’d say it’s the case when “one picture is worth ten thousand words.”
Because their main purpose is to make complex information easily digestible, infographics can be used by literally anyone. Marketers are no exception – we use them to promote brands we work with, but also to get insights into the ever-changing digital marketing landscape, tips, and tricks.
That’s why we combined a list of best marketing infographics that will provide you with the most relevant marketing news and statistics.
1. Familiarize yourself with the digital marketing trends
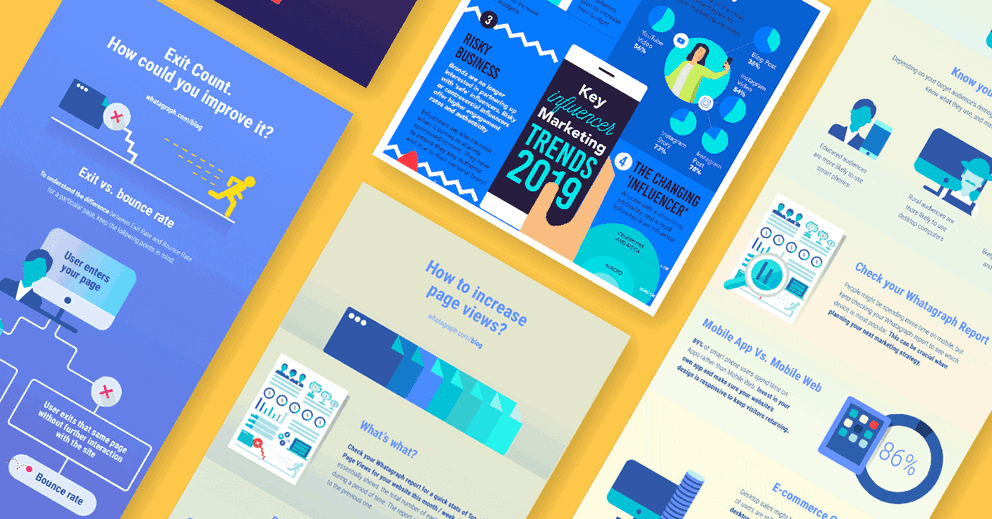
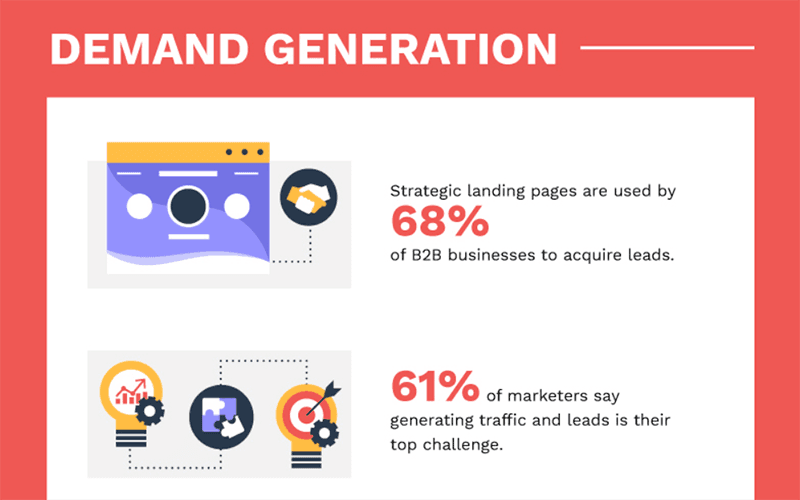
Digital marketing is constantly evolving – what used to be important and relevant yesterday might be meaningless and outdated tomorrow. To help you keep up with the ever-changing landscape, check out this excellent infographic by Devrix that will help you build successful marketing campaigns.
2. Understand the popularity of different marketing channels
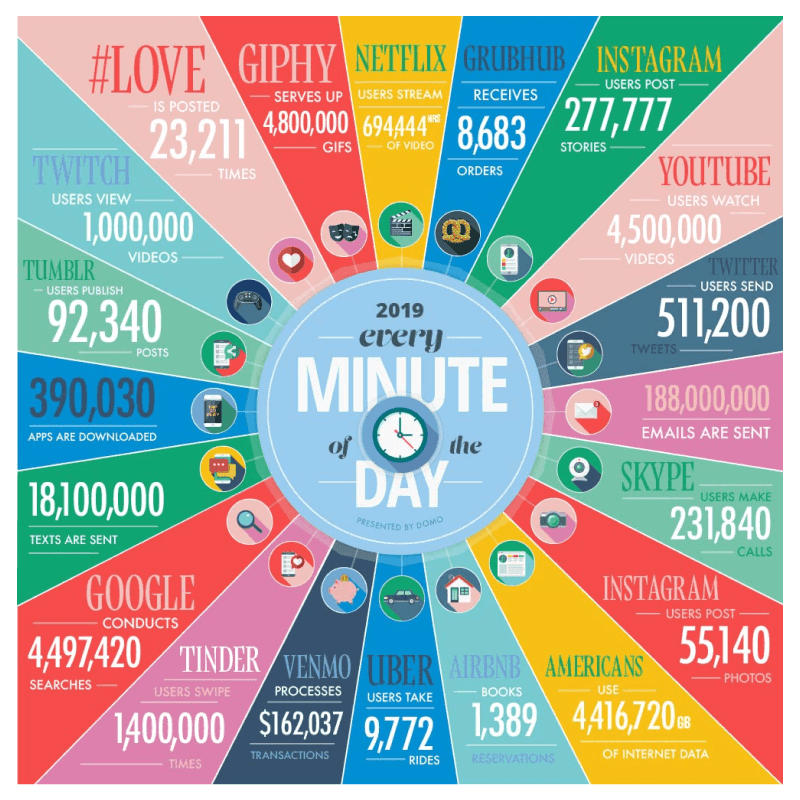
Data never sleeps! This awesome infographic by Domo gives us an in-depth look at just how much information is generated by different marketing platforms every single minute of the day. We were honestly surprised to learn there are 188 million emails sent and a whopping 4,5 million Google searches performed every minute.
3. Revise your strategy based on social media statistics
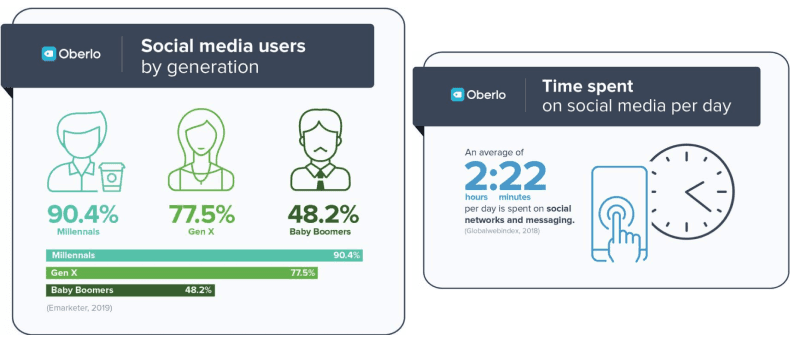
Social media is growing and changing rapidly. Not only are new platforms emerging, but user demographics and behavior change just as much. That’s why it is super important to keep track of social media statistics and revise your strategy based on their usage habits. Check out this quick infographic by Oberlo to learn more.
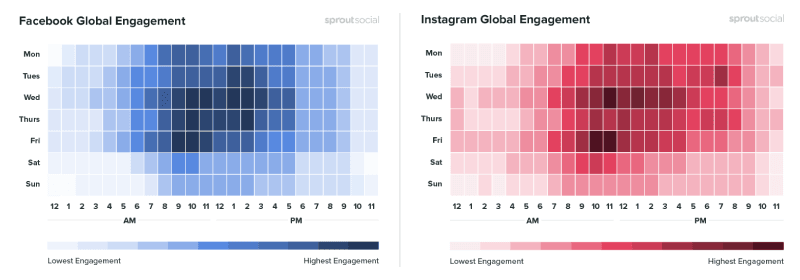
4. Discover the best times to post on social media
Since the advent of social media, marketers have been trying to figure out the magical time to post to maximize engagement, boost reach, and generate more leads. Truth is – that time is different for everyone. But it's still beneficial to know the average best time based on overall engagement, and this beautiful marketing infographic by Sprout Social lets you know just that!
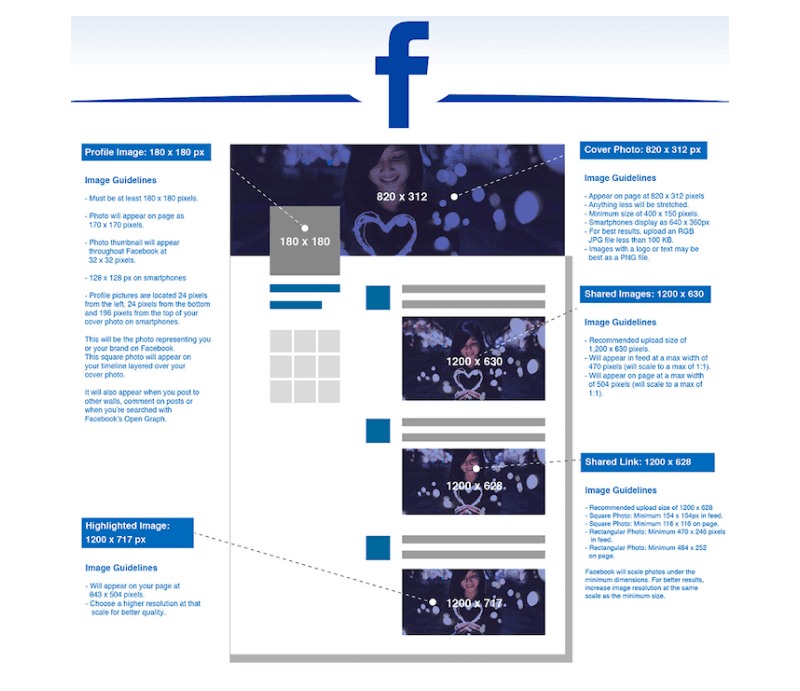
5. Check if your media dimensions are up to update
If you are not sure what size the images and videos of your social media posts should be, this infographic by Jamie Spencer of Make a Website Hub offers an amazing cheat sheet for all popular social media channels!
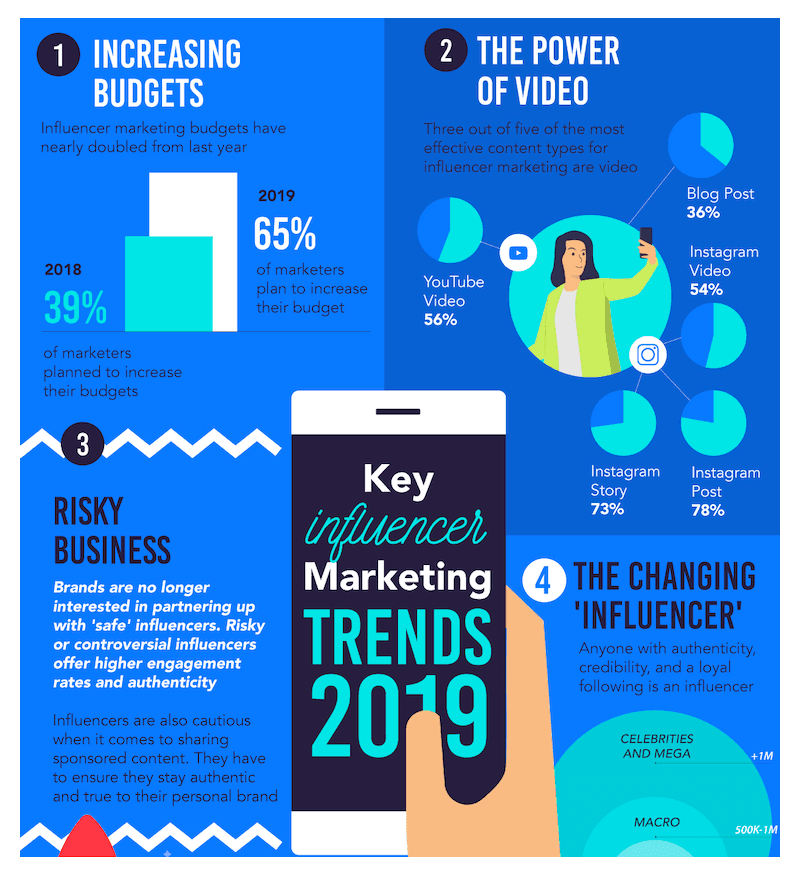
6. Learn how to get the most out of influencer marketing
Influencer marketing was booming in the past few years and it is still evolving every day. With the majority of digital marketing professionals and brands claiming they are willing to increase the budgets of influencer marketing, Visme prepared a handy infographic about the key social media influencer trends to look out for!
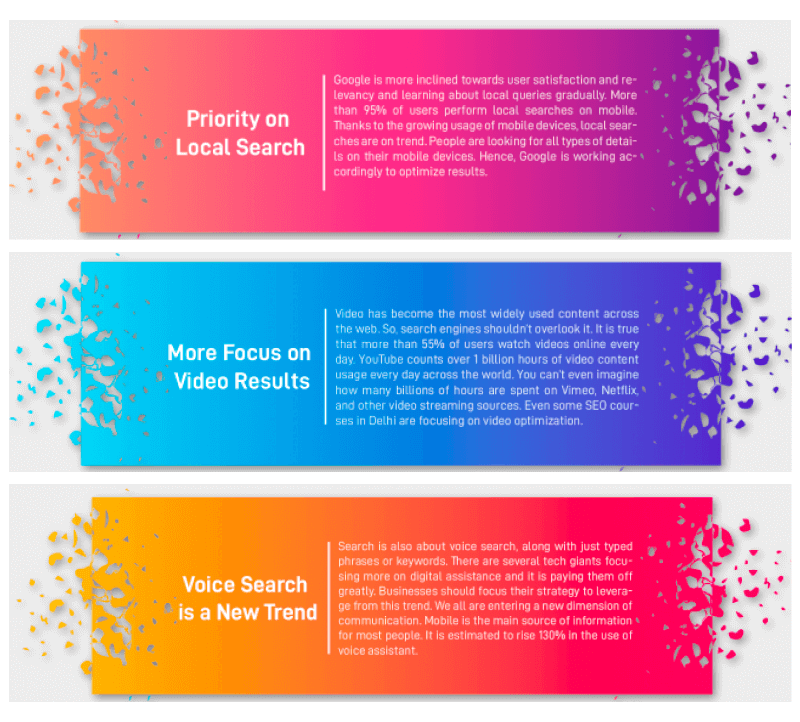
7. Optimize your website based on SEO trends
Say what you want, but the constant battle between PPC and SEO isn’t over. On the contrary, it’s getting harsher by the minute, and no one in their right mind could argue against the importance of search engine optimization.
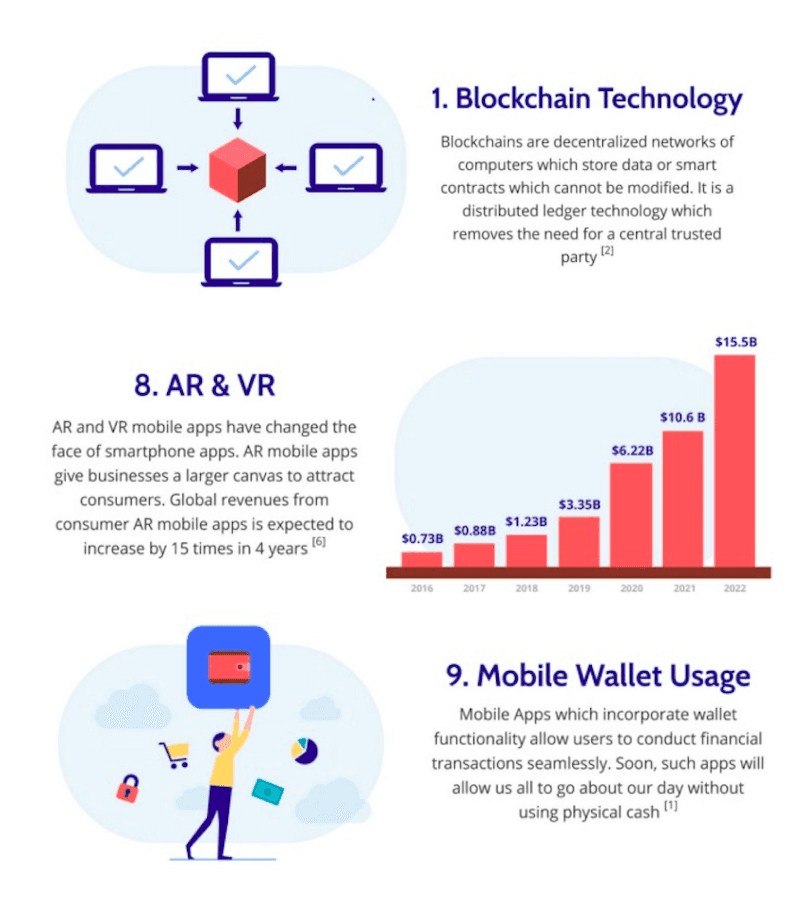
8. Make sure you’re ready for the mobile takeover
The number of actions taken on mobile phones is growing rapidly: we're no longer passively browsing, but also shopping, wiring money, voting, etc. That's why it is more important than ever to make sure your mobile presence isn't lacking and maybe even try some cool new things, like AR or VR. Check out this infographic by Robust Tech House to get even more ideas for your mobile strategy.
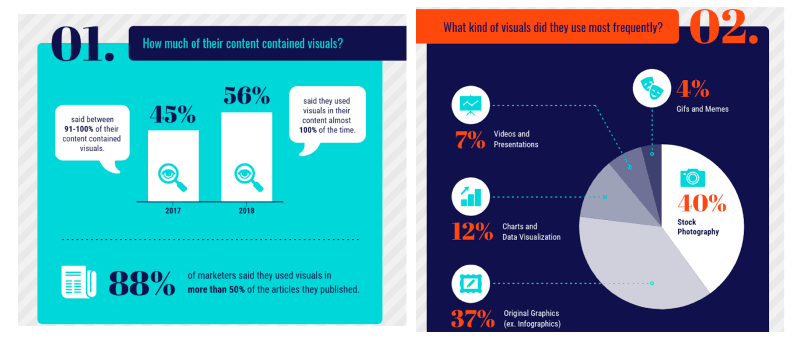
9. Spice up your content marketing strategy with visuals
Content marketing is everywhere: from social media posts to this article you’re reading right now! But those specializing in the field should know that it’s not enough to be savvy with words anymore. If you want your content to be truly shareable and engaging, you must embrace visuals. This infographic by Venngage dives right into the statistics and trends of visual content marketing.
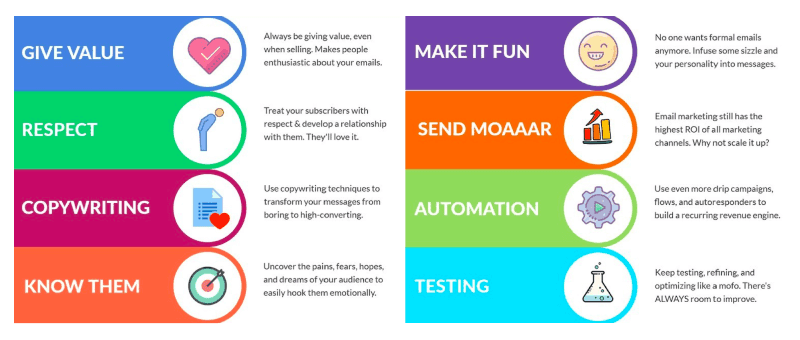
10. Follow best email marketing practices
Email marketing, the underdog of the past couple of years, is coming back full throttle this year. With segmentation and personalization at the top of the list, there are also other trends that you should hop on, like drip campaigns, auto-responders, etc. Check out this infographic by Game of Conversions and evolve your email marketing!
Honorable mention
99Firms has made an incredible infographic on the importance of Instagram stories for small business. It's a deep dive into how one can effectively apply Instagram stories in their digital marketing strategy. There are a variety of study cases too, showcasing how particular businesses leveraged Instagram stories for their benefit.
Conclusion
Infographics are a great way to present complicated information about an organization, a brand, or a general topic. Bright visuals combined with short snippets of text make still make it one of the most captivating ways of visual communication on the web.
Published on Mar 21 2018
WRITTEN BY
Nikola GemesNikola is a content marketer at Whatagraph with extensive writing experience in SaaS and tech niches. With a background in content management apps and composable architectures, it's his job to educate readers about the latest developments in the world of marketing data, data warehousing, headless architectures, and federated content platforms.