10 Most Important Call Center Metrics to Track in 2025
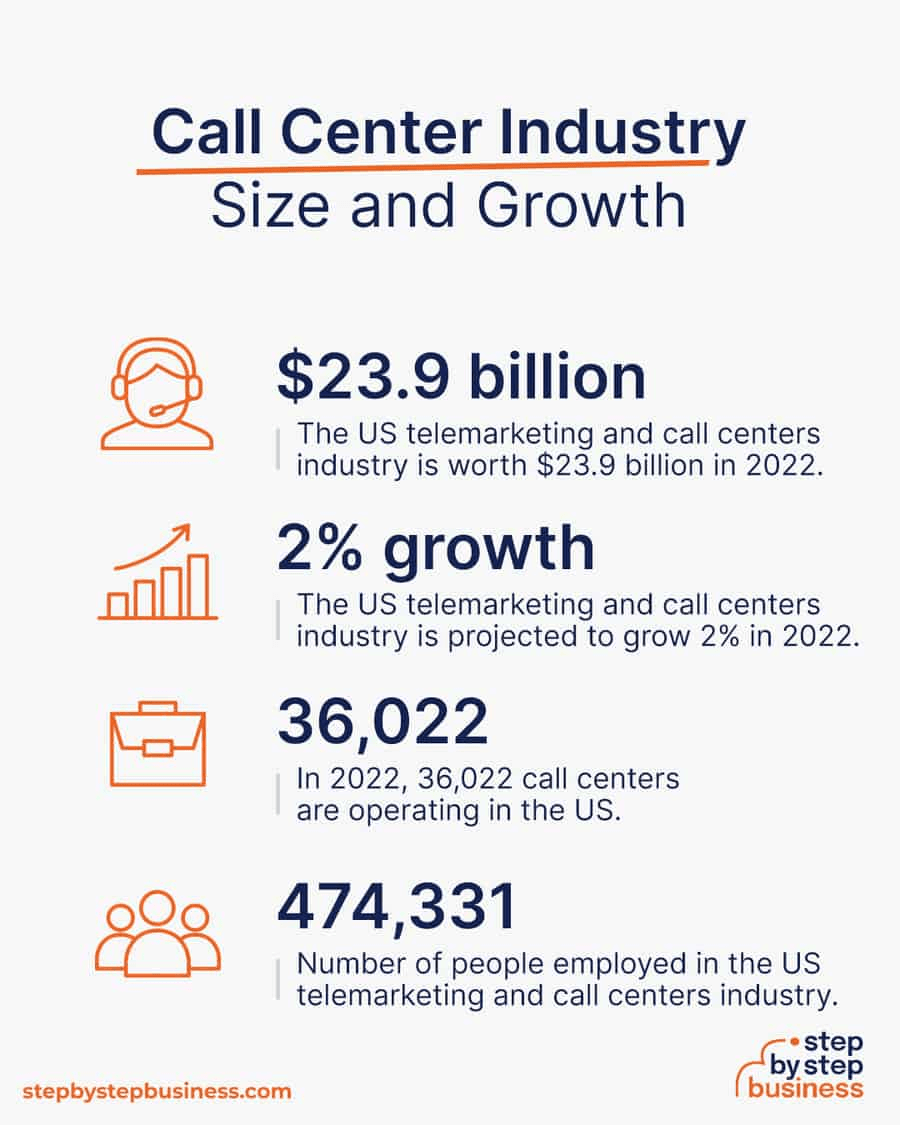
The global call center industry is huge. In fact, it was worth almost $340 billion in 2020 and is expected to grow to $496 billion by 2027. With developments in technology and working models, a call center may be the traditional type located in one building, or it could be a virtual call center with agents working from home or anywhere else.

Mar 21 2023 ● 12 min read

Whichever model your organization is using (it may even be a hybrid of the two), you need to be able to monitor and track the performance of your agents. Tracking call center metrics gives you insights into what is working and what is not. It can allow you to make informed changes to tactics and strategy. However, with so many possible call center metrics to track, what ones do you prioritize?
Choosing the right call center metrics may depend on your business type and model as well as your short and long-term objectives. That said, there are many call center metrics that managers commonly use to track performance, both of individual agents and the center as a whole. Which metrics should you be considering? We look at ten of the most important call center metrics for tracking agent performance.
The importance of tracking agent performance
One of the main things any business looks at is how good a customer experience they provide. If you operate a call center of any type or size, then your call center agents are your front-line troops. Their performance and how they deal with customers will be the main factor many people will judge your business on. Therefore, it is crucial that managers can track that performance and see how good of a customer experience is provided.
You can choose different ways of collecting data, and you will also decide on how that data will be analyzed. Modern methods of reporting deliver insights through real-time analytics, giving managers instant access to huge amounts of powerful data.
Of course, it’s not just a case of taking a snapshot of how well your agents are performing. It’s an ongoing process that can identify strengths and weaknesses and allow managers to make adjustments where needed. Call center metrics are a way of ensuring that any ongoing process gives you all the information you need to know if you are doing things well or have to make changes.
The KPIs (key performance indicators) that you use to measure your agents’ performance may vary between industries, but there are certain call center metrics that provide common insights into how well your agents are working and how good the customer experience is. By knowing which metrics best suit your center, you can ensure that good performance is maintained and even improved on.
With so much data potentially available, it can be difficult to sort the wheat from the chaff. You should have moved away from manual processes by now and adopted technology that helps you to collect and aggregate all your data. Automated tools can make data collection and analysis far easier and less complicated.
10 important call center metrics in 2025
Customer Satisfaction
How satisfied are your customers with the service you provide? Customer satisfaction scores (CSAT) are a great indicator of how well your center is performing in terms of providing good service and a good customer experience. Unlike many other call center metrics, CSATs are not collected from quantitative data from your systems but are instead a simple customer feedback system.
In most cases, CSAT is collected after a customer-agent interaction (this could be in the form of a follow-up email or other message). It is usually numerical but may also take the form of smileys and is ranked on a scale from 1 (very dissatisfied) to 5 (very satisfied). While a relatively simple metric, it is one that can give you insights into the overall performance of the agents but can also help you to identify any pain points.
You can calculate CSAT by dividing the positive responses by the total number of responses and multiplying it by 100. It is then expressed as a percentage. The call center industry standard for a good CSAT score is 75-84%.
First response time
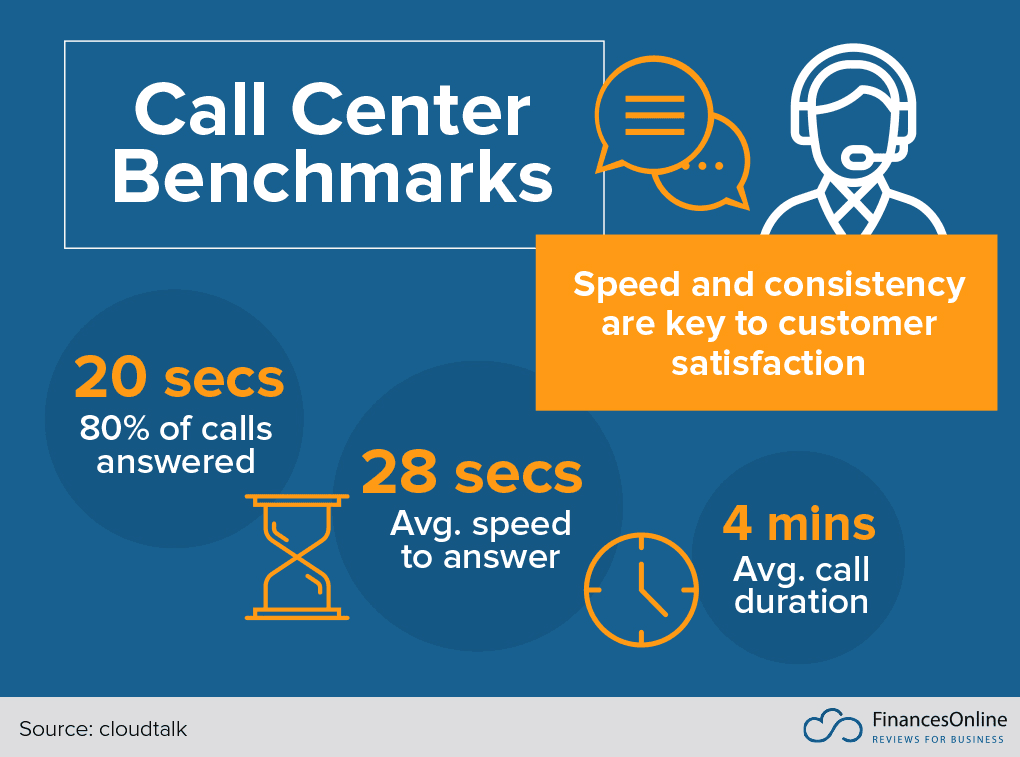
None of us like waiting in a queue for our call to be answered, even if you’re using a Canada toll free number. Of the many call center metrics, this one focuses on how quickly your agents are answering calls. While there is an industry tradition of 80/20—answering 80% of calls within 20 seconds—this is not always possible, especially at times when your lines are busy.
However, monitoring this KPI closely can help managers identify particular periods when they may be ‘understaffed’ and can allow them to adjust the scheduling of agents if needed. You also need to remember that FRT is how long it takes a customer to reach a qualified agent. You should pay special attention to routing strategies, the use of automation and IVR (interactive voice response) technology, or the ability to identify the source of an incoming call.
This is an easy metric to calculate; you simply divide the total waiting time of all calls by the total number of calls received.
Customer effort score (CES)
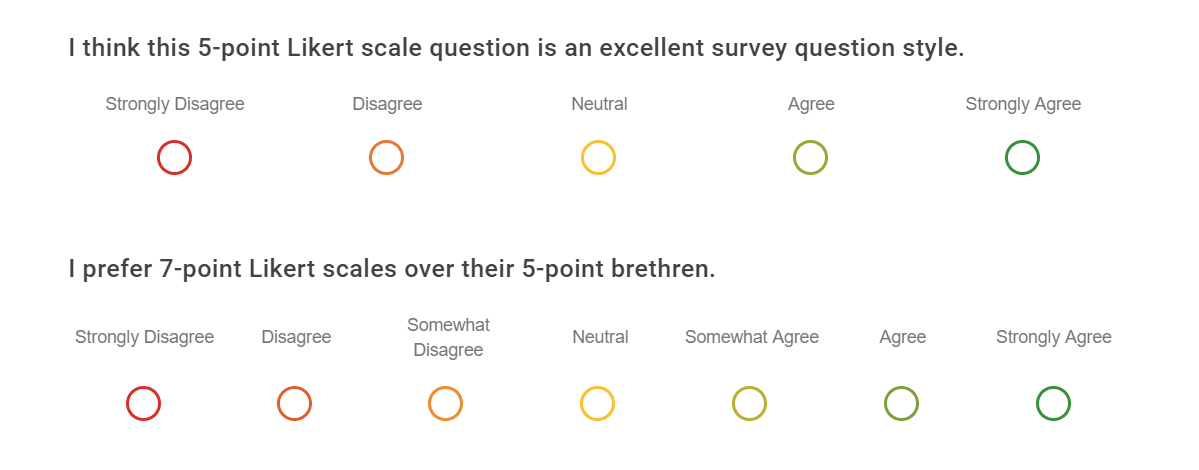
Like CSAT, this is one of the call center metrics that uses a numerical scale. It often uses 1-5 scales, but you may see 1–7 scales used too. The important thing is that the scale uses an odd number. This helps people with no strong feeling on the matter express their lack of intensity.
This metric measures how much effort a customer has had to put into resolving their problem. You can collect this data as part of any post-interaction survey, and it can be a great indicator of how good your overall customer service provision is.
The easier it is for your customers to solve any issues, the more likely that your retention rates will rise. This particular metric can allow you to make informed decisions on different aspects of your customer service, including improving the efficiency of your customer service agents. You can tailor your questions according to what you want to know. For example:
Did our agents meet all your needs and expectations?
Or
Do you feel our customer service agents made it easy to solve your issues?
Your CES is the number of customers who agree that their experience was easy divided by the total number of customers.
Net promoter score
This is another customer feedback metric often used in call centers that measures customer satisfaction. It again relies on a simple numerical scale, but this time zero to ten. The question asked is usually a simple one along the lines of “How likely are you to recommend our business to friends and family?” Zero represents never, and ten represents definitely.
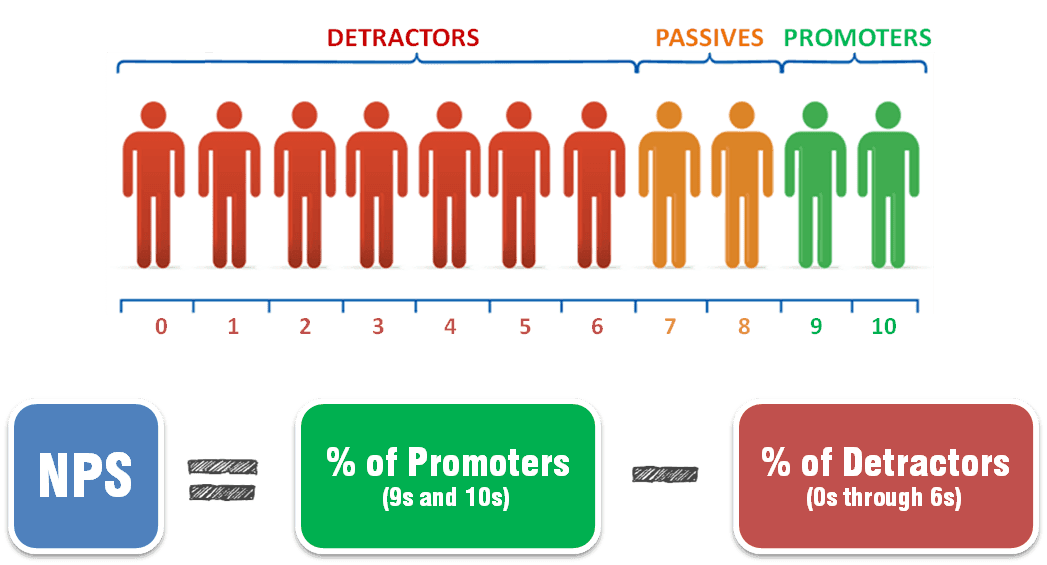
The scores are divided into three groups. Those who scored 0–6 are considered detractors - they wouldn’t recommend your company, and in fact may advise friends and family to shop elsewhere. Those scoring 7 and 8 are passives - they wouldn’t actively recommend you, but they won’t criticize you either. Scores of 9 and 10 are your promoters. It’s these promoters who can make the difference for your brand.
To calculate your net promoter score (NPS), you divide the total number of detractors by the total number of customers in the sample and then subtract that figure from your total number of promoters divided by the total number of customers in the survey.
First contact resolution
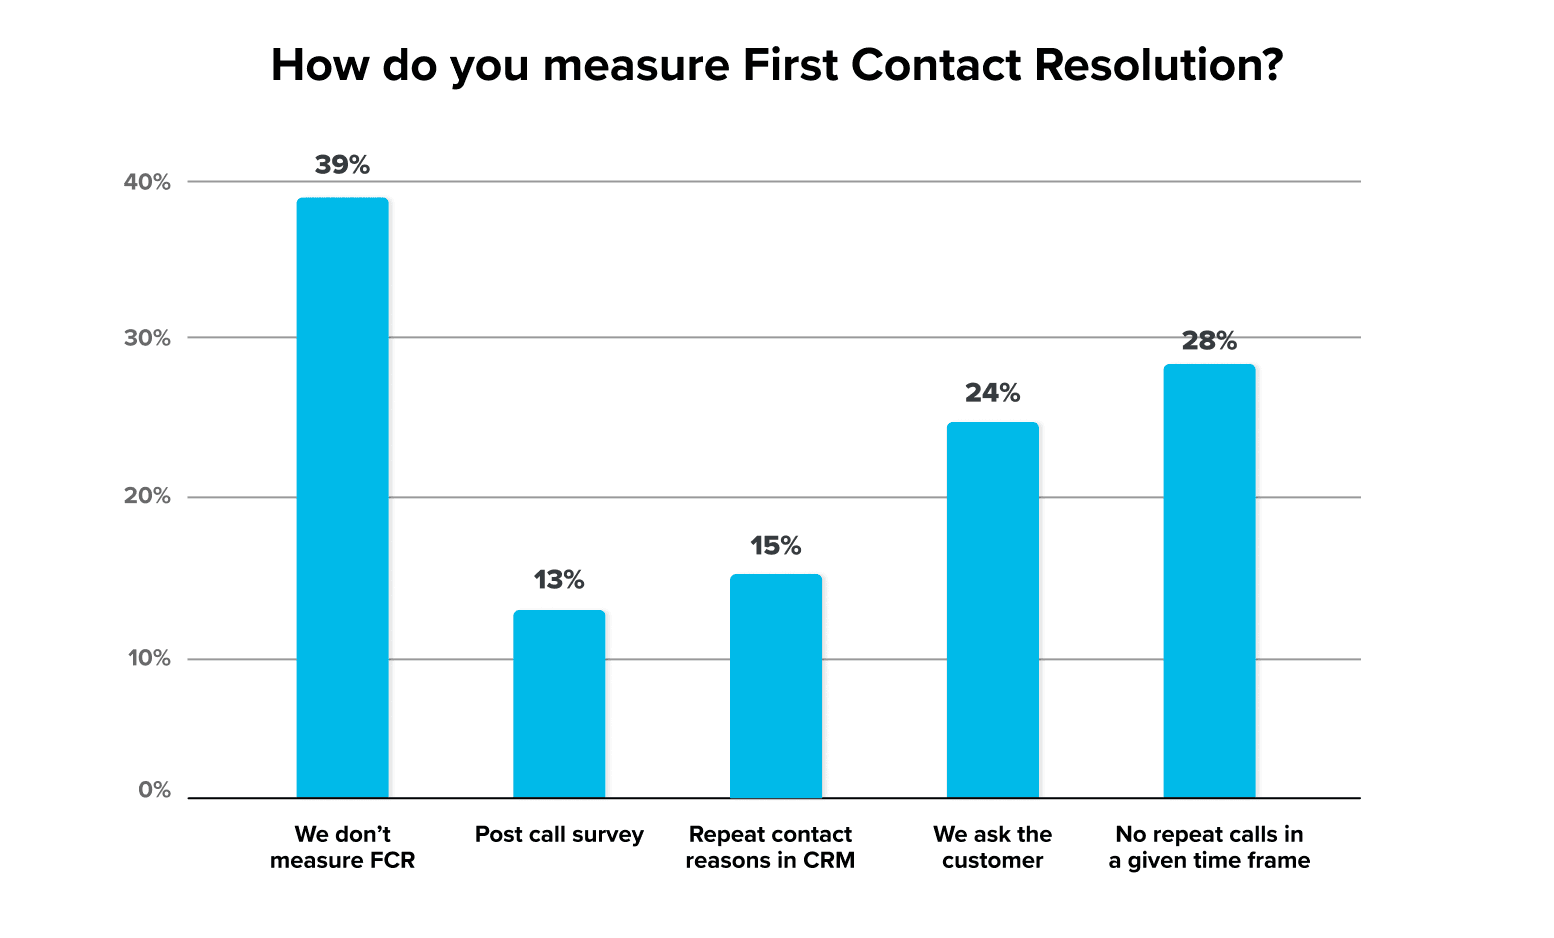
Of all the listed call center metrics, this one best reflects how skilled and efficient your agents are. First contact resolution (FCR) measures how often a customer’s query is solved within their first call to your center. After all, it can be very frustrating for customers to have to make multiple calls or be passed from agent to agent to find someone who can answer their questions or solve their problems.
When you solve an issue on a customer’s first call, then you should see better CSAT and CES scores as a consequence. It is also very useful when identifying pain points for customers or knowledge gaps for your agents. Poor FCR scores can also reflect a poor routing strategy and may be indicative of a need for better routing and processes such as IVR.
You can calculate FCR rates in one of two ways. Either all issues resolved on the first call divided by a total number of calls or the total number of issues resolved on the first call divided by the total number of first calls made.
Customer retention rate
Having a high customer retention rate (CRR) can be crucial to most businesses. A high CRR means lower customer acquisition costs (CAC) and a higher customer lifetime value (CLV). Depending on your business type and model, you may choose to measure CRR over different time periods, including quarterly or annually.
CRR is another call center metric that reflects your agents’ performance. When your agents can solve problems and help customers, then those customers are far more likely to overlook any issues with their experience. In fact, 78% of customers will keep using a company after a mistake if the customer service is good.
To calculate CRR, you look at your chosen time period, subtract any new customers from your total number of customers, divide that number by how many customers you had at the start of any period then multiply by 100%.
Schedule adherence
Tracking this metric can show you how much time your agents are spending on customer calls. A low adherence rate can adversely affect your abandoned and missed call rates which can have a knock-on effect and lead to lower customer satisfaction rates and net promoter scores (NPS).
To calculate this metric, add the number of hours an agent spent handling calls to their total available time, divide it by their paid hours, and multiply by 100%.
Average handle time
Of course, some calls may take longer to resolve than others but you should monitor average handle time (AHT) as one of your list of call center metrics. This gives you an insight into whether agents are spending too long on calls. It represents an average of how long an agent spends on each call. It can help you set team targets and identify any agents that need further training if their AHT is too high above your target.
Of course, call centers serve a wide range of purposes, and their work often comes from external sources. For example, you may be carrying out marketing calls for another organization and may need some form of automated reporting to aid in data collection.
To calculate average hold time, add together an agent’s total time talking to their time on hold to the time of any work needed in relation to that call, then divide it by their total number of calls taken.
Average after-call work time
Many people think that the only work involved in a call is that which takes place during the call. The reality is that in some cases, the agent may have to spend some time dealing with issues raised in the call, even when the customer has been disconnected. This can include tasks such as data input, filing any paperwork, or even discussing the case with a manager.
To work out average after-call work time, you need to calculate the total time spent on after-call tasks in a given period. You then divide that time by the total number of calls handled by that agent in the same period. You should include both outbound and inbound calls, but you can separate them to calculate separate results.
Service level
Some call center metrics look at individual agent performance, but this KPI can indicate the overall performance of your center. Different industries may set their service level differently, but a common factor is often cost efficiency. A good service level may be achieved in a number of ways, including tech and automation, advanced training, and so on.
There are a few ways to calculate this metric, but the most simple is to divide the number of calls answered within a predetermined number of seconds by the number of calls offered, then multiply by 100.
Conclusion
Call center metrics can offer great insights into different levels of performance, from individual agents to teams to the center as a whole. It’s recommended that you use call monitoring software that serves your needs and gathers together and reports on pertinent data. This can help call center managers identify areas where performance can be improved.
There is no such thing as perfect performance, but you can constantly strive to improve. That can include new employee onboarding, extra training for existing employees, or identifying new processes, tools, or tech that can help your agents perform better. Prioritizing which call center metrics matter most to you and reviewing them regularly can make your call center even better. Whatagraph’s call monitoring software can deliver all your daily data needs in one report - check out what it can do for you today.
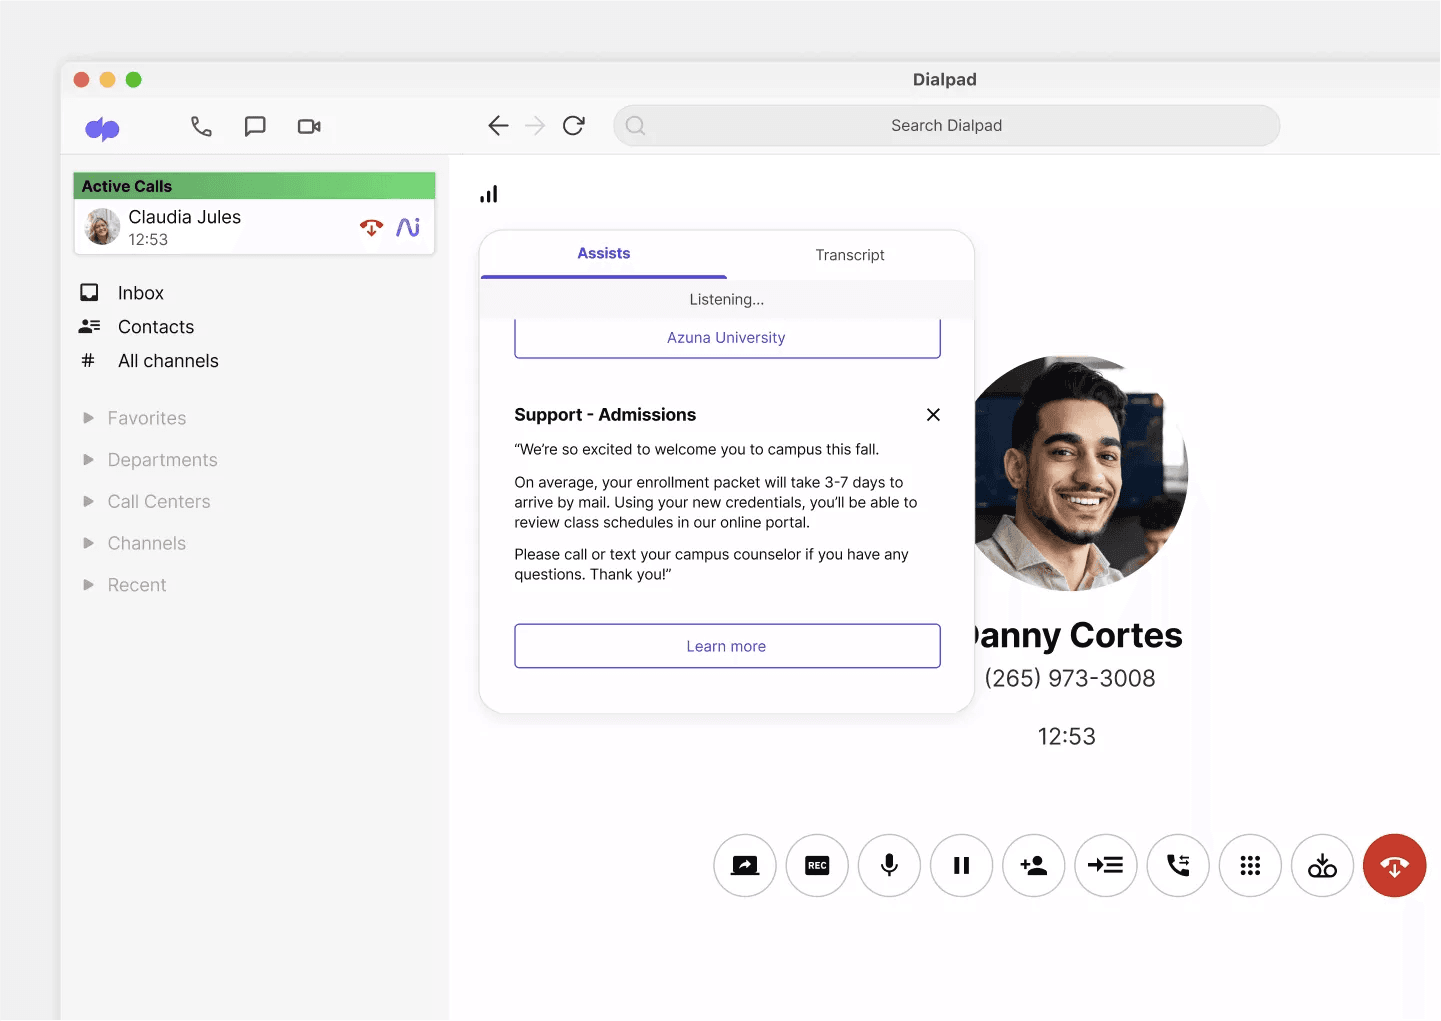
Author: Austin Guanzon - Tier 1 Support Manager, Dialpad
Austin Guanzon is the Tier 1 Support Manager for Dialpad, business phone system and leading AI-powered customer intelligence platform. He is a customer retention and technical support expert, with experience at some of the largest tech service companies in the US. Austin is also the co-founder of the California-based Infinity Martial Arts and has served as an instructor in the sport. You can find him on LinkedIn.
Published on Mar 21 2023
WRITTEN BY
Mile ZivkovicMile is the ex-Head of Content at Whatagraph. A marketing heavy with almost a decade of SaaS industry experience, Mile has managed multiple content marketing teams without losing an ounce of his writing passion.