Content Marketing Dashboard and Metrics
What exactly do you need to do, to show your superiors that content marketing is worth their time and their money? Enters content marketing dashboard.

Apr 04 2020●2 min read


What is Content Marketing Dashboard?
Like any other dashboard, the role of a content marketing dashboard is to provide relevant information about the effectiveness of content marketing campaigns and the return of investment (ROI).
However, it takes a lot of careful planning for your dashboard to convey just the right information for the c-suite.
Key Metrics and Their Role
The difference between a good and bad content marketing dashboard is, of course, its metrics and how they are displayed. Avoid the unnecessary and focus on KPIs to paint a clear picture for your superiors. In this case, KPIs are the following:
- Impressions/Conversion - How many times your ads are displayed and what percentage of those successfully brings users to your website;
- Referral traffic - Number of visits that comes from inbound links;
- Organic traffic - Number of visits that happen organically, and thus it reveals the effectiveness of your SEO campaign;
- Sales - Number of sales made online;
- Virality - Number of shares your content gets across social media platforms;
- Bounce rate - Number of users who immediately left the website, a useful metric as it shows whether you are targeting a wrong user group, through referral or social media marketing.
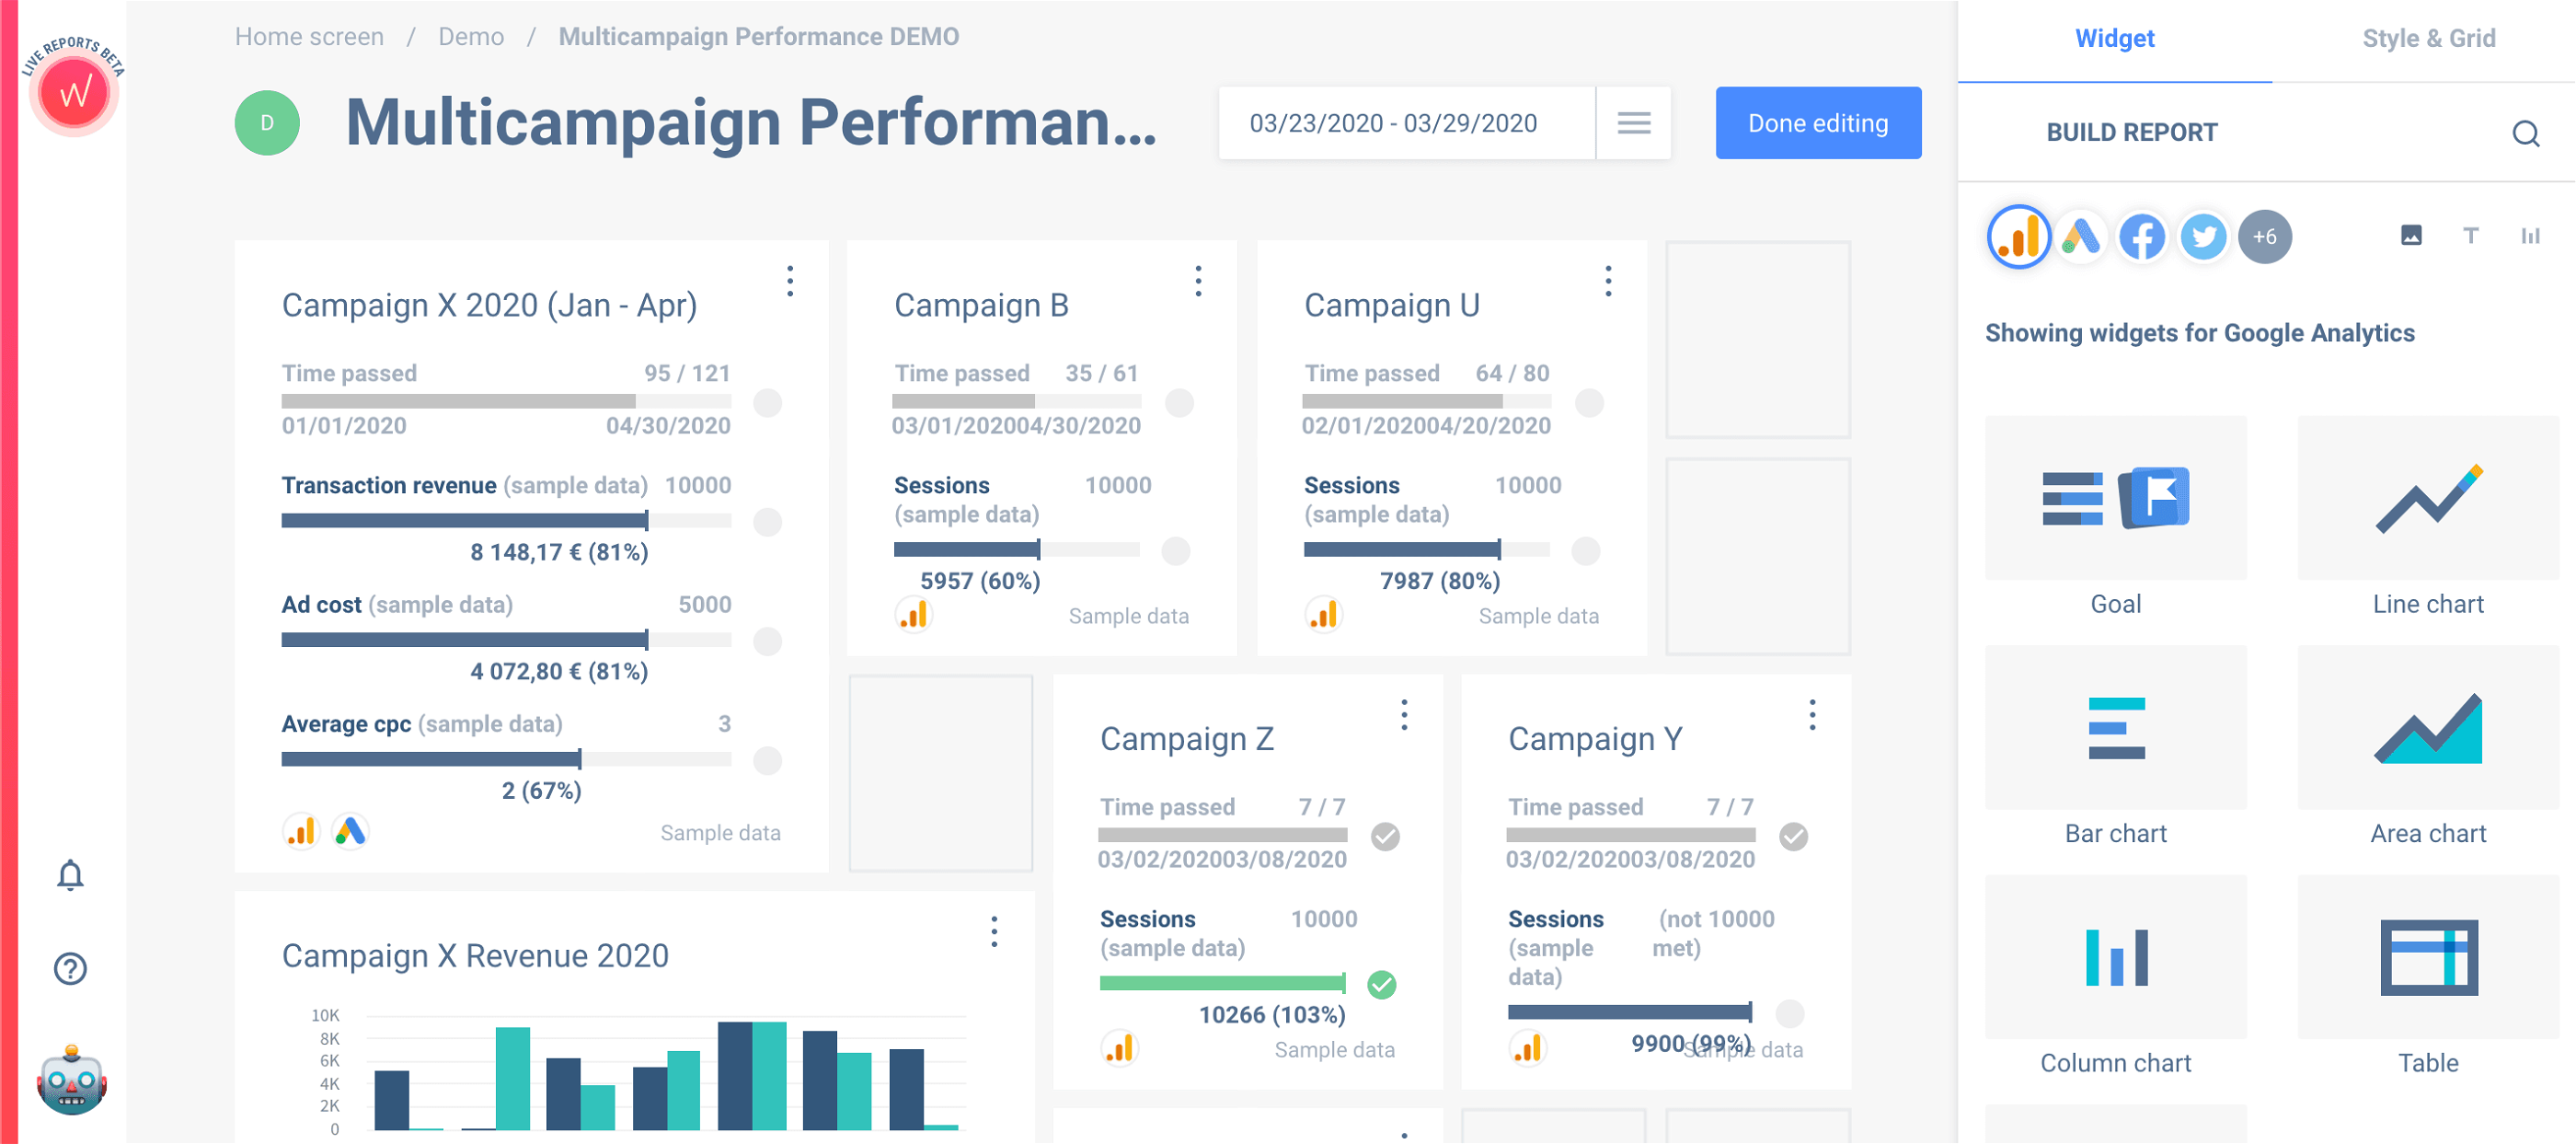
Below is the Whatagraph live reporting solution for your campaigns.
The feedback on these key points will guide future content strategy, and even identify the gaps in the current approach. It can help companies in deciding which content marketing efforts need to be adjusted or discontinued.
It reveals where the core engagement centers are located, which might suggest to focus or double down your efforts in that area. You can identify the time of day when your ads make the most impact, or when your core audience is browsing the web via PC or phone.
Quality ROI is all about maximizing or getting the most out of your investment, and an insightful content marketing dashboard is charting the course towards that goal.
How to Conceptualize
Having raw data is one thing while representing that data in a digestible way is something else entirely.
Luckily, there are multiple data visualization techniques that you can use to showcase the most relevant takeaways from data analysis, and as a result, create a satisfying content marketing dashboard.
Using different graphs, charts, or maps you can easily capture the most important indicators that assets are either performing positively or negatively.
The information should peak the interest of the c-suite desk to closely examine the process of how those metrics were derived.
Tools
Creating quality content marketing may seem daunting but with the right tools, even the most complicated tasks can be streamlined.
Whatagraph is a very useful tool that can aid you in this endeavor. Thanks to its integration and import feature you eliminate the need to input data manually, and the wide variety of features will allow you to seamlessly organize big chunks of information into concise data points.
You can even create interactive content marketing reports. Lastly, the tool allows you to white-label these reports designs and therefore your brand name and logo will appear on the materials reviewed by the c-suite team.
Published on Apr 04 2020
WRITTEN BY
Gintaras BaltusevičiusGintaras is an experienced marketing professional who is always eager to explore the most up-to-date issues in data marketing. Having worked as an SEO manager at several companies, he's a valuable addition to the Whatagraph writers' pool.