Data Interpretation: Definition, Method, Benefits & Examples
In today's digital world, any business owner understands the importance of collecting, analyzing, and interpreting data. Some statistical methods are always employed in this process. Continue reading to learn how to make the most of your data.

Apr 20 2021 ● 7 min read

What is Data Interpretation?
Syracuse University defined data interpretation as the process of assigning meaning to the collected information and determining the conclusions, significance, and implications of the findings. In other words, normalizing data, aka giving meaning to the collected 'cleaned' raw data.
Data Interpretation Examples
Data interpretation is the final step of data analysis. This is where you turn results into actionable items. To better understand it, here are 2 instances of interpreting data:
Let's say you've got four age groups of the user base. So a company can notice which age group is most engaged with their content or product. Based on bar charts or pie charts, they can either: develop a marketing strategy to make their product more appealing to non-involved groups or develop an outreach strategy that expands on their core user base. Before building a document management system, businesses would conduct data interpretation as part of their market research. This analysis provides insights into user pain points while handling large numbers of documents, determine user accessibility preferences - mobile or desktop, and discover the most desired features. These insights inform data-driven decisions on product features, system versions, and security controls for their future software.
Another case of data interpretation is how companies use recruitment CRM. They use it to source, track, and manage their entire hiring pipeline to see how they can automate their workflow better. This helps companies save time and improve productivity.
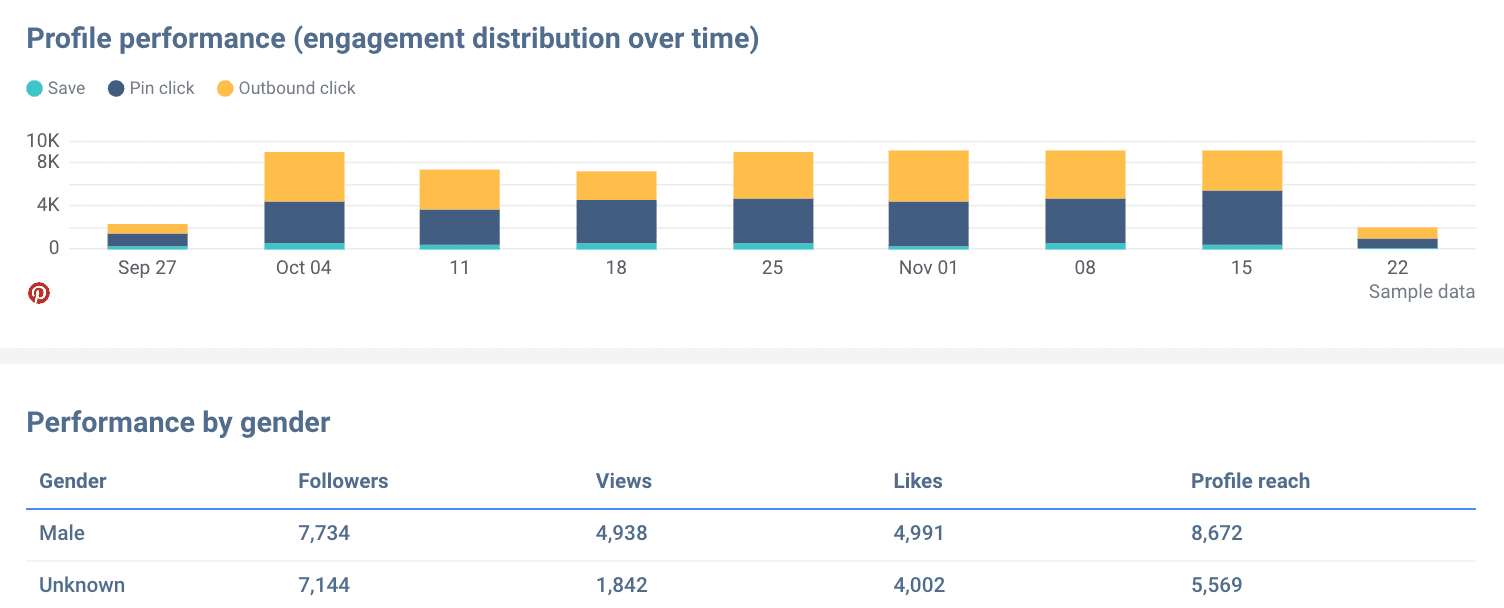
Interpreting data: Performance by gender
Steps Of Data Interpretation
Data interpretation is conducted in 4 steps:
- Assembling the information you need (like bar graphs and pie charts);
- Developing findings or isolating the most relevant inputs;
- Developing conclusions;
- Coming up with recommendations or actionable solutions.
Considering how these findings dictate the course of action, data analysts must be accurate with their conclusions and examine the raw data from multiple angles. Different variables may allude to various problems, so having the ability to backtrack data and repeat the analysis using different templates is an integral part of a successful business strategy.
What Should Users Question During Data Interpretation?
To interpret data accurately, users should be aware of potential pitfalls present within this process. You need to ask yourself if you are mistaking correlation for causation. If two things occur together, it does not indicate that one caused the other.
The 2nd thing you need to be aware of is your own confirmation bias. This occurs when you try to prove a point or a theory and focus only on the patterns or findings that support that theory while discarding those that do not.
The 3rd problem is irrelevant data. To be specific, you need to make sure that the data you have collected and analyzed is relevant to the problem you are trying to solve.
Data Interpretation Methods
Data analysts or data analytics tools help people make sense of the numerical data that has been aggregated, transformed, and displayed. There are two main methods for data interpretation: quantitative and qualitative.
Qualitative Data Interpretation Method
This is a method for breaking down or analyzing so-called qualitative data, also known as categorical data. It is important to note that no bar graphs or line charts are used in this method. Instead, they rely on text. Because qualitative data is collected through person-to-person techniques, it isn't easy to present using a numerical approach.
Surveys are used to collect data because they allow you to assign numerical values to answers, making them easier to analyze. If we rely solely on the text, it would be a time-consuming and error-prone process. This is why it must be transformed.
Quantitative Data Interpretation Method
This data interpretation is applied when we are dealing with quantitative or numerical data. Since we are dealing with numbers, the values can be displayed in a bar chart or pie chart. There are two main types: Discrete and Continuous. Moreover, numbers are easier to analyze since they involve statistical modeling techniques like mean and standard deviation.
Mean is an average value of a particular data set obtained or calculated by dividing the sum of the values within that data set by the number of values within that same set.
Standard Deviation is a technique is used to ascertain how responses align with or deviate from the average value or mean. It relies on the meaning to describe the consistency of the replies within a particular data set. You can use this when calculating the average pay for a certain profession and then displaying the upper and lower values in the data set.
As stated, some tools can do this automatically, especially when it comes to quantitative data. Whatagraph is one such tool as it can aggregate data from multiple sources using different system integrations. It will also automatically organize and analyze that which will later be displayed in pie charts, line charts, or bar charts, however you wish.
Benefits Of Data Interpretation
Multiple data interpretation benefits explain its significance within the corporate world, medical industry, and financial industry:
Informed decision-making. The managing board must examine the data to take action and implement new methods. This emphasizes the significance of well-analyzed data as well as a well-structured data collection process. 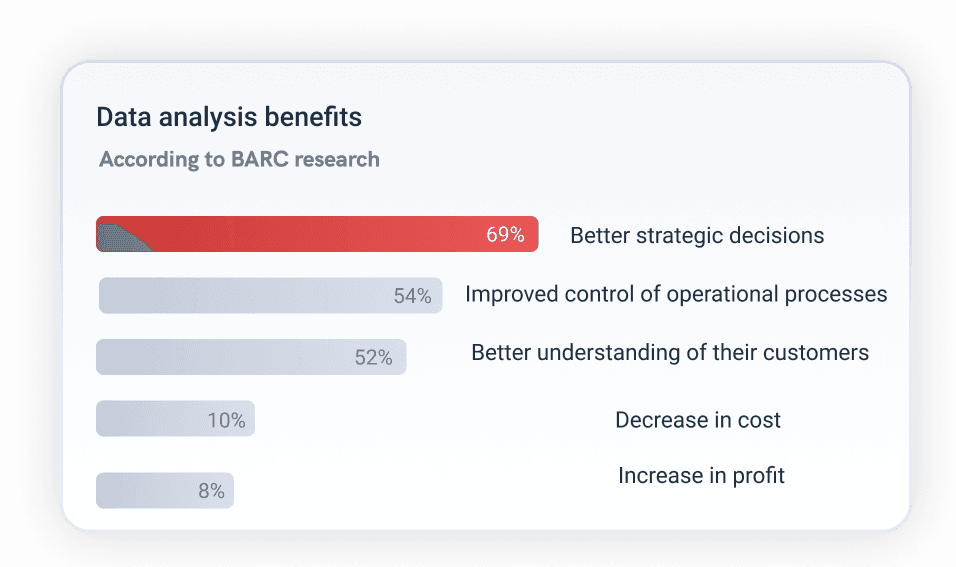
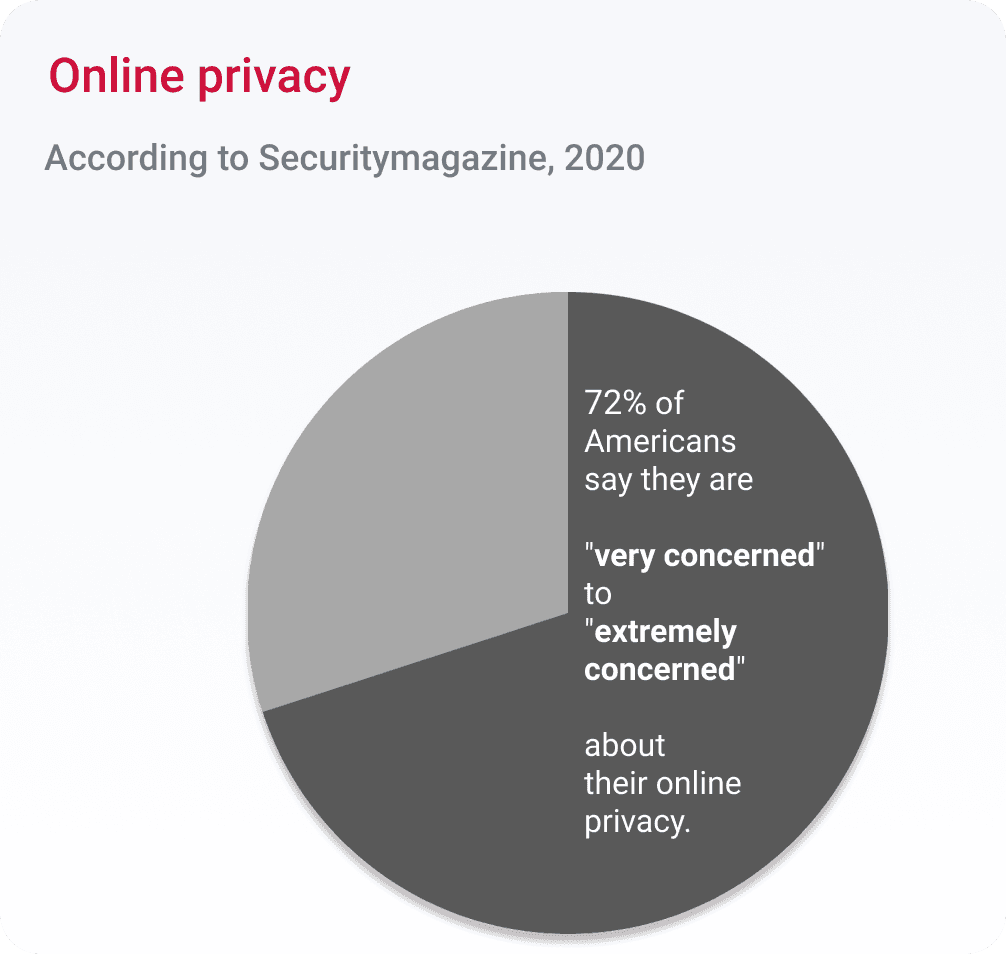
Anticipating needs and identifying trends. Data analysis provides users with relevant insights that they can use to forecast trends. It would be based on customer concerns and expectations.
For example, a large number of people are concerned about privacy and the leakage of personal information. Products that provide greater protection and anonymity are more likely to become popular.
Clear foresight. Companies that analyze and aggregate data better understand their own performance and how consumers perceive them. This provides them with a better understanding of their shortcomings, allowing them to work on solutions that will significantly improve their performance.
Published on Apr 20 2021
WRITTEN BY
Indrė Jankutė-CarmaciuIndrė is a copywriter at Whatagraph with extensive experience in search engine optimization and public relations. She holds a degree in International Relations, while her professional background includes different marketing and advertising niches. She manages to merge marketing strategy and public speaking while educating readers on how to automate their businesses.