Dynamic Reports vs. Static Reports – Which Is Better?
Static and dynamic reports are indisputably the best ways to present and analyze valuable business data.

Apr 17 2020●4 min read


Access to relevant business data is key to making important commercial decisions, no matter the sector or niche. And, using the right report tool allows you to handle it effectively.
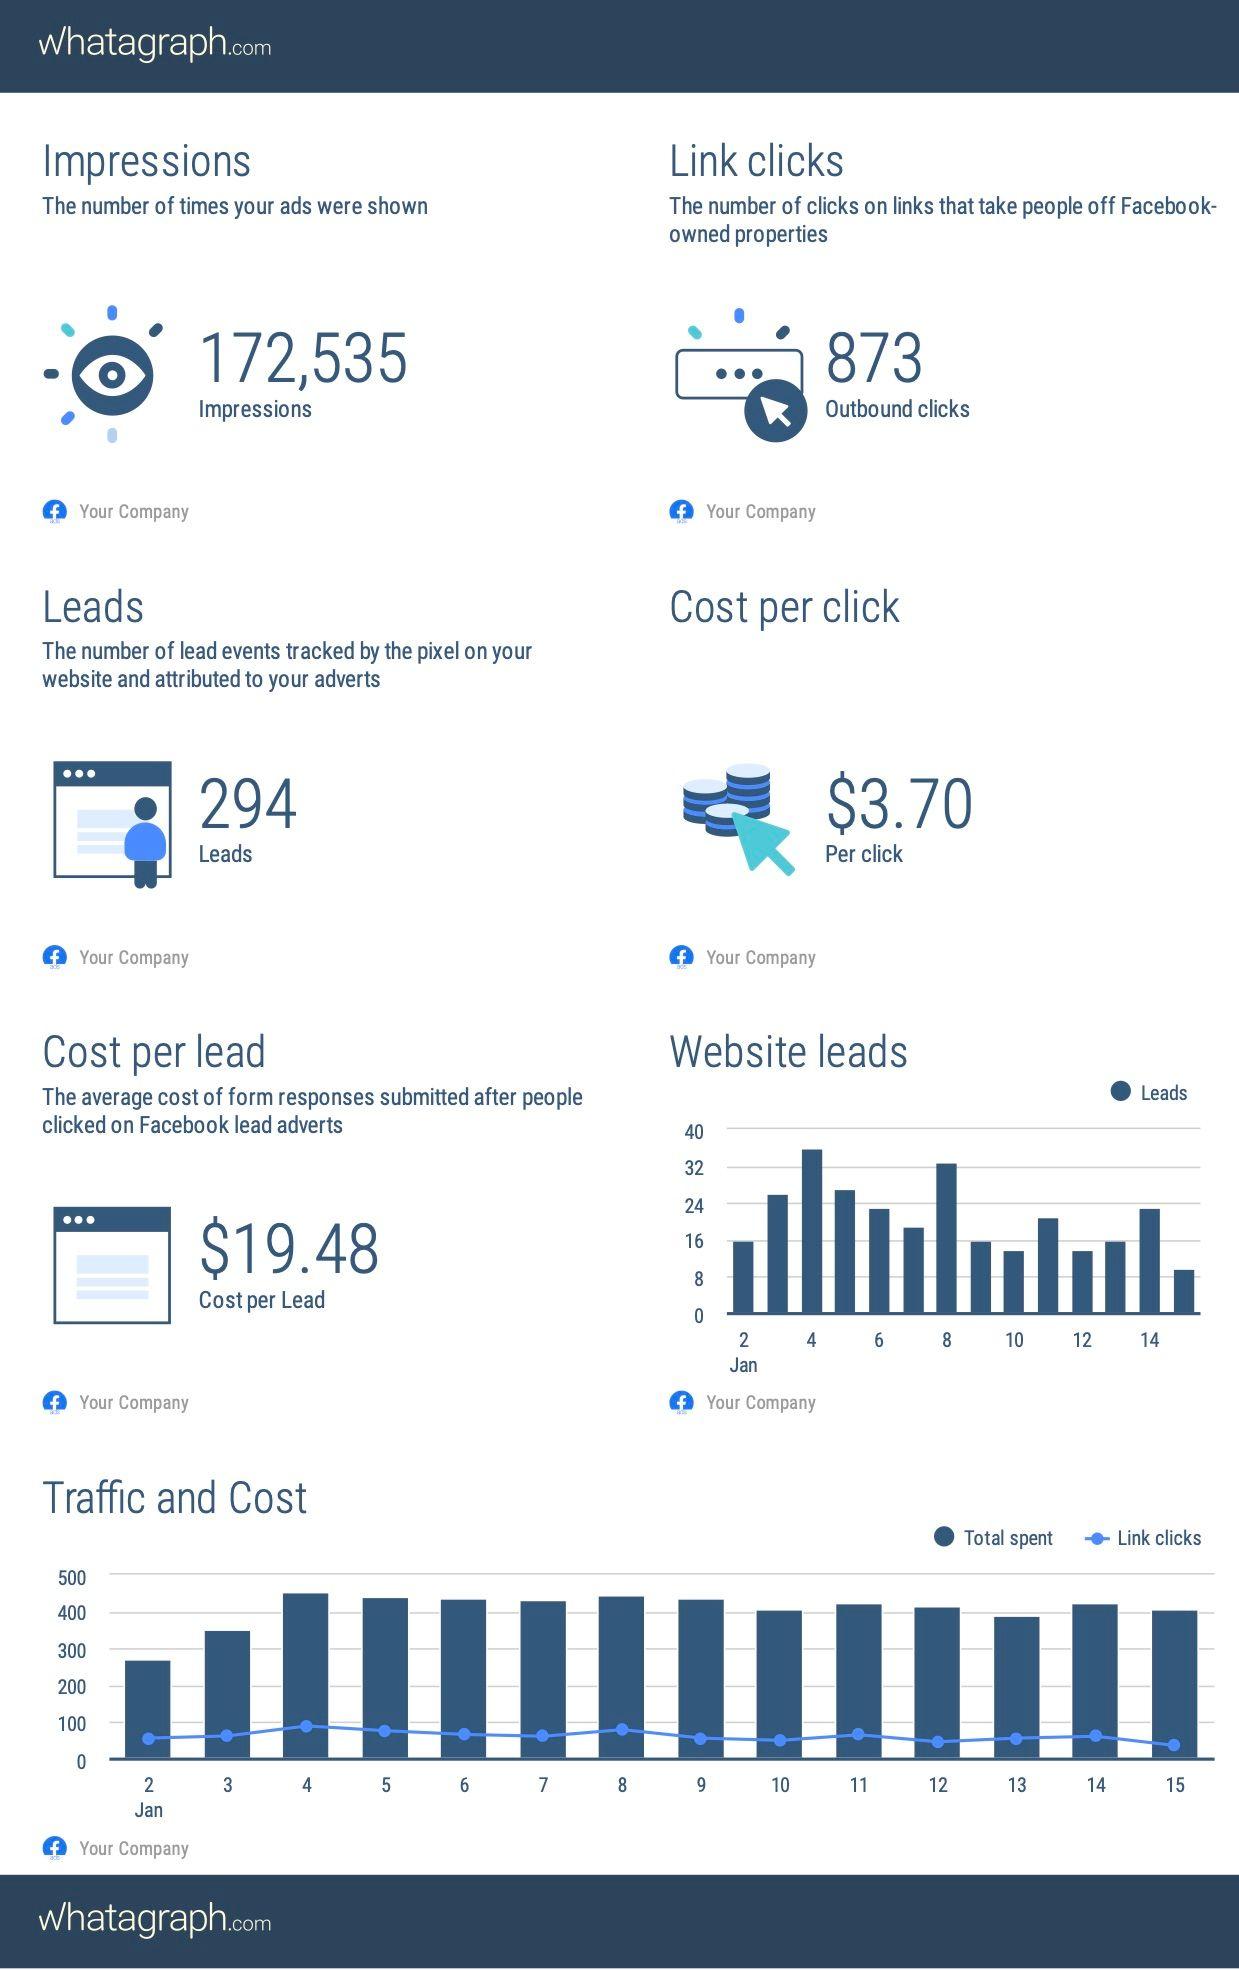
Whatagraph provides static reports, and recently it released the new version of dynamic, real-time reports.
To help you understand the importance of static and dynamic reports, we’re going to explain them separately, and then the things that make them different. In that way, you’ll figure out what’s best for your needs.
What Are Static Reports?
Static reports include data that is relevant to a specific point in time. These reports help create a unified perspective by providing consistent information for a given period. As static data presents a moment in the past, static reports are easy to share by email or print.
The static historical data presented in the report helps the user understand and assess performance as it tells a more unified, simpler, and strategically important story than looking at real-time data.
Static, historical data is useful in:
- Brand performance - trends in sales, brand advocacy, and brand awareness
- Product performance - for making decisions about a service or product investment or divestment according to their performance in a specific time period.
- Market performance – for example, analysis of market share and progress in comparison to competitors.
Even though these reports provide valuable information about a specific time period, there’s no way to investigate further into the insights presented on them.
In other words, static reports have a short shelf-life, so after being used, they are most often filed away and used for analyzing historical data.
One of the most common examples of static reports are daily reports. They present the statistics for a production day to help understand what has happened. So, they deal with data in the past that reveal how the process has changed and what to focus on to get better results.
Sending automatic emails with daily reports to employees or team will provide them with the right information at the right time. This, in turn, ensures they all get one version of the truth which will help them make collaborated conclusions and decisions.
Reporting on a monthly or weekly basis is another good way to use historical data. The static reports will provide employees and managers snapshots of their performance so that they can plan ahead and come up with a long-term strategy.
What Are Dynamic Reports?
Dynamic reporting is a type of reporting that generates and updates reports based on changes that occur in connected data sources. Dynamic reports automatically update as the data is added, modified, or deleted from the source. These reports allow you to analyze data through different interactive features.
They update data 24/7 like streaming video, which means the audience can share the experience, looking at it in real-time, and influence or participate in the determination of the process outcome.
The dynamic real-time data is available online to anyone who was given permission, anytime, and anywhere. It is easily accessible, always up-to-date, and easy to share.
Most dynamic reporting software is powered by ML or machine learning capabilities, so it’s intuitive and insightful, allowing the user to use data as past and predictive resource that helps them make better decisions in real-time. In fact, many businesses can’t make a decision without dynamic reports.
Thanks to dynamic reporting dashboards’ interactive nature, they allow businesses to react more quickly to sudden problems or changes by having access to data as it unfolds. This, in turn, saves time for everyone, including users, agencies, and clients.
What Is The Difference Between Static and Dynamic Reports?
Now that you know what static reports and dynamic reports are, let’s discuss more about the differences between them:
- Dynamic reports provide deeper insights than static reports, and allow users to interact with the data rather than just view it. In this way, the user can make better decisions.
On the other hand, static reports provide important data about a specific time period and are worth saving for historical performance reference. - Static reporting requires pulling up various reports from different sources and analyzing insights from a longer time period in order to provide a snapshot of data. This causes fragmentation and requires hours of time sifting through data.
Dynamic reporting, on the other hand, consolidates valuable data in one location, which allows for a quicker insight comparison and metric viewing from a broad time frame. This, in turn, allows the user to make decisions more quickly. - While exporting static report data into the right formats and sharing it digitally is possible, it takes a long time since the process is done manually. This means a higher risk for mistakes too.
On the other hand, dynamic reporting allows users to log into a dashboard whenever they want from their device. This means instant insights and analysis. - Dynamic data is visual-centric, with dynamic reporting tools providing various stimulating visuals, so it allows users to respond to data more effectively, leading to better business results.
Static data, on the other hand, is text-centric and lacks interactive functionality. That’s why extracting insights takes longer time and effort.
Conclusion
Static reports are based on important business data so they offer a certain value. However, dynamic reports allow the user to squeeze every last drop of value from the data presented.
They give the user an opportunity to investigate further into the information they know and help them spot potential opportunities for their business they thought never existed. This will help them make better decisions and respond effectively to changes in their business.
Published on Apr 17 2020
WRITTEN BY
Indrė Jankutė-CarmaciuIndrė is a copywriter at Whatagraph with extensive experience in search engine optimization and public relations. She holds a degree in International Relations, while her professional background includes different marketing and advertising niches. She manages to merge marketing strategy and public speaking while educating readers on how to automate their businesses.