7 Ecommerce Metrics for Business Owners
The best e-commerce entrepreneurs are obsessed with metrics. It's this obsession with measuring and optimizing that allowed their eCommerce business to grow so fast. However, they don't usually measure every single metric available. Ecommerce business owners choose their eCommerce reporting carefully, with select key performance indicators (KPIs) - which we will cover here.

Feb 20 2020 ● 8 min read

What Are These eCommerce Metrics?
The most successful eCommerce businesses make decisions based on metrics. These eCommerce metrics provide an accurate way to measure eCommerce success. While the total number of eCommerce metrics is quite large, these are the seven most important metrics to track the performance of your eCommerce site.
Website Traffic
The most basic but one of the most important eCommerce metrics. Directing traffic to your online store is how customers get acquainted with your products and can go through the sales funnel. The more traffic you get, the higher the chances are to make online sales.
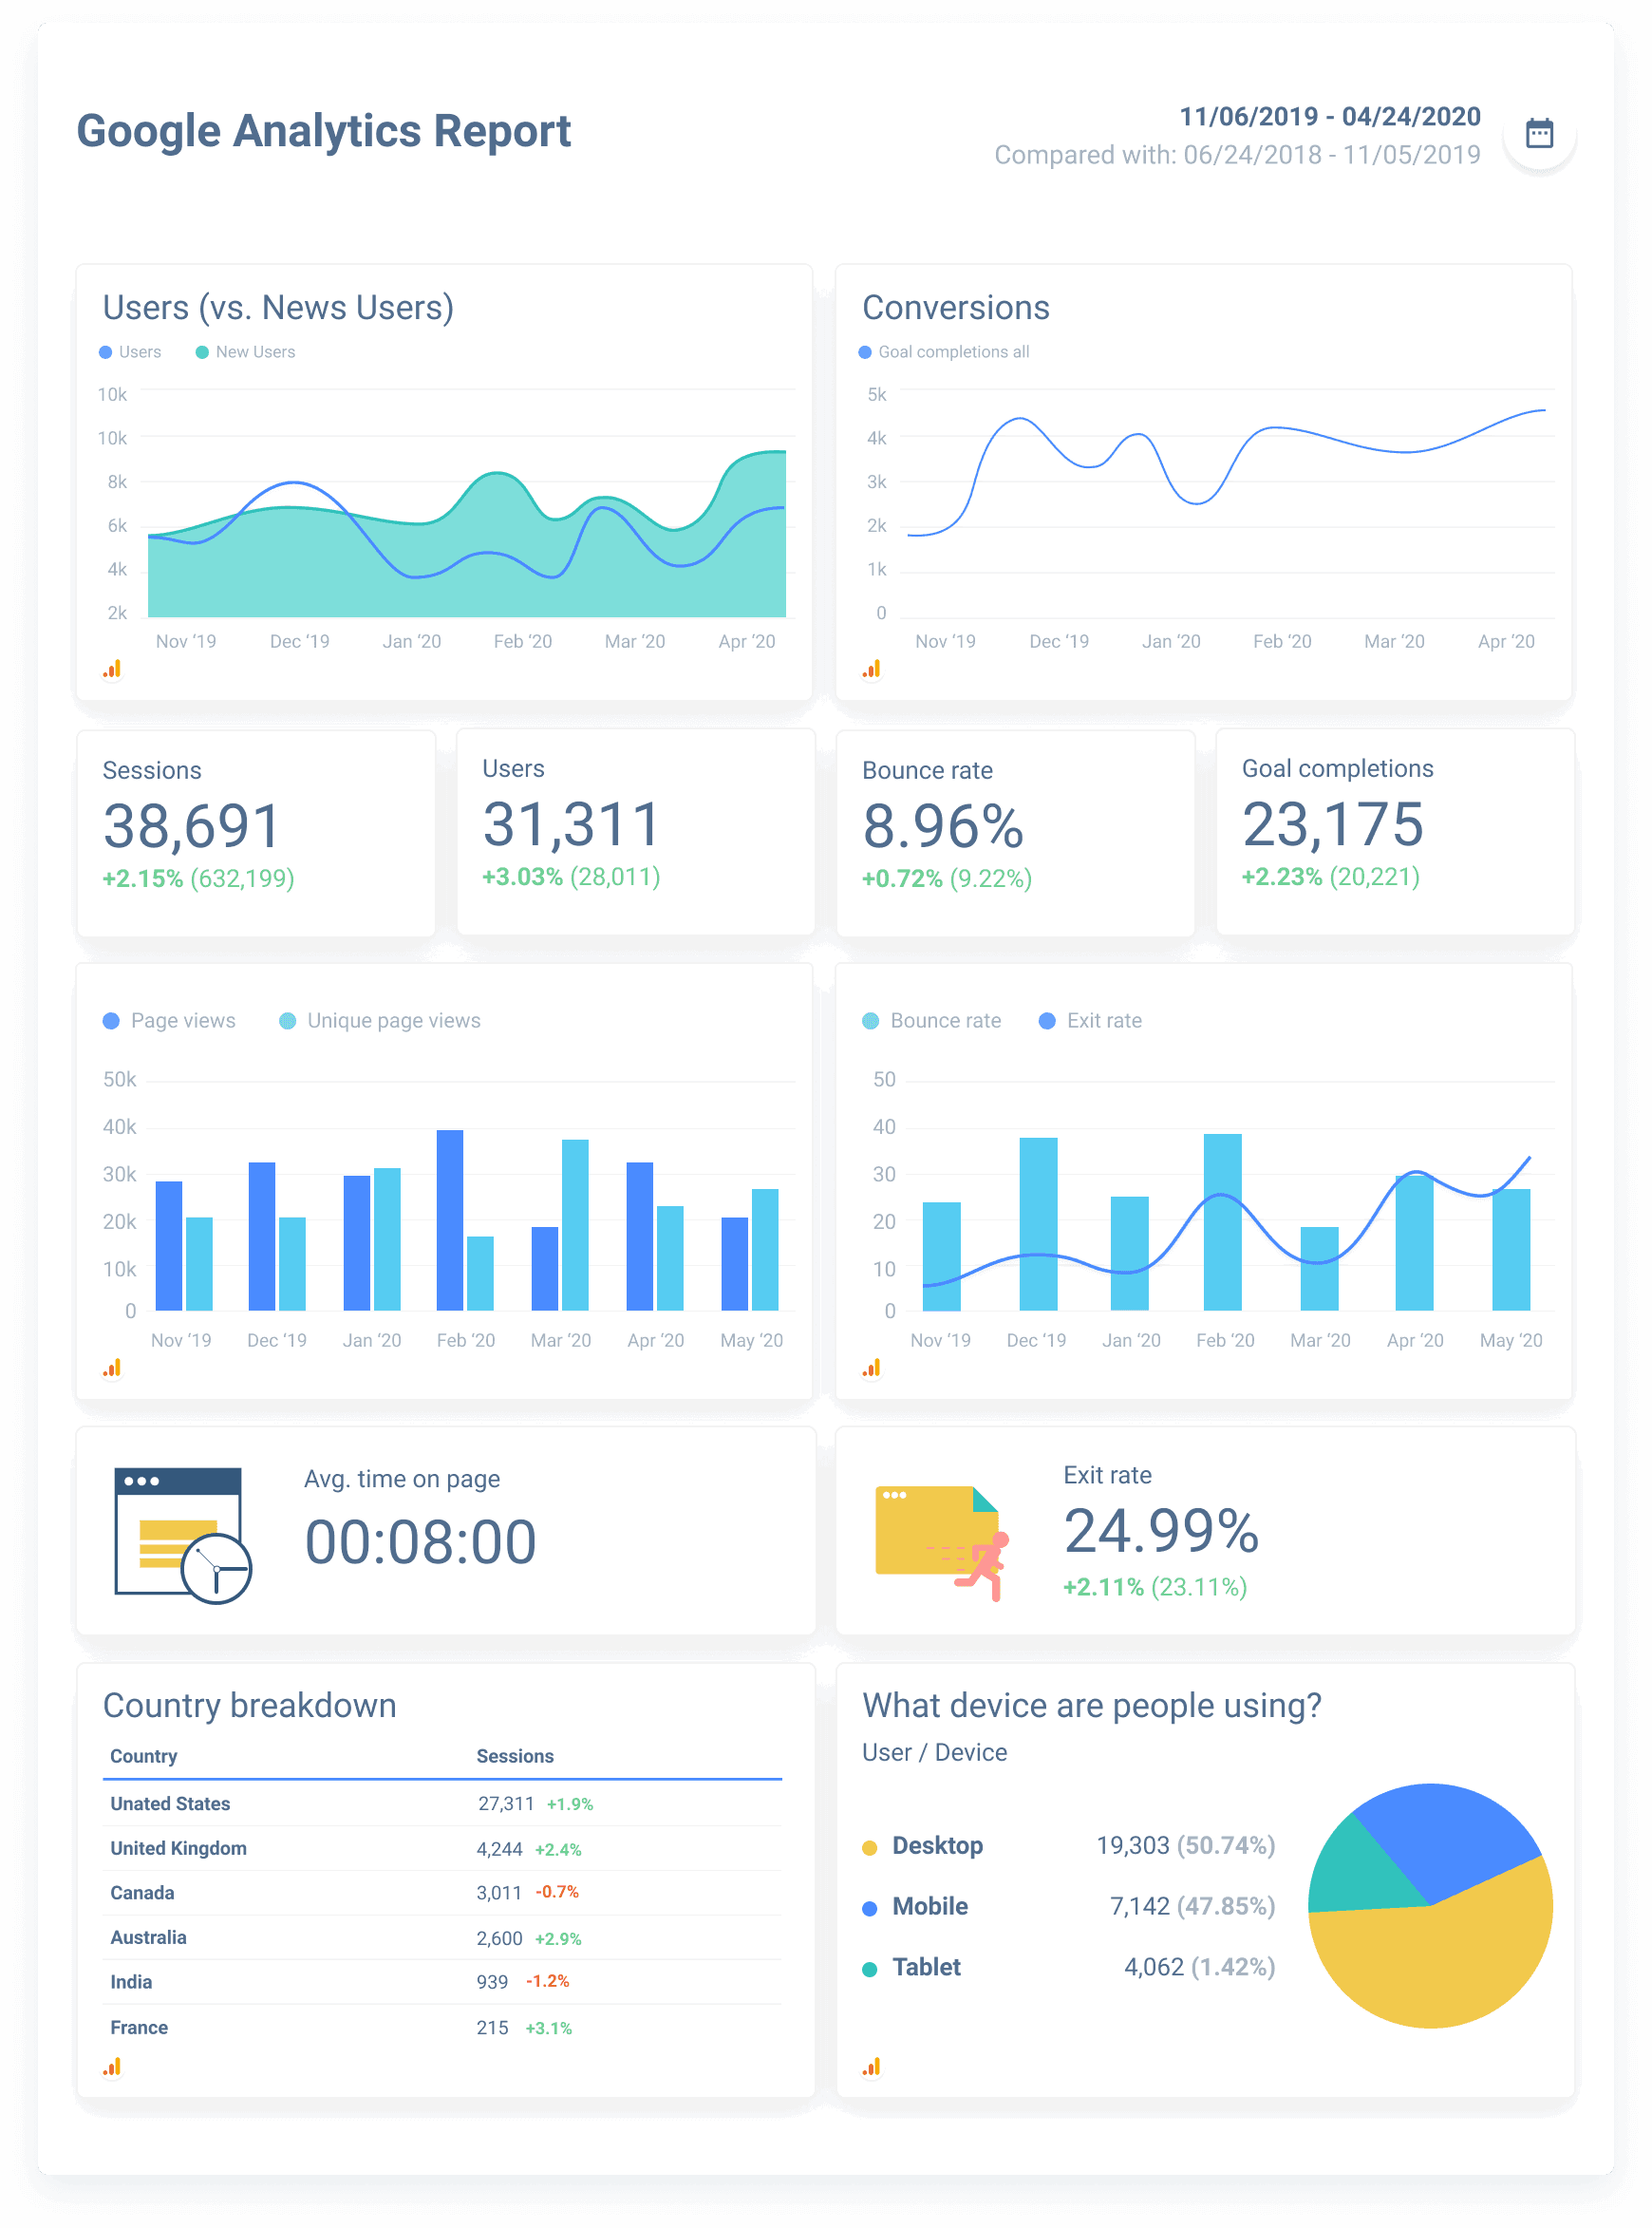
Report example: Here you see not just website traffic as the number of users, but also an indication of new vs. total users. This small insight can help you decide if you need an influx of new users, or your customers are so happy they keep returning.
This isn't a guarantee that you're getting the right customers. Figuring out your ideal client is also essential. The perfect customer profile is determined by the industry you're operating in, target audience age, gender and other factors. These metrics then translate into marketing campaigns that bring traffic to your eCommerce store.
To grow your website traffic, you can:
- Promote your offerings on social media;
- Optimize your site/store for search engines;
- Grow the number of people subscribing to your newsletter.
Despite the customer specifics, website traffic is the number one key performance indicator you should be tracking. It leads directly to eCommerce conversion rate.
Customer Acquisition Cost
Each customer you bring to your e-store costs money. TechTarget defines customer acquisition cost as "the fee associated with convincing a consumer to buy your product or service, including research, marketing, and advertising costs."
This is one of the most important eCommerce metrics to follow because it ensures that the time and money you're investing in acquiring customers is worth it.
In some cases, the money brands end up spending to acquire a customer exceeds the revenue they're bringing in. And this isn't a viable business strategy for obvious reasons. To calculate your customer acquisition cost, use the following formula:

And once you acquire those customers, you need to make sure those customers check out successfully. That's where the conversion rate comes in.
Conversion Rate
A successful marketing strategy for your eCommerce store increases website traffic. This is one of the key metrics used in analyzing the performance of the eCommerce store, and you can calculate it using the given formula: total sales / total visitors.
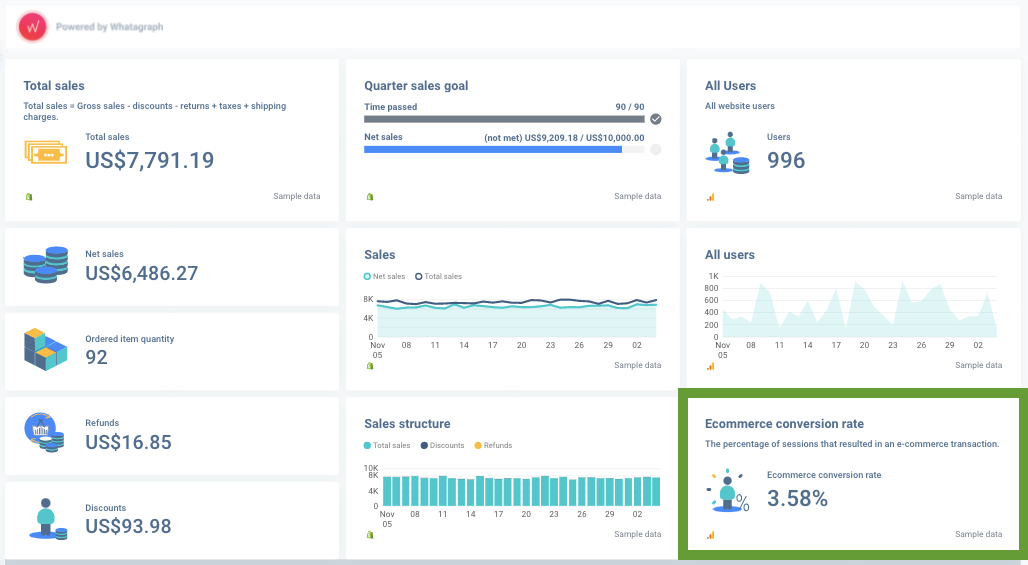
Example report: Whatagraph provides the conversion rate metric as part of the full e-commerce performance analysis. In this Shopify + Google Analytics report example, the conversion rate is but one of many eCommerce metrics taken into account when tracking performance.
To track such eCommerce metrics, you can either use tools like Google Analytics or use the sales records stored within the third-party e-commerce platform like in the case of Amazon advertising. If you are already tracking this metric for your eCommerce store, then you can probably optimize your eCommerce to enhance this number.
Here are other common metrics that relate to conversion rate:
- Shopping cart abandonment rate - find out why your customers don't finish their checkout process;

- Average order value (AOV) - track how much each paying customer is spending and see if you can increase it. Common tactics are bundles, discounts, loyalty programs and so on;

- Repeat purchases - see the rate of repeating purchases of returning customers and what best practices keeps them coming back;
- Customer loyalty - customers coming back are part of the conversion rate, so keep an eye on their numbers.
Total revenue
Once you have traffic and conversions on your eCommerce site, you need to keep an eye on total revenue. The self-evident thing is to make sure it doesn't exceed expenses.
Total revenue alone will not tell you what works best on your e-store. But together with other eCommerce metrics, tracking revenue will indicate the overall success of your business.
Customer Lifetime Value (CLV)
Once you have repeat customers, your online store has really caught on. It's time to look at the Customer lifetime value (CLV). The term refers to the average projected revenue you expect your typical customer to provide throughout their "lifespan" with your company.
Nailing down CLV is a bit convoluted, but it essentially involves taking into consideration:
- Your average order value (AOV);
- Your average customer's purchase frequency;
- The average lifespan of your customers.

The purpose of tracking CLV makes sense: the more your customers spend - and the more often they make purchases - the better average order value you'll get. And increasing the average order value is a cost-effective alternative to getting new traffic. After all, it means more revenue at a fraction of the cost – less acquisition and transactional costs.
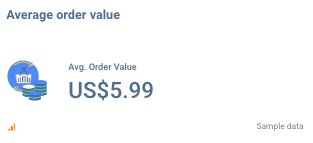
Why is average order value important?
Because it's an insight into how interested people are in your products. We all want to be that store that captures customers with everything they've ever wanted and get orders for $1000 at a time.
In general, it's important to monitor average cart value from different acquisition channels and geolocations and products that usually drive order value up (e.g. products that require regular maintenance and accessories or bigger/bundled packs).
Some of the bullet-proof ways to increase AOV include:
- Bigger/bundled packs;
- Selling add-ons or services;
- Gamification/ bonus schemes/ loyalty programs;
- Mix & match offer.
Average order value is also related to customer satisfaction. If your products prove valuable, your customer retention rate will likely stay up as well. But not all customers will be satisfied, no matter how well your eCommerce business runs. That's why it's also essential to look at the bounce rate.
Bounce Rate
The bounce rate is something of an antithesis of the conversion rate. A customer came to your eCommerce website, browsed your product pages and left without touching the cart or a CTA. That's the bounce rate you should be looking at.
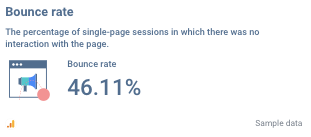 An excellent way to find out why those sales didn't happen is to track the customer journey. See which marketing efforts brought the bouncing customer in - social media campaigns, email marketing, etc. - and follow where they stopped their purchasing journey. Find ways to improve the journey so the bounce rate would be lower.
Additional metrics
Besides these main eCommerce metrics, there are other metrics worth keeping an eye on.
- The ratio of existing customers vs new customers - keep in mind that retaining existing customers is always cheaper than getting new ones;
- Click through rate of your marketing campaigns - this helps track the interest of potential customers;
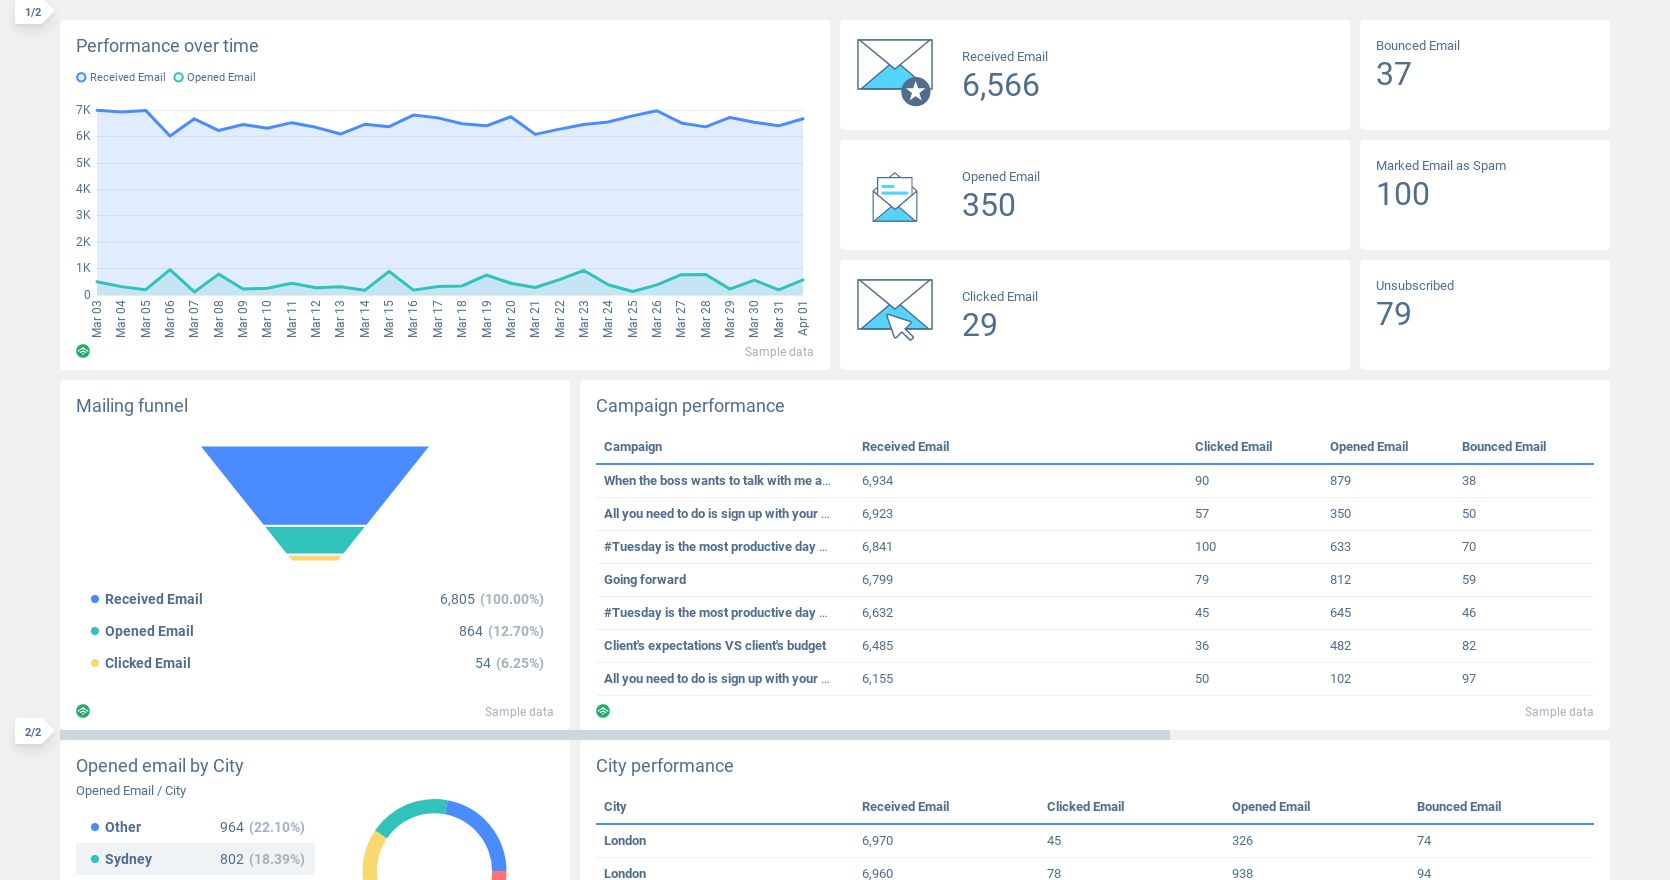
- Email marketing metrics - open rate, click rate and purchases done through emails can be an effective way to see if this campaign works. Email marketing is a great way to retain existing customers by showing them new offers.
Example report: Here you can see the sample report from Klaviyo: the eCommerce emailing platform. All essential metrics are here, in a single board - made available by Whatagraph.
Conclusion
The best way to track eCommerce metrics is to put them in a single sales report like this one. That way, you will have an overview of your entire operation and be able to run a successful eCommerce store.
Another great eCommerce metric is the ROMI - return on marketing investment if you want to dive a little deeper.
Published on Feb 20 2020

WRITTEN BY
Indrė Jankutė-CarmaciuIndrė is a copywriter at Whatagraph with extensive experience in search engine optimization and public relations. She holds a degree in International Relations, while her professional background includes different marketing and advertising niches. She manages to merge marketing strategy and public speaking while educating readers on how to automate their businesses.
