The Top 16 E-commerce KPIs That Impact your Store Performance
To assist their clients, marketing agencies track certain e-commerce KPIs to measure their marketing campaigns and strategy’s effectiveness. At some point, there is a need to optimize and improve the client’s e-commerce site to get better results.

May 07 2020●6 min read


- How to Choose Your E-commerce KPIs?
- Top 16 Ecommerce KPIs to Track
- 1. Conversion Rate
- 2. Average Order Value
- 3. Cart Abandonment Rate
- 4. Customer Lifetime Value
- 5. Repeat Purchase Rate
- 6. Customer Acquisition Cost
- 7. Return on Ad Spend
- 8. Gross Profit
- 9. Cost of Goods Sold
- 10. Net Profit Margin
- 11. Shopping Cart Conversion Rate
- 12. Gross Merchandise Volume
- 13. Conversion Rate by Channel
- 14. Refund and Return Rate
- 15. Bounce Rate
- 16. NPS Score
- How Often Should You Report on E-commerce KPIs?
- Bottom Line
Without specific KPIs, achieving or optimizing anything regarding the client’s e-commerce business would be hard. Here is a list of the crucial metrics you should start monitoring for better results.
How to Choose Your E-commerce KPIs?
To make sure you are tracking just the right e-commerce KPIs for your client, consider these questions:
Have you identified your client’s strategic goals?
Answering this question is a good start. Ensure every indicator is linked to a goal your client wants to achieve - fewer cart abandonments, more conversions, more upsells or anything that comes to mind. It will serve as a guide on what you should focus on.
No matter the goal, the identified KPI, sales or conversions will help you see how well you implement and execute your strategy.
Who is receiving information, and why about this indicator?
Marketing agencies create reports for their clients, executives, team members, and other stakeholders.
Remember that every indicator has a specific audience that understands it and can do something with that information.
Identify the audience who is receiving information related to e-commerce business and why. This way, you’ll better determine indicators.
For example, you may create a financial performance report that would probably go to the board or website traffic performance report for team members. Moreover, you won’t show the same information to the CMO and the head of sales.
What question do you want to have an answer to?
You may be curious to know to what extent you are delivering bottom line results or which products are the most favourite of your client’s customers.
These open questions trigger discussion and help better identify the KPIs worth tracking.
Top 16 Ecommerce KPIs to Track
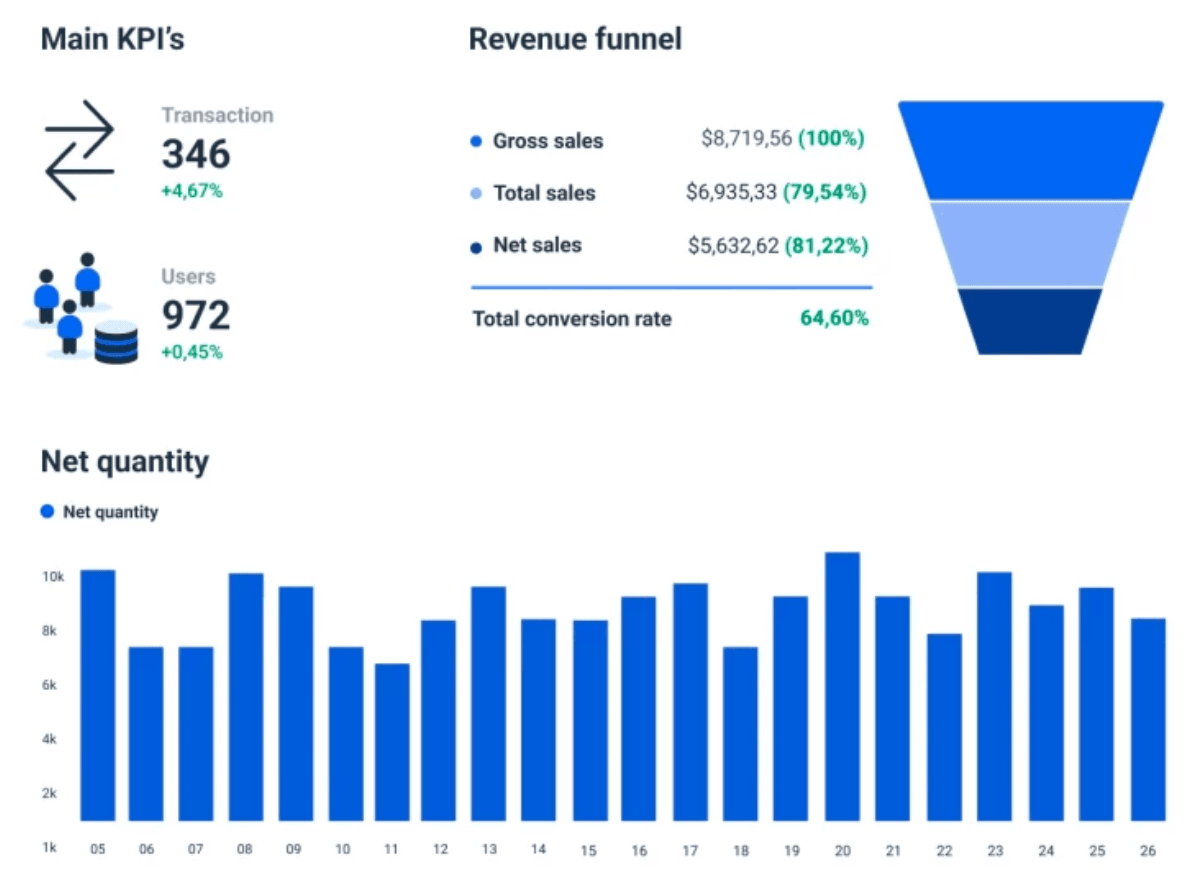
In 5 minutes, understand how your client’s business is doing by tracking these KPIs listed below. With e-commerce analytics, find out how your client’s business is growing and where it needs improvement.
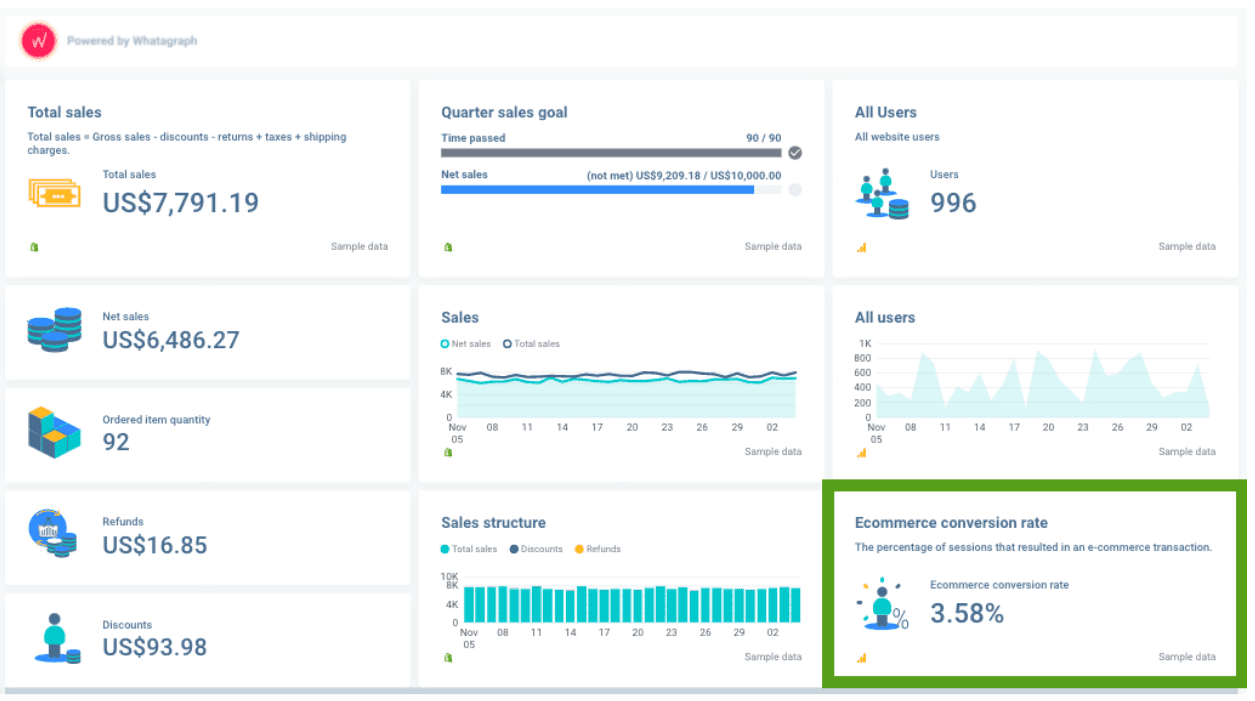
1. Conversion Rate
Definition - The conversion rate indicates whether or not a website visitor completed the action you desired. It is typically measured in percentages, with the higher the percentage indicating a successful campaign.
How to calculate it? - Take the number of visitors who completed the desired action, divide it by total visitors and multiple 100x.
Average conversion rate - Stats:
- The global average for ecommerce conversion is 2.58 percent.
- In the United States, the average ecommerce conversion rate is 2.57 percent.
- The global average for ecommerce conversion is 3.81 percent.
Yet, it the strongest websites typically have 11% or higher conversion rates, which you should be aiming for.
Lee Dobson, Head of Client Services from Bulldog Digital Media, an e-commerce marketing agency, offers a little advice:
‘There are many ways to improve your conversion rate, such as making sure your website is easy to use and providing compelling offers’.
Why should e-commerce businesses track it? - The percentage indicates whether they are taking the actions you want them to take,, whether there are any technical issues you need to deal with, or whether you need to improve the optimisation of your client's website.
You can look at your conversion rate from a high-level view to determine who lands on your site and drill down to a specific product or landing page.
Ben Hartwig, a Web Operations Executive at InfoTracer, tracks their conversion rate because:
'This KPI enables businesses to increase their client’s revenue per visitor, get high value from them, get more market share, and eventually achieve growth’.
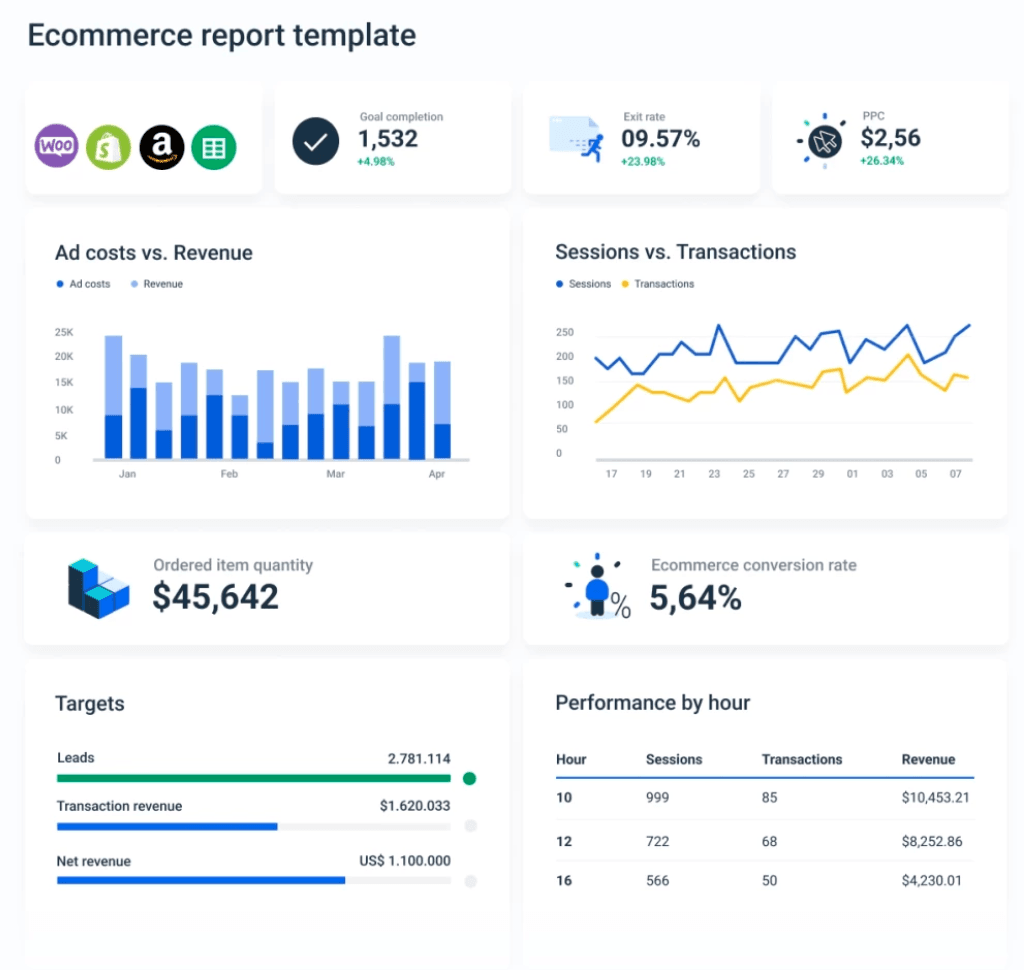
Get all your e-commerce KPIs and gather them into a single report. Use our free eCommerce report template and get all the KPIs mentioned in this article in one place.
2. Average Order Value
Definition - AOV provides information on the typical amount of money a customer spends every time they make a purchase from a client’s ecommerce store.
How to calculate it? - Take total revenue, divide it by the number of orders and multiple by 100.
Average rate - average order value globally is $116.
Why should e-commerce businesses track it? - It’s important to track this KPI because ideally, you want each order to be as big as possible. Moreover, selling more to existing customers is easier than attract new ones.
For example, a survey by the National Retail Federation found that 75% of consumers expect e-commerce shipping to be free on orders below $50. This means that shoppers might bounce if they have to pay for shipping. And by setting a free shipping threshold for, say, $35, $50 or a hundred dollars, depending on your AOV, you can encourage customers to spend more.
And if your AOC is, let’s say, $86, you can set the free shipping threshold to a hundred dollars. This is going to encourage most customers to want to spend the extra $15 to save money with the free shipping.
Moreover, this KPI tells you about your client’s customer satisfaction and buying habits and shows customer retention rates.
3. Cart Abandonment Rate
Definition - Cart abandonment rate tracks the percentage of people who add items to their cart without completing the purchase.
How to calculate it? - Here is a formula:
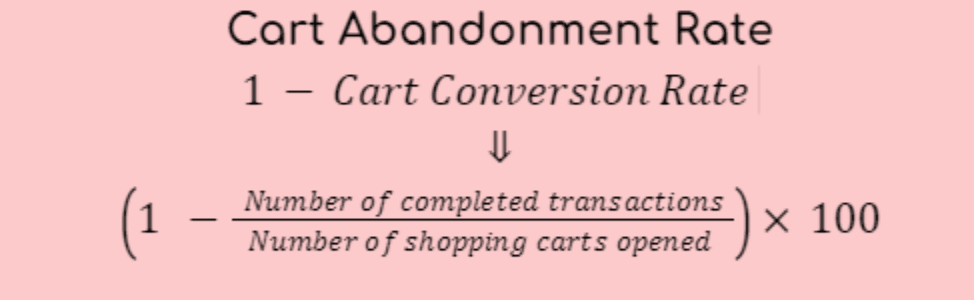
Average rate - This KPI varies by website and industry. The universal average cart abandonment rate in 2020 was about 80%. And this means that after all of your efforts to bring people to your client’s website and promote their products, about 80% of people added items they were not going to buy. (That’s quite alarming, right?)
Why should e-commerce businesses track it? - Cart abandonment sheds light on issues in your client’s e-commerce business. This could be a long, convoluted checkout process, obligated sign up for an account or simply to compare your client’s pricing to that of competitors.
If the shopping cart abandonment rate is high, optimize the checkout process so the flow is effortless, offer multiple payment options, and deal with any technical issues.
4. Customer Lifetime Value
Definition - CLV measures a single customer's revenue/gross profit throughout their relationship with your client’s business.
How to calculate it? - Take your average order value and multiple it by the number of customer visits per year and their average time spent with your company.
Why e-commerce businesses should track it? - CLV helps track your cost per acquisition and determines the health of your business.
For marketing agencies, CLV tell what kind of products clients’ customers with the highest CLV want, who their most profitable customers are.
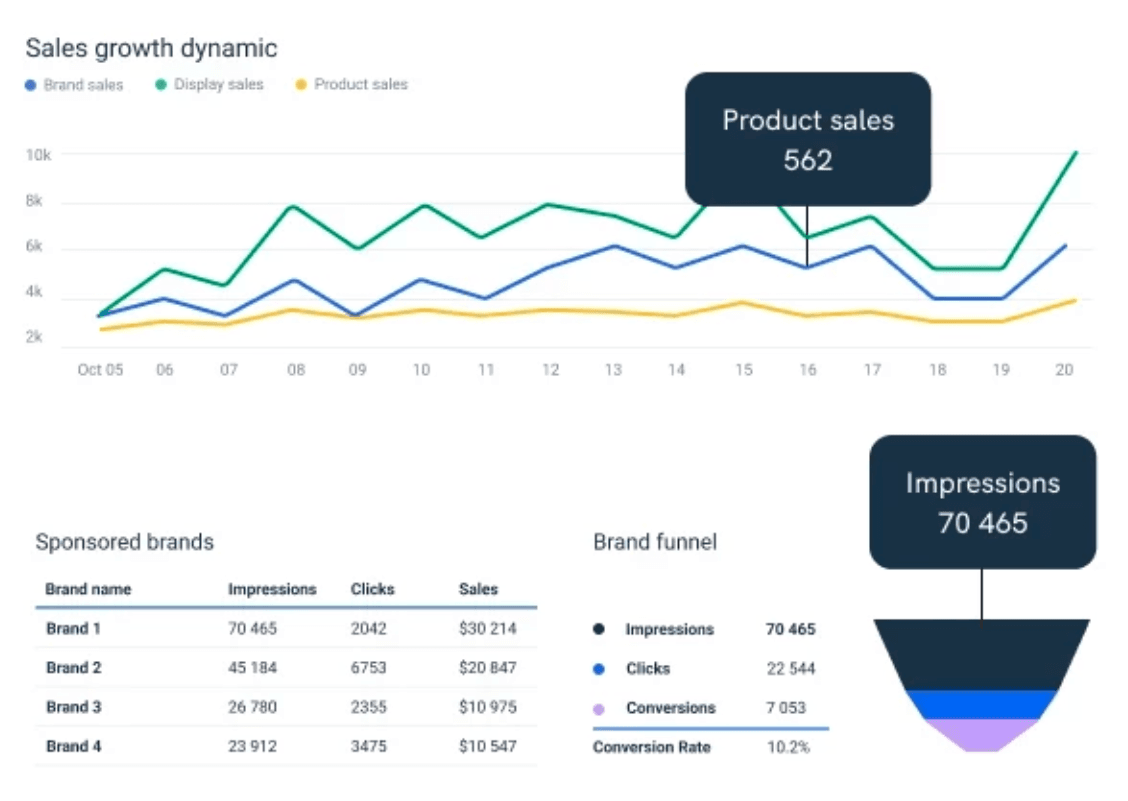
CLV requires huge volumes of data such as website sources, leads, favourite products, etc. Use our pre-made Amazon Ads Dashboard and easily pull all the necessary information.
5. Repeat Purchase Rate
Definition - This KPI measures the percentage of people who returned to your client’s website to purchase another item.
How to calculate it? - Take the number of returned customers to purchase another item and divide by the total number of customers.
Average repeat purchase rate - Most surveys find that the average RPR is between 20% and 40%.
Why should your e-commerce businesses track it? - Simply put, if you have a low repeat purchase rate (this would be lower than 20%), this might mean a couple of things:
- Your client’s product does not fit in the market, and the client’s customers aren’t interested in it;
- Poor customer service;
- Not attractive and non-friendly website user experience.
Here is what you can consider:
- Offer 2-day delivery. According to a survey by A.T. Kearney, most American customers think three days is an appropriate wait time for online purchases. This means you’ll have a higher chance of increasing customer returns by offering quick shipping;
- Create referral programs. If your client’s customers can earn extra bonuses by purchasing items, such as discounts, you may rest assured that you’ll attract at least some attention;
- Create excellent customer support service;
- Read customer reviews and feedback on Google or Amazon. Find out the pain points of your client’s customers and what is exactly the problem they face with the business.
- Optimize search for better retention. Multimodal search helps customers discover relevant products faster, improving engagement and repeat purchases.
6. Customer Acquisition Cost
Definition - CAC tells how much money you spend to get a new customer for your client.
How to calculate it? - Add all your costs (sales, tools, paid media) and divide them by the number of new customers you have acquired.
Why should e-commerce businesses track it? - Depending on your client's business stage, whether a start-up or an older company, CAC will differ accordingly. Newer businesses, of course, will have higher CAC, and more established businesses will generally have a lower CAC
Recognising how CAC works can help you improve the effectiveness of your sales and marketing strategies. You can increase the effectiveness of your outreach by defining which aspects are underperforming and which are succeeding at attracting new customers. As you reduce CAC and improve the efficiency of your acquisition funnels, your client's company profit margin improves, and it has more revenue to use.
How to improve CAC? - Here are a couple of things to consider when trying to improve CAC:
- Track marketing and sales cycles. Find out how fast the sales cycle is, how long it takes for sales to process and at what stage a customer stops going through. When it comes to marketing cycles, examine campaigns, learn which ones bring in the highest return on investment, and relocate money if any campaigns are unprofitable.
- Improve conversions. Generally, more conversions from the same kind of traffic means a better CAC.
7. Return on Ad Spend
Definition - ROAS is the KPI that measures your client’s company's revenue for each dollar it spends on ads.
How to calculate it? - Take your total conversion value and divide it by your from Facebook ads, Google Adwords, etc., costs.
Why should e-commerce businesses track it? - Evaluating the return on ad spend helps marketing agencies determine whether their budgets are being spent effectively. A ROAS can demonstrate how well your messaging resonates with the client’s existing customers and attracts new customers.
This metric can also help marketing agencies identify inadequacies in their methods and help to improve them. Defining marketing successes and challenges can help businesses plan future ad campaigns and marketing budgets in ways that reduce costs while increasing revenue.
Here is a PPC reporting tool to help you determine your ROAS and easily compare it to other KPIs such as CAC or conversion rate.
8. Gross Profit
Definition - Gross profit margin is the KPI measuring profitability ratio used by marketing agencies to calculate what percentage of a company’s net income comes from sales.
How to calculate it? - Sales Revenue – Cost of Goods Sold
Why e-commerce businesses should track it? - By calculating gross profit, you can find out what percentage of revenue you have to pay expenses. It assists in distributing recurring expenses, taxes, debt, capital costs, etc. The greater the gross profit percentage, the greater the growth potential. The lower the percentage, the closer you are to a cash flow deficit.
To be calculated accurately, gross profit needs access to many other KPIs (such as net profit, revenue, conversion rate, etc.). Get e-commerce reporting software and track all your e-commerce KPIs in a single dashboard.
9. Cost of Goods Sold
Definition - COGS is the amount of money it costs to create a product.
Note. COGS is not the cost of delivering the product to the customer. Rather, traditionally, the costs include raw materials, labour to manufacture and finishing, packaging of the product and shipping to the warehouse.
COGS for tech/SaaS costs include customer service, hosting, and credit card charges.
How to calculate it? - Starting inventory + purchases − ending inventory
Why e-commerce businesses should track it? - COGS enables businesses to calculate their gross profit margin on sales made during a given period of time, which is the first step toward determining a company's net profit.
This KPI is also beneficial for marketing agencies as it shows how profitable the client’s business is and how much money can be spent on marketing strategy initiatives.
10. Net Profit Margin
Definition - According to the Financial Times’ dictionary, this is: “The profit of a company after operating expenses and all other charges including taxes, interest and depreciation have been deducted from total revenue’.
How to calculate it? - Total revenue minus total expenses.
Why e-commerce businesses should track it? - NPM provides insight into how much money can be spent because it measures how much money a client's company has left after deducting all expenses.
This means better decisions about where to allocate available resources and how to strengthen your client's company bottom line can be made.
With e-commerce reporting software, you can access historical net profit margin data and see how your client’s business grows. Learn about the trends, how different seasons affect their business and what times are most profitable.
11. Shopping Cart Conversion Rate
Definition - The SCCR KPI allows marketing agencies to compare the number of completed orders to the number of shopping carts started by potential customers.
How to calculate it? - Here is a formula
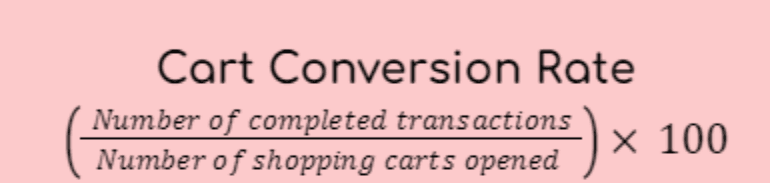
Why should e-commerce businesses track it? - Cart conversion is crucial as it determines how efficient your checkout process is at converting customers.
According to a Baymard survey, 53% of abandoned carts happen due to additional purchase costs.
With e-commerce reporting software, you can learn about transactions and orders, sales volume and trends, website traffic patterns, revenue per customer, best-selling products, and more. This information is useful when trying to optimize and improve your client’s online store. Access this important data now and determine e-commerce metrics and KPIs that need improvement.
12. Gross Merchandise Volume
Definition - Gross Merchandise Value (GMV) is a KPI that calculates your total sales value over a given period.
How to calculate it? - Sales price of goods x number of goods sold.
Why e-commerce businesses should track it? - GMV is a good indicator of growth and can determine the overall functioning of a client's e-commerce business. GMV measures the volume and value of merchandise sold as well as the number of transactions completed. So, if the GMV is increasing, your client's business should be doing well!
The Corporate Finance Institute recommends measuring e-commerce GMV at least once a year. However, remember the gross merchandise value calculation before deducting fees and expenses associated with product sales. This includes delivery costs, discounts, advertising costs, and returns, among other things.
13. Conversion Rate by Channel
Definition - Conversion rate by channel is KPI that measures desired actions made by a client’s customers on specific marketing channels (direct, social media platforms, Google, etc.).
How to calculate it? - Divide the number of leads generated by a marketing channel by the total number of visitors sent through that channel over a year.
Why e-commerce businesses should track it? - Conversion rate by channel tells marketing agencies which websites, ad campaigns, and social media accounts get the most people to fulfill the desired action.
It gives a reference frame to compare and find customer behaviour trends.
However, there is a limitation that you should keep in mind - conversion rate is highly affected by external factors. These could include pricing changes, seasonal effects, or new advertising campaigns. They all could influence and distort data. You also have to be careful with how you track this metric. While you can improve your eCommerce business with social media integration on your website, you must separate who converts where. A customer who gets to your social media by your website is still a social media conversion if they purchase your products and services off your site.
Here are some conversion statistics from the marketing agency industry:
- The average paid search conversion rate is 6.6%;
- The average email conversion rate is 2.3%;
- The average organic search conversion rate is 2.3%;
- The average referral conversion rate is 3.6%
14. Refund and Return Rate
Definition - Return/refund rate is a KPI that measures the percentage of sales orders with a product return.
How to calculate it? - Divide the number of return items by the total number of sold items and multiply by 100.
Why e-commerce businesses should track it? - Marketing agencies need to track refund rates because it directly affects conversion rate, profit margins, and customer satisfaction.
Advice:
- Make sure to offer standard and expedited shipping options;
- Make sure to make the return policy easy to find and read;
- Proactively engage with clients’ customers in conversation about their shopping experience;
- Include detailed product definitions and high-quality product images on your clients’ product pages;
- Make it simple for your client’s customers to exchange items.
Here are four more e-commerce return statistics that you should be aware of:
- 10.6% is the overall return rate;
- 18.1% is the return rate in e-commerce;
- The average amount of returned clothing is 12.2%.
- In 2020, an estimated $428 billion in retail merchandise will be returned;
- After a bad return experience, 84% of online shoppers would say goodbye to a retailer.
15. Bounce Rate
Definition - Bounce rate is a KPI that shows how many people left the client’s website without interacting or taking action, after visiting just one page.
How to calculate it? - Divide the number of single-page sessions by the total sessions on the site.
Why e-commerce businesses should track it? - Marketing agencies benefit by tracking this KPI by providing an overview of customer behaviour.
To be more precise, we’d need to drill deeper and consider these things:
- Search intent. Agencies need to find out why people landed on their client’s site in the first place.
- Low-quality content. Maybe the page is not SEO optimized, there are no internal linking and no effective CTAs. Double-check on those and start creating compelling content.
- It’s not mobile-friendly. More than 80% of online time is spent on mobile devices. Some examples of non-mobile-friendly e-commerce website mistakes:
- The content spans the screen's width
- The hyperlinks are too close together
- The text is difficult to read.
Implementing mobile-friendly ecommerce website design features can help reduce bounce rates by making it easier for shoppers to browse products and complete purchases.
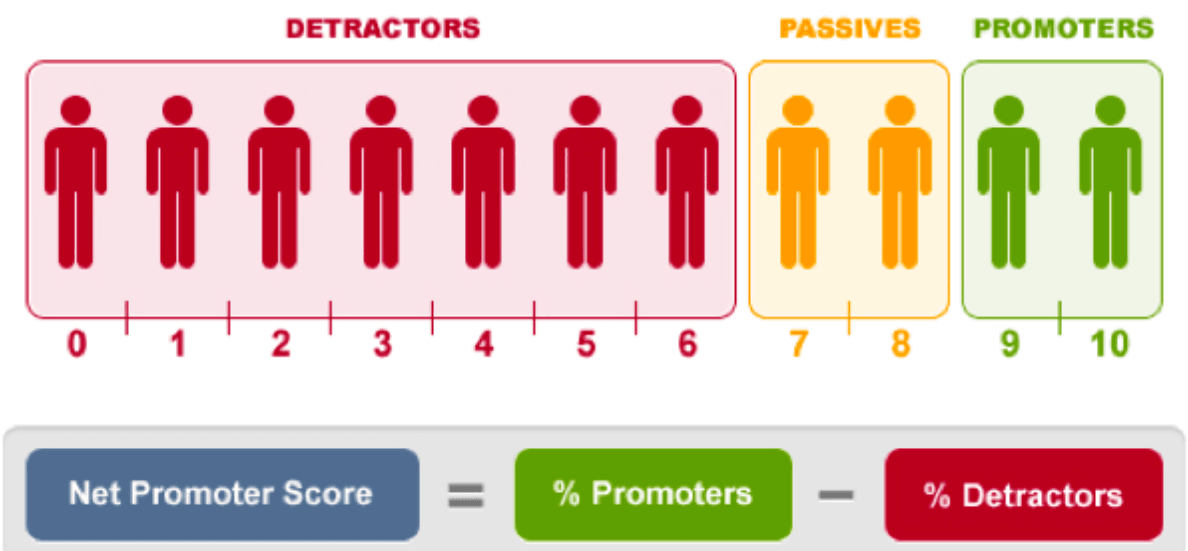
16. NPS Score
Definition - A net promoter score is a KPI that gives an insight into how likely is it that someone would recommend your client’s business to other people.
How to calculate it? - Here is a formula
Why e-commerce businesses should track it? - NPS assists in:
- Identifying and tracking changes in customers’ feelings towards your client’s brand over time;
- Providing direction and benchmarks for change and improvement;
- Providing a larger picture of how clients' customers perceive the product;
- Measuring the likelihood of repeat business.
How Often Should You Report on E-commerce KPIs?
To decide how often you should report on e-commerce KPIs, you need to ask yourself these questions:
- How valuable is this KPI for the client? - The bigger the impact, the more valuable it is.
- Will working on this KPI help improve overall performance? - KPIs are intertwined and interconnected. If, for example, you want to focus on increasing sales, improving and reporting conversion rate would benefit a client.
“Reporting can be done daily, weekly, bimonthly, monthly, quarterly or annually, depending on your requirements,” says Aaron Crewe, Managing Director at Novi.Digital.
Here's how different intervals could help:
- Weekly reports - Provides critical insights into the success of your most recent marketing initiatives. This information will be useful in developing a strategy for the coming weeks.
- Monthly reports - Gives you a more comprehensive picture of your marketing initiatives and their performance. This information is useful for determining how these initiatives affect important KPIs.
- Quarterly reports - Provide critical metrics for evaluating quarter performance.
We surveyed over 160 mid-size agencies and agency clients worldwide to understand the landscape of agency-client reporting better and lay the groundwork for report monetization.
And we discovered that the majority of agencies report on a monthly and weekly basis.
Clients, on the other hand, appear to have slightly different expectations. Monthly and real-time reporting received an equal number of votes, with weekly reporting coming in second and daily reporting coming in third.
Bottom Line
Many e-commerce KPIs provide valuable insights into your client’s e-commerce store and your strategy. Not to get overwhelmed with unnecessary ones, we cover the top 16 that will help to optimize your initiatives and efforts.
As taking care of the client’s business and branding is already a hassle, we want to offer you a reporting tool that would save hours by cutting down on reporting.
Managing your client's business and branding is difficult enough. We want to provide you with a reporting tool that will actually save you time.
Whatagraph integrates with the leading e-commerce marketing platforms, including BigCommerce, SEMRush, Shopify, Ahrefs, WooCommerce, etc. Allow us to collect all of the data precisely and automatically so that you can analyse your client's audience behaviour patterns and achieve their business goals.
Begin your 7-day free trial today and take advantage of features such as report automation, white-labelling, and visually appealing client reports.
Published on May 07 2020
WRITTEN BY
Dominyka VaičiūnaitėDominyka is a copywriter at Whatagraph with a background in product marketing and customer success. Her degree in Mass Communications/Media Studies helps her to use simple words to explain complex ideas. In addition to adding value to our landing pages, you can find her name behind numerous product releases, in-app notifications, and guides in our help center.