How to Measure eCommerce Performance with a KPI Dashboard
Tracking key performance indicators for eCommerce is a daily job. The best way to track them efficiently is to use specific eCommerce metrics to help you get an instant and accurate picture. This article will cover the top five eCommerce KPIs, why they're important, and how to use them to enhance your eCommerce site.

Nov 25 2021●10 min read


What Is the Dashboard For?
No matter which eCommerce platform you're using, they all have reporting tools built into them. However, not all metrics can be found there. You will need multiple channels connected to get an accurate picture. That is what the eCommerce KPI dashboard is for.
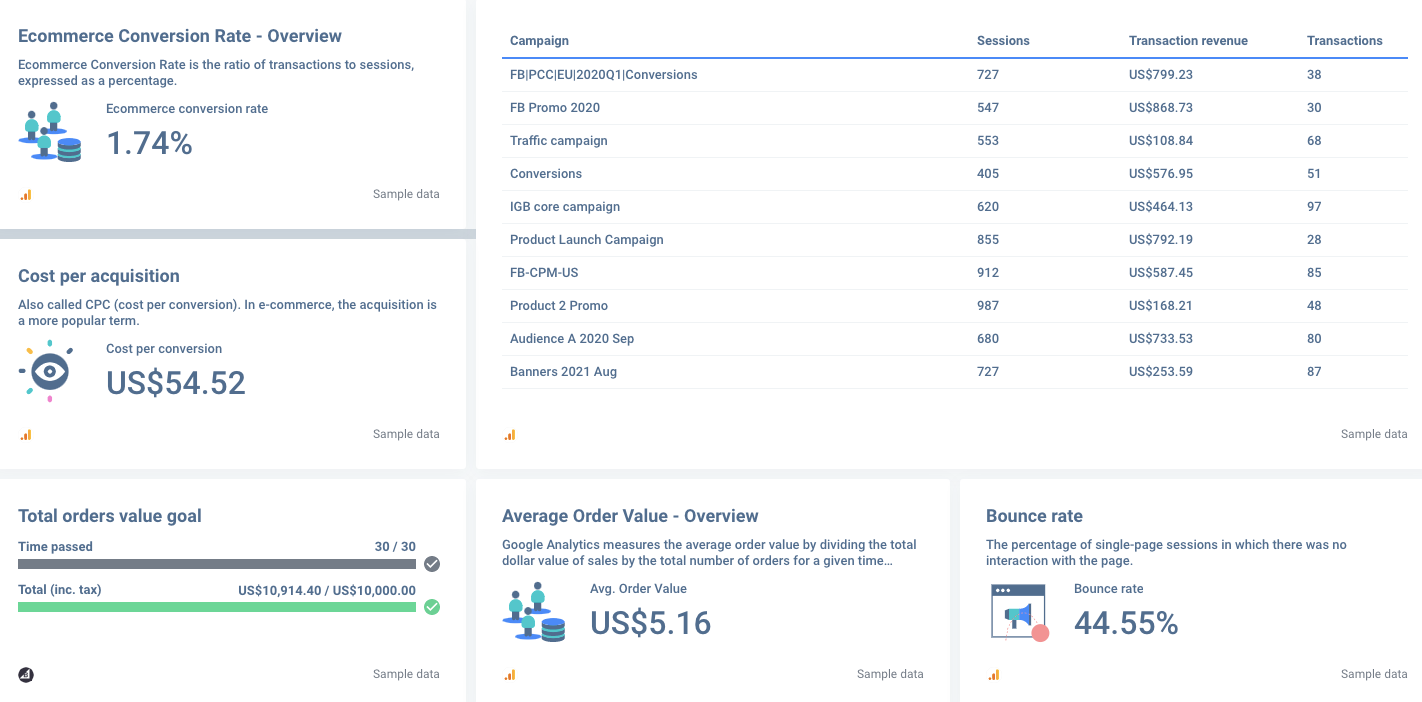
Dashboard example: here, you can see all eCommerce KPIs that determine performance. It's a single-view board: you don't need to log in anywhere else or consolidate data manually. It's a quick look at the situation from all data points that translate into immediate action.
Setting Goals
We will cover the best eCommerce KPIs to use for evaluating your eCommerce store. Before that, you need to keep in mind that every one of these metrics can be set as a goal.
Now, what does that mean? It means that you need to set benchmarks for each numerical KPI. If that KPI meets the benchmark, you can continue as is. If that KPI drops below the benchmark - you need to take action.
For example, your average order value benchmark is $500. Your dashboard shows that over time, this metric fluctuated between $520 to $595. That is good. It meets your benchmark, and you can consider raising it for the next period. However, after a week, you see that the trend is downwards, and now your AOV is between $505 and $475. This means something has changed in your online store or marketing channels and needs to be addressed.
Top 5 KPIs For eCommerce Business
Let's go through the top eCommerce metrics that give you an accurate picture of the health of your eCommerce business.
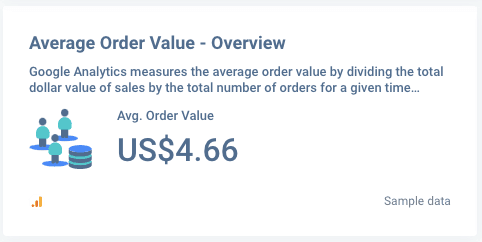
Average Order Value (AOV)
This is the typical amount of money a customer spends on your eCommerce website. It can be applied to the whole store, or you can look at AOV for each category or product group if they have different characteristics.
Why it's important?
The average value of the order can help forecast your total revenue. If it's stable, you will get a pretty good picture of your earnings. It also indicates how your eCommerce store performs in terms of offers and if your customers see the value of your products.
What it reveals?
Apart from giving you the revenue forecast, it also shows how to increase customer spending by optimizing your eCommerce website.
How to improve it?
The best way to raise average order value is to offer customers rewards for spending more. Here are a couple of ways to do this:
- Offer free shipping thresholds. Most eCommerce businesses offer free shipping if the customer buys for a certain sum. To give you perspective, 66% of customers expect free shipping on every online order. So, if your AOV is $100 and your customer is buying for $90, show that free shipping is available from $100. Then prompt similar products or accessories to products that are in the cart, prompting them to close the $10 gap and increase your AOV.
- Offer bundles. Creating offers that exceed your AOV while still giving value to the customer is a great marketing strategy. So, if your AOV is $100, offer two products that cost $55 and $65, respectively. Or run a discount that entices the customer to not miss out on a deal.
Shopping Cart Abandonment Rate (CAR)
This metric shows the percentage of customers who added items to the cart but did not checkout.

Why it's important?
Around 88% of shopping carts are abandoned on average throughout the eCommerce industry. This means that only about 12% of your customer product picks translate into actual sales.
What it reveals?
This metric shows that there may be problems with your eCommerce store. The most common issue is the checkout process: it can be too complicated or lengthy. Another common issue is related to the before-mentioned AOV. If customers see that they don't get free shipping or it doesn't satisfy other values, it can lead to a high abandonment rate.
How to improve it?
Your first order of business is to streamline the checkout process. Here are a few good practices to turn users into repeat customers:
- Don't ask to create an account to make a purchase. It's sure good to have all information on your customers. But if it impedes the checkout process, creating an account should only come as an afterthought. You will still get your customer's email address and other contact information. You can encourage them to sign up for your newsletter or ask if they want to create an account after the checkout.
- When you do ask if the customer wants to create the account, automatically fill out the information they've already put into the purchase fields. Only ask to create a password and use the same email.
- Automatically make shipping and payment address the same. It's a small step, but it removes the repetitive actions your customers have to take. Instead, give an option to change the payment address if needed.
- Add quick payment options. Paying via PayPal or similar platforms is much faster. Consider integrating them into your platform to expedite the checkout process. You can also invest in a reliable eCommerce open source ASP NET platform to customize your shopping cart and provide customers with smoother and more convenient shopping experiences.
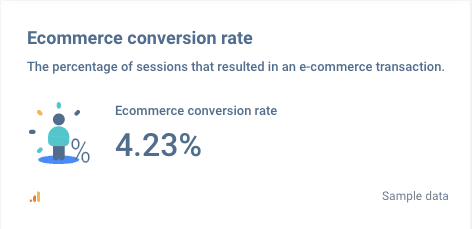
Conversion Rate (CR)
Conversion rate is the number of visitor purchases vs the total number of visitors on your web store.
Why it's important?
Conversion rate showcases how successfully your page can sell to customers that land on it. CR metric can be used on the entire website, or on category pages and even individual product pages. This is especially important if you're running separate marketing campaigns for different categories or types of products.
What it reveals?
CR shows issues that customers encounter while having the opportunity to purchase but don't go through with it. It also indicates if you're attracting the right crowd: i.e. your marketing campaigns bring the right customers.
How to improve it?
- Start with technical issues. Optimize your site speed and checkout process (see for tips above). Evaluate your UI, check if all product pages are loading and your merchandise is displayed correctly.
- Target correct audiences. Go through the metrics of your existing customers. Then compare them with new customers that your marketing efforts are bringing and see if there are discrepancies. If the new customers are not converting, consider retargeting your ads for a more appropriate audience. Also, if you are selling custom merchandise, keep a closer eye on print on demand eCommerce stats and trends as you might discover a new approach to improve the overall results.
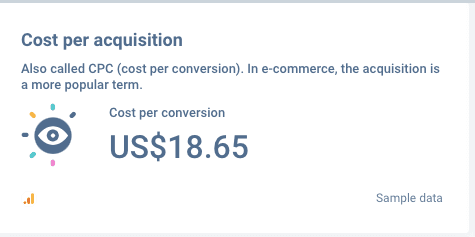
Customer Acquisition Cost (CAC)
Otherwise also known as Cost per Acquisition (CPA). This metric includes all the expenses that bring you a paying customer. It includes advertising costs, shipping costs, site maintenance, salaries, warehousing, etc. Needless to say, CPA shouldn't exceed your AOV.
Why it's important?
You get an immediate picture of the ROI of each purchase. It's the quickest way to determine if your eCommerce business will make the revenue targets and turn a profit.

What it reveals?
A high CAC most often reveals inefficiencies in marketing channels. Broken down by campaign, it shows where your customers are most likely to come from and determines your strongest and weakest acquisition channels. Additionally, it can indicate inefficiencies in your sales process: product pricing vs cost, shipping, warehousing and other processes.
How to improve it?
- Make your ad spend count. Focus on marketing channels that bring the most paying customers. If your Facebook Ads generate the most website traffic and conversions - consider expanding them. If your email marketing campaigns help bring more returning customers - work on them, improve your offers or invest in creative copywriting.
- Review your business processes. Your eCommerce business is a machine, and machines have working orders. High CAC can also stem from one of those processes being more expensive than it should be. If your marketing strategy is working well, consider where you could decrease the customer acquisition cost on the operations side.
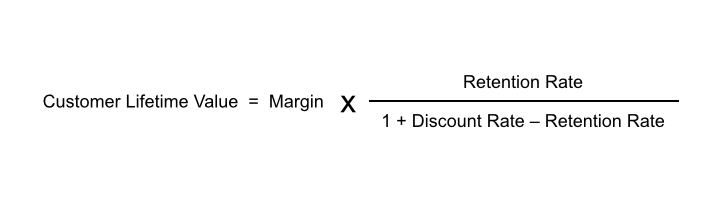
Customer Lifetime Value (CLV)
Customer lifetime value is defined as the total business value over the total period of the customer purchasing from you.
Why it's important?
The fact is, getting an existing customer to spend again is cheaper than acquiring new ones to try your product for the first time. 65% of purchases in the eCommerce business come from existing customers.
What it reveals?
Low customer lifetime value shows issues with customer retention rate (another eCommerce metric you should consider). This means there are reasons your customers don't stay with you: they can find better deals with your competition, they don't see the value for repeat purchases, they're unhappy with the customer service and so on. If your CLV is low and your CAC is high, it means you really need to work on customer loyalty.
How to improve it?
- Offer value. One way to improve CLV is to offer your customers tailored deals. Utilize your email marketing to send offers based on past purchases. Add the option to notify customers when a product becomes available. Offer bundles that loyal customers can purchase if they return to your store.
- Research your competition. Pay attention to other eCommerce retailers and offers they have. See if you can make better offers: better discounts, faster delivery, wider selection, etc.
- Gather feedback. Customer satisfaction is a part of keeping high CLV. Ask your customers (by vote, writing a review or live chat) how they find your online store and what can be improved. If your customer feels heard, it will drastically increase customer loyalty.
Tools For eCommerce Metrics
We have a lot of complex eCommerce metrics here. They all intertwine and are related to one another. The most accessible platform to monitor them all in one place is Whatagraph. It's as simple as connecting all the sources:
- Your eCommerce platform of choice, like BigCommerce, WooCommerce and the like;
- Data gathering tools like Google Analytics, Google Search Console, Google Tag Manager, Google My Business - all free too!
- Other marketing channels, like social media, email marketing apps like Klaviyo, MailChimp and others.
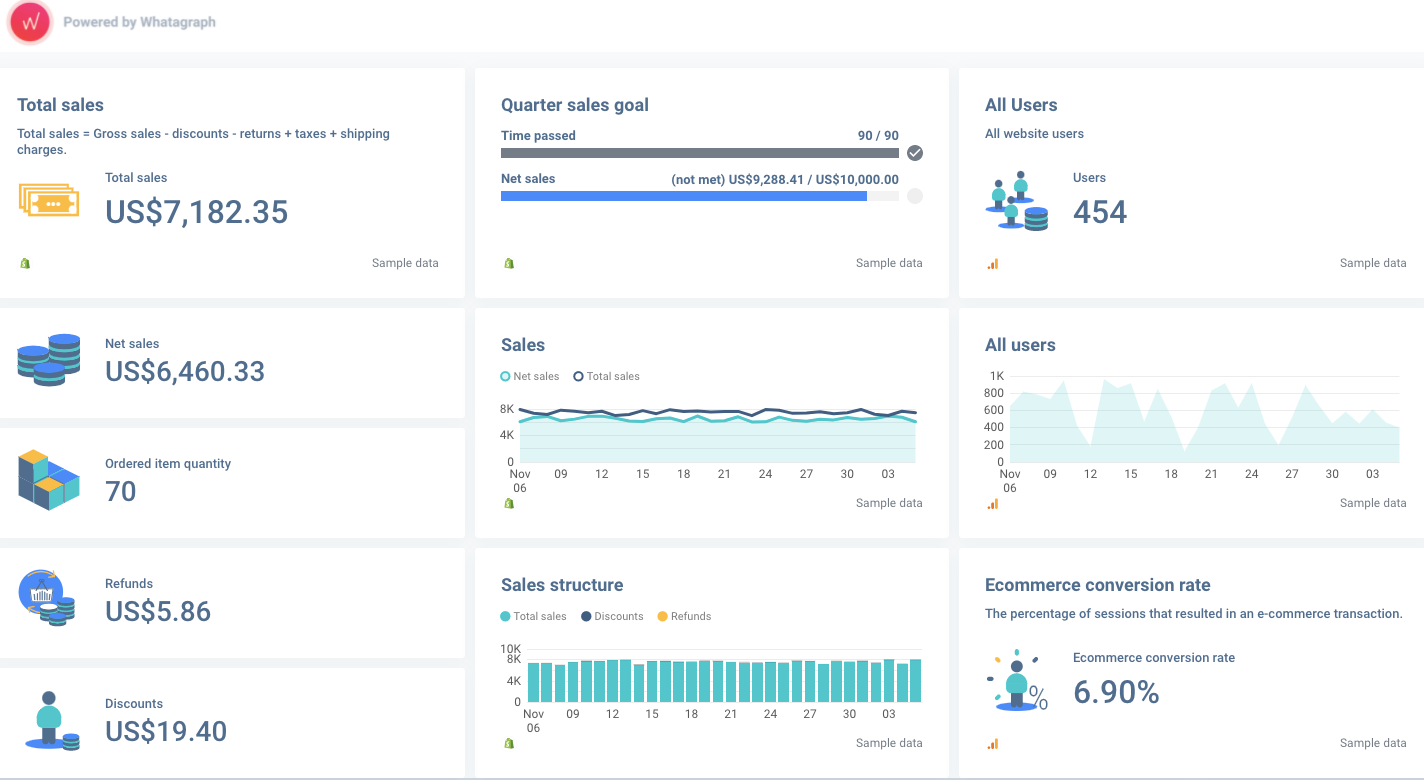
Dashboard example: Here is an example of an eCommerce dashboard with Shopify and Google Analytics 4 channel integrations. Here you can see more retrospective data: sales, revenue, trends over time, user information and others.
If you feel that's too big - start with the Google Suite. It will give you an excellent start to understand where your website traffic is coming from and monitor basic e-commerce sales metrics.
Published on Nov 25 2021
WRITTEN BY
Indrė Jankutė-CarmaciuIndrė is a copywriter at Whatagraph with extensive experience in search engine optimization and public relations. She holds a degree in International Relations, while her professional background includes different marketing and advertising niches. She manages to merge marketing strategy and public speaking while educating readers on how to automate their businesses.