5 Ways To Highlight Ecommerce Sales Growth and ROI With End of Quarter Reporting
Whether you’re an ecommerce business owner looking for investment, or a sales and marketing leader pitching for a bigger budget, you’ll need to show evidence of recent growth and a positive return on investment.

Jan 24 2023●10 min read


As well as continuously tracking the relevant KPIs, you can highlight this information in your end-of-quarter reports. It’s the perfect opportunity to demonstrate sales growth and prove ROI—without having to wait until the end of the financial year to do so.
Ecommerce enjoys a high volume of transactions and is subject to seasonal fluctuations, market trends, and customer behavior. Quarterly reporting is essential for making smarter, faster decisions based on the latest figures, not only highlighting current success but revealing opportunities for further growth.
In this post, we’ll look at what goes into an end of quarter report for ecommerce companies, the benefits of quarterly reporting, and how financial reporting can help you to highlight sales growth and ROI.
Understanding quarterly financial reports
In ecommerce, it’s impossible to succeed without a sound understanding of your numbers. While annual reporting is important, quarterly financial reports enable everyone to see the company’s performance status on a regular basis.
These reports reveal to you how much revenue you’ve earned over the past three months, how much cash you’re likely to have available in subsequent quarters, and how closely your actual budget matched your original predictions.
Of course, you’re aiming for a solid financial performance across the whole year, but breaking it up into quarters helps you see which periods were more successful—and why. This shows you which activities are driving ecommerce sales.
By providing insight into ecommerce performance, quarterly reports help investors and analysts judge the company’s financial health. They are often accompanied by presentations, where KPI data is presented to stakeholders.
What’s in a quarterly report?
Quarterly reports include key financial documents such as income statements, balance sheets, and cash flow statements. They show things like gross revenue, net profit, operational expenses, and taxes, allowing you to spot patterns and trends as well as prove growth and ROI.
You can break down the report into sales figures per product type, channel, or customer segment. This will show the percentage by which sales rose compared to the same period last year, translating to a percentage increase. You might also highlight details such as conversion rates and what factors affected them.
Alongside financial statements, end of quarter reports typically include an executive summary, highlights or milestones, and future goals and objectives. They may also provide year-to-date figures and comparisons between different quarters.
It’s crucial to gather financial and performance data from all possible sources to ensure that the quarterly report is fully comprehensive. It’s helpful to include visual representations like charts and graphs and to use headings and subheadings to define exactly what the report is showing.
The importance of quarterly financial reports
Quarterly financial reports keep you up to date on your progress, help you stay organized when it comes to tax season, and enable you to make better decisions. Let’s take a closer look at why they’re so important for an ecommerce business:
Allows store owners to compare growth per quarter
As we mentioned, quarterly reporting breaks down the year into sections and makes it easier to see precisely where sales growth happened. It enables you to compare one quarter with another—which means that if one period has performed better or worse, you can quickly figure out why.
For example, if sales in Q3 were higher than in Q1 and Q2, that might be due to seasonality. Were you selling beachwear or sunblock? That’s why you saw a spike in July and August, and you’ll know to expect a drop-off in the winter months. External economic factors might also be responsible for a peak or a trough.
Plus, if you only looked at overall figures for the year and they were slightly lower than expected, you might be concerned. But by looking at the individual quarters, you can see that this was entirely due to a supply chain issue in Q2, while the other quarters performed as expected. (This also means that you can plan for such eventualities in the future.)
Provides a big picture of an ecommerce store’s accounts
Another benefit of quarterly reporting is that it helps you build an overview of your performance across all departments and channels, bringing together relevant data in one convenient document. In this way, everyone develops a better understanding of performance and the factors that affect it.
Quarterly financial statements will tell you how much cash is available to spend on growing the business, as well as fulfilling your payment and tax obligations. Instead of waiting until year-end to review performance, ongoing insights tell you quickly if there’s a blip—and you can act to reverse a negative trend.
With enough ecommerce data and the right small business accounting software, you can produce reliable end of quarter reports that combine financial statements with reports on inventory, product performance, and customer behavior. You should also mention any significant events or activities that impacted sales performance or other KPIs.
Shows areas of growth and development
You know the business is growing, but you can’t leave it at that and hope the trend continues. You need to know exactly where that growth is coming from, and you need to know as soon as possible so that you can direct more money toward the activities that boost revenue.
Suppose you’ve seen an increase in sales conversion rates and average order value. In that case, quarterly reports can tell you whether it was driven by a specific demographic, crazy sales on Black Friday, or increased spend on marketing campaigns. They also reveal the areas where you could improve.
The reports can also include an analysis of ROI from different platforms and campaigns, showing that you’re using effective methods and ensuring continued funding. If you’re seeking investors, financial statements help to prove your worth.
Can be used in financial forecasting
By looking at how much you spent and earned in this quarter, you can predict your likely spend and income in subsequent quarters. This makes it easier to set a suitable budget, not just for the next quarter but for the year to come.
Reporting also helps you plan how much to put aside ready for tax season, especially if you’re a business owner and you need to pay self-employment or self-assessment taxes.
Accurate forecasting is essential for everything from the amount of inventory you buy to the marketing campaigns you run. The more often you generate financial statements, the more historical data you’ll have for future forecasts.
Later, you can compare your quarterly predictions with the actual results. Accounting for factors like seasonality, you’ll be able to see how accurate you were—and use the insights to make adjustments.
5 ways to highlight growth with end of quarter reports
As well as providing clarity about your financial performance, your end of quarter reports offer several ways to demonstrate growth and ROI.
1. Include income statement
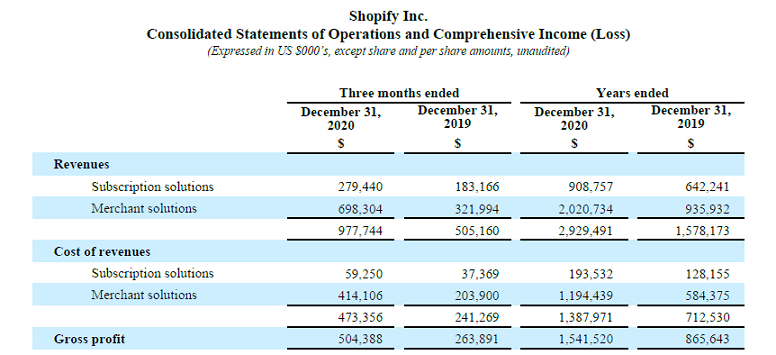
Your income statement (also known as a profit-and-loss statement or earnings statement) is one of three key financial documents produced by your accountant. We’ll cover the others in a moment, but it’s important to include all three in your quarterly report.
Basically, the income statement tells you how much money your ecommerce business is earning by subtracting expenses from revenue. By breaking down and comparing your sales channels and marketing activities, you can use it to understand which areas are making a profit.
Because this statement shows sales and expenses over time, it helps you to identify trends, track specific KPIs, and predict future performance.
2. Include cash flow statement
The cash flow statement records your revenues and expenses—or how much money is flowing in and going out of your business over a period of time. It goes without saying that if revenue is higher than expenses, your business is growing!
By including this in the quarterly report, you can look more closely at the reasons for this growth and compare different quarters. This will help you make decisions, such as launching new products, removing those that cost too much to produce, or taking on new employees.
As well as showing you the current status, this statement allows you to predict cash inflows and outflows to see how much money you’re likely to have available for the next quarter.
3. Include balance sheet
A balance sheet is a snapshot of your financial position at a given point, in this case, the end of a quarter. It shows your assets (what you own), liabilities (what you owe), and shareholder equity in order to evaluate what your business is worth.
Assets go in the left-hand column, and liabilities and equity go in the right-hand column. The sum of the left-hand column should be the same as the sum of the right-hand column, meaning the sheet is “balanced.” You can also compare past balance sheets and track these figures over time to see how the business is growing.
4. Utilize data visualization for easier understanding
Whether you’re sharing the quarterly report with your team, management, shareholders, potential investors, or even the general public, it needs to be easy to understand. The data should also be fast to absorb since some of the recipients will only be skimming through the report.
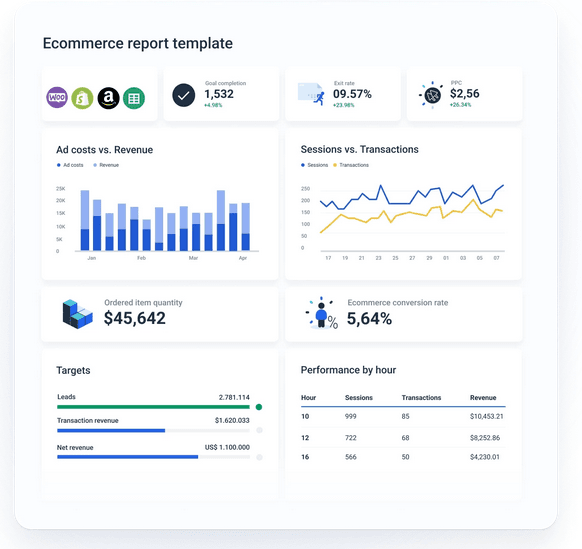
With this in mind, it’s a good idea to use data visualization, presenting the information through charts, graphs, and infographics. For example, you can make charts to show how much was spent each month, and how much revenue was raised from different channels, products, demographics, and campaigns. This makes it easier to see growth and ROI at a glance.

Apart from presenting the data in an interesting and informative way, creating reports with easily readable fonts and layouts makes sense. Think about the best colors to use, and consider adding your own branding, especially if it’s a report anyone outside of the company will view. You can download free financial reporting templates here.
5. List a timeline of highlights and achievements
The quarterly report is an excellent time to share and celebrate your achievements over the past three months. Of course, you’ll be doing that through the general information, especially if the financial statements show an increase in revenue. But you can also include a timeline in the report to visually highlight specific milestones, targets, and achievements.
This will be a record of the most successful things that happened during the quarter. Did your sales team exceed their targets each month? Was there a special offer that attracted a record number of website visitors? Did your marketing strategy pay off?
Maybe you launched a new product line or acquired a new brand. Perhaps you successfully teamed up with an influencer or saw a rise in AOV. Pointing out these achievements helps to demonstrate your growth.
Conclusion
End of quarter reports are essential for monitoring and understanding business performance, especially in the fast-moving world of ecommerce. Rather than waiting until the end of the financial year to see how you’ve done, you can celebrate your growth every three months.
These reports also let you compare your profits and performance against other quarters, and against the same period last year. This makes forecasting a whole lot easier—and more accurate. You can set a budget and identify opportunities for further growth, in the knowledge that there’ll be enough revenue and cash flow to support your activities.
Quarterly reports are also useful when it comes to handling your taxes or dealing with audits. If you use the right software, you can create financial statements automatically in a matter of minutes and combine them with your other ecommerce metrics for a comprehensive report.
Ready to start creating your own ecommerce reports? Sign up for your free trial of Whatagraph and create your next report in less than minutes!
Published on Jan 24 2023
WRITTEN BY
Mile ZivkovicMile is the ex-Head of Content at Whatagraph. A marketing heavy with almost a decade of SaaS industry experience, Mile has managed multiple content marketing teams without losing an ounce of his writing passion.