5 Types of Business Reports
Business reports are invaluable, no matter the type or size of your business or enterprise. The information they provide can help you see what is working in your company and what isn’t, so that you can make adjustments and improvements.

Oct 30 2019●8 min read


What Are Business Reports?
Business reports are actual documents that inform by summarizing and analyzing a particular situation, issue, or facts and then make recommendations to the group or person asking for the report. The goal of these reports is usually one of the following:
- To examine potential and available solutions to an issue, situation, or problem
- To apply business and management theories to produce different suggestions for improvement
- To show your evaluation, reasoning, and analytical skills in recognizing and considering possible solutions and outcomes
- To make conclusions about an issue or problem
- To produce a range of suggestions for future action
- To present clear and concise communication skills
Keep in mind that with business reports, you’ll get several possible solutions instead of just one. Your job would be to identify and weigh-up the cost and benefits of each solution for the organization in the form of a business report.
How to Write a Business Report?
A business report uses headings and subheadings, as well as tables, diagrams, and bullet points, if needed, to make the data easy for the reader to understand. The main function of the report is to communicate relevant information and facts clearly, quickly, and efficiently. Don’t forget the target audience while writing the report – is it aimed only for the CEO or the entire staff? This will help you adopt the right level of formality, objectivity, fairness, and sensitivity.
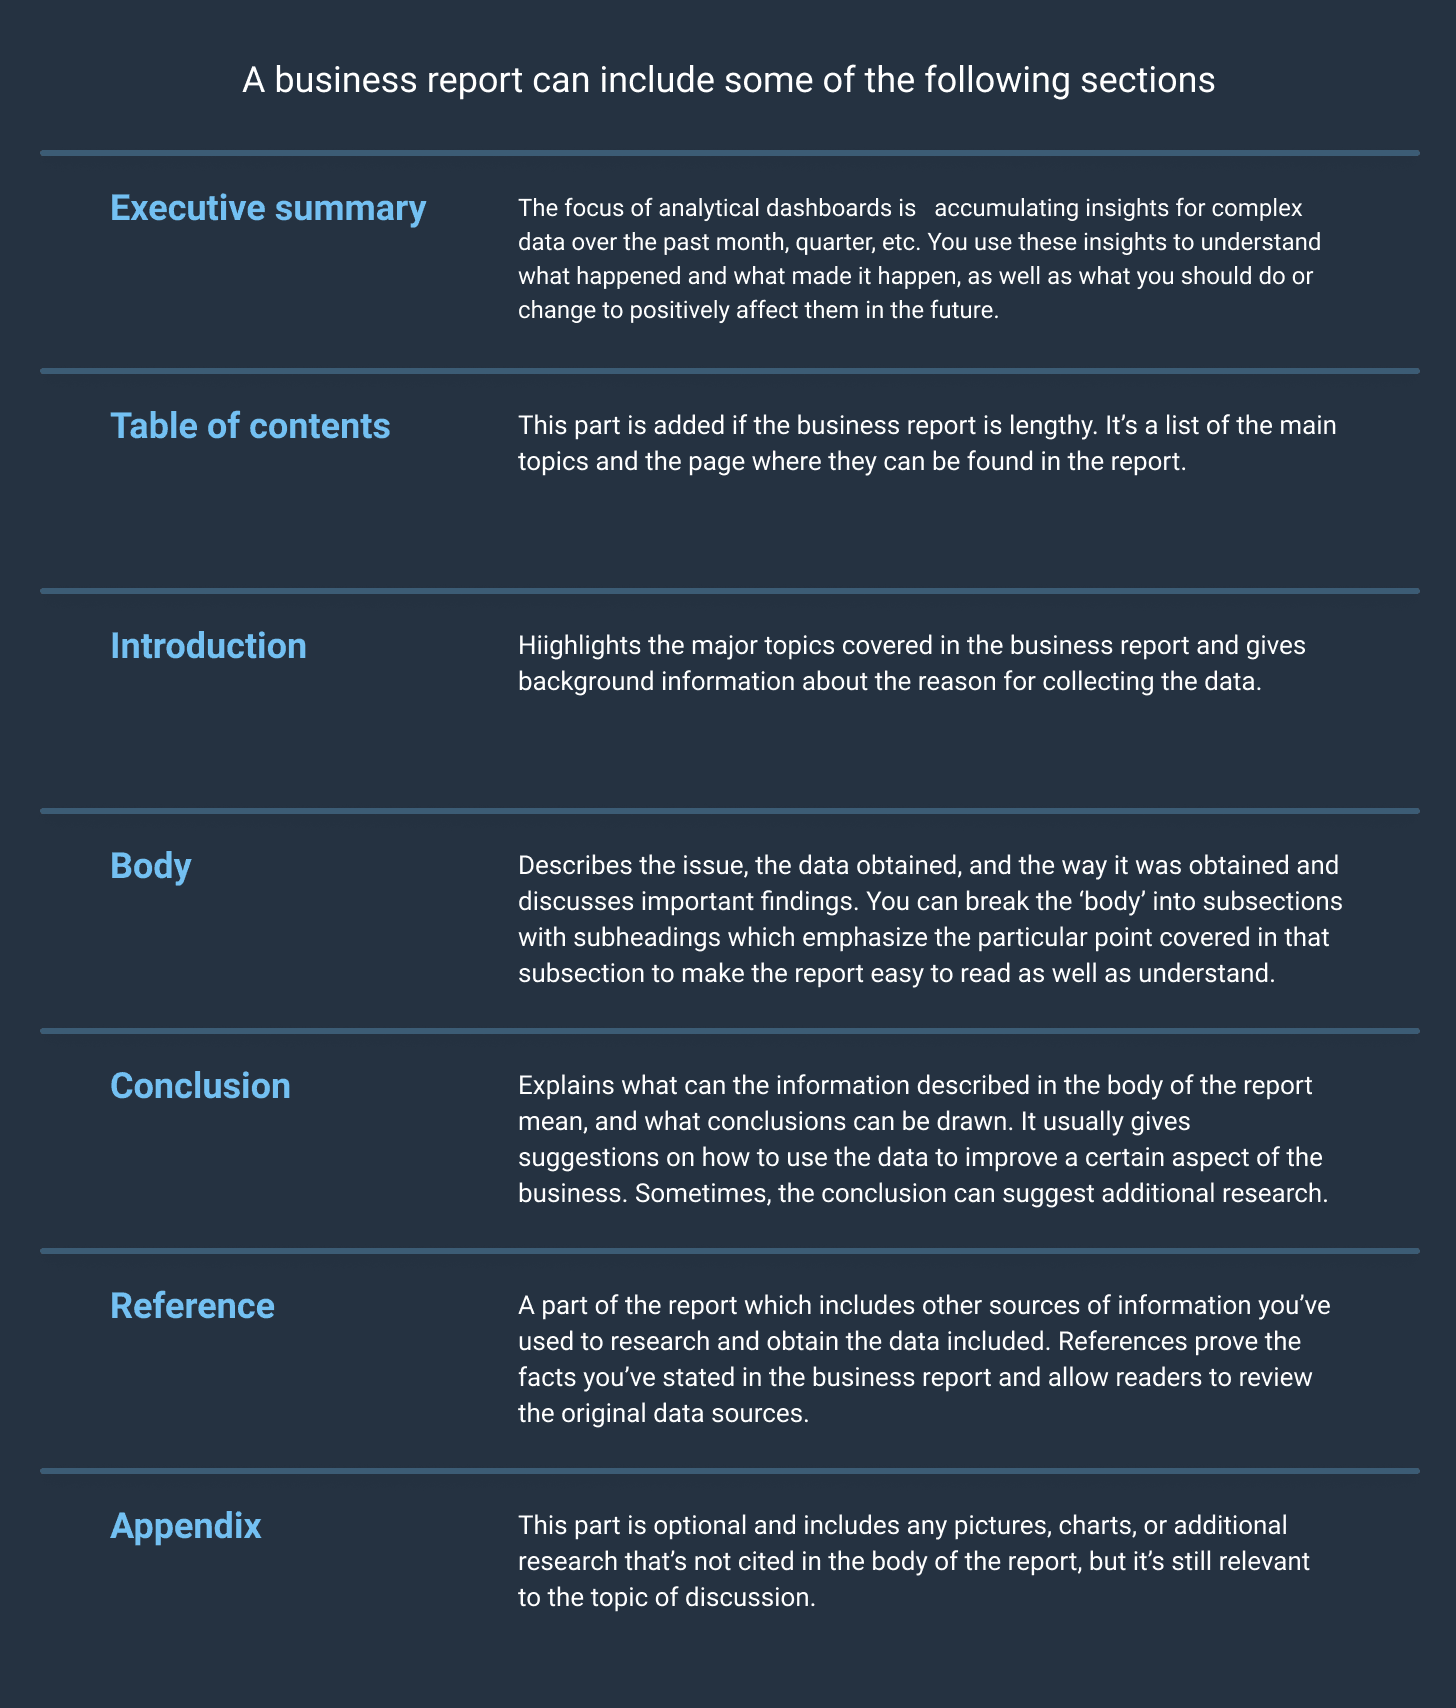
A business report can include some of the following sections:
What Are the Types of Business Reports?
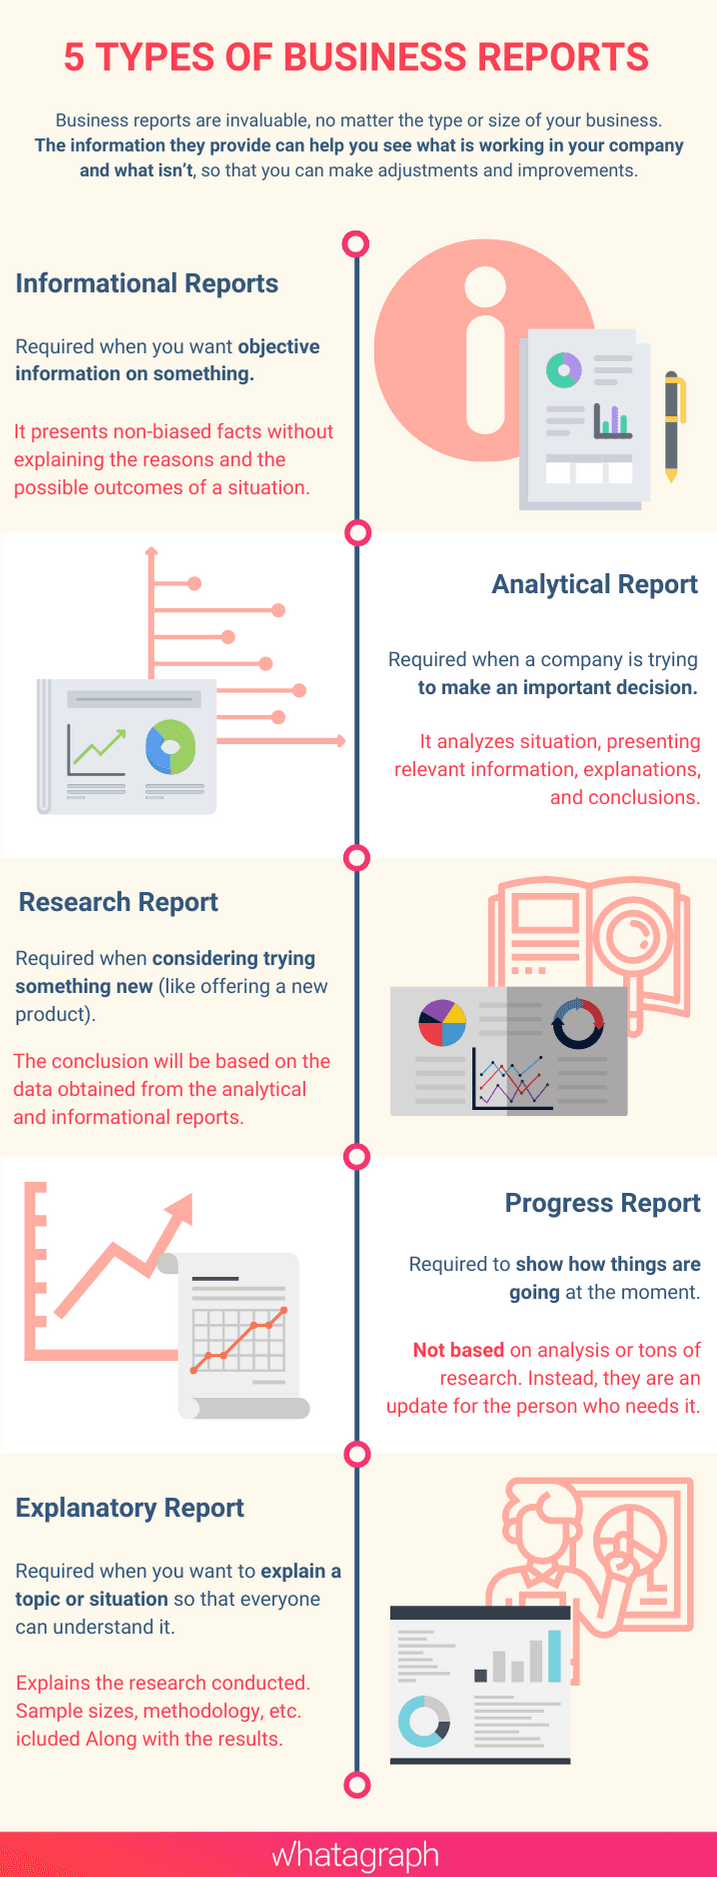
There are five main types of business reports: informational reports, analytical reports, research reports, explanatory reports, and progress reports. Depending on the data turnaround, different teams within a company can decide how often they need to create business reports — daily, weekly, bi-weekly, monthly, or annually.
Informational Reports
You ask for this report when you want objective information on something. It presents non-biased facts without explaining the reasons and the possible outcomes of a situation. It is the ideal business report for learning things such as the number of employees, the role each of them plays in the company, or the departments the employees work in.
Analytical Report
This type of business report is usually required when a company is trying to make an important decision. An analytical report analyzes the company’s situation, presenting relevant information, explanations, and conclusions. It helps the company to make good decisions going forward.
Research Report
This is the most comprehensive type of business reports required when a company considers trying something new, such as going into a new geographical area, offering a new product, or using advanced tools for bulk URL analysis. If you're exploring new businesses, this type of report can provide valuable insights.
A team of specialists or researchers are given a topic and asked to find all the relevant statistics and details obtained from an informational report, followed by a detailed analysis of the data found in the analytical report. The conclusion of the research report will be based on the available data obtained from the analytical and informational reports.
Explanatory Report
This report is required when you want to explain a topic or situation so that everyone can understand it. For example, you can write it to explain the research you’ve conducted. Along with the table showing the results, you should include the reason for the research, sample sizes, methodology, etc. After explaining the results, you should briefly summarize the findings.
Progress Report
You want this report to show how things are going at the moment. A progress report isn’t based on analysis or tons of research. Instead, they are an update for the person who needs it. One example of this could be a weekly report disclosing the progress made throughout the week and what tasks you're looking to work on in the upcoming week.
To Sum Up
Every business or enterprise needs business annual reports to see how things are working right now, and what adjustments can be done to improve the situation. They provide a summary or analysis of a particular situation or issue and give specific recommendations for further improvement. You should know how to write a business report to ensure the best results, as well as choose the right type of report you need for every situation.
Published on Oct 30 2019
WRITTEN BY
Indrė Jankutė-CarmaciuIndrė is a copywriter at Whatagraph with extensive experience in search engine optimization and public relations. She holds a degree in International Relations, while her professional background includes different marketing and advertising niches. She manages to merge marketing strategy and public speaking while educating readers on how to automate their businesses.