8 Google Analytics Ecommerce Dashboards
While you can drill through traffic data with custom reports without any constraints, the dashboard report format is report summaries, which include a maximum of 12 boxes or widgets.

Apr 04 2020 ● 3 min read
- 1. Mobile Google Analytics Ecommerce Dashboard
- 2. Perfect Dashboard for Ecommerce Revenue
- 3. ResponseTap Google Analytics Ecommerce Dashboard
- 4. SEO Dashboard - Discovering Top Content and Keyword
- 5. All-in-one Google Analytics eCommerce Dashboard
- 6. Social Media Google Analytics Dashboard
- 7. Email Google Analytics Ecommerce Dashboard
- 8. Engagement, Loyalty and Traffic Growth GA Ecommerce Dashboard
- Conclusion
Data is highly relevant when it comes to making an informed decision, most notably within the eCommerce context.
However, it always requires a considerable amount of time to sieve through the volume of data in Google Analytics.
Two options whereby you can easily navigate critical metrics are -
Custom reports and dashboards.
Below are 8 Google Analytics Ecommerce Dashboards you can use.
1. Mobile Google Analytics Ecommerce Dashboard
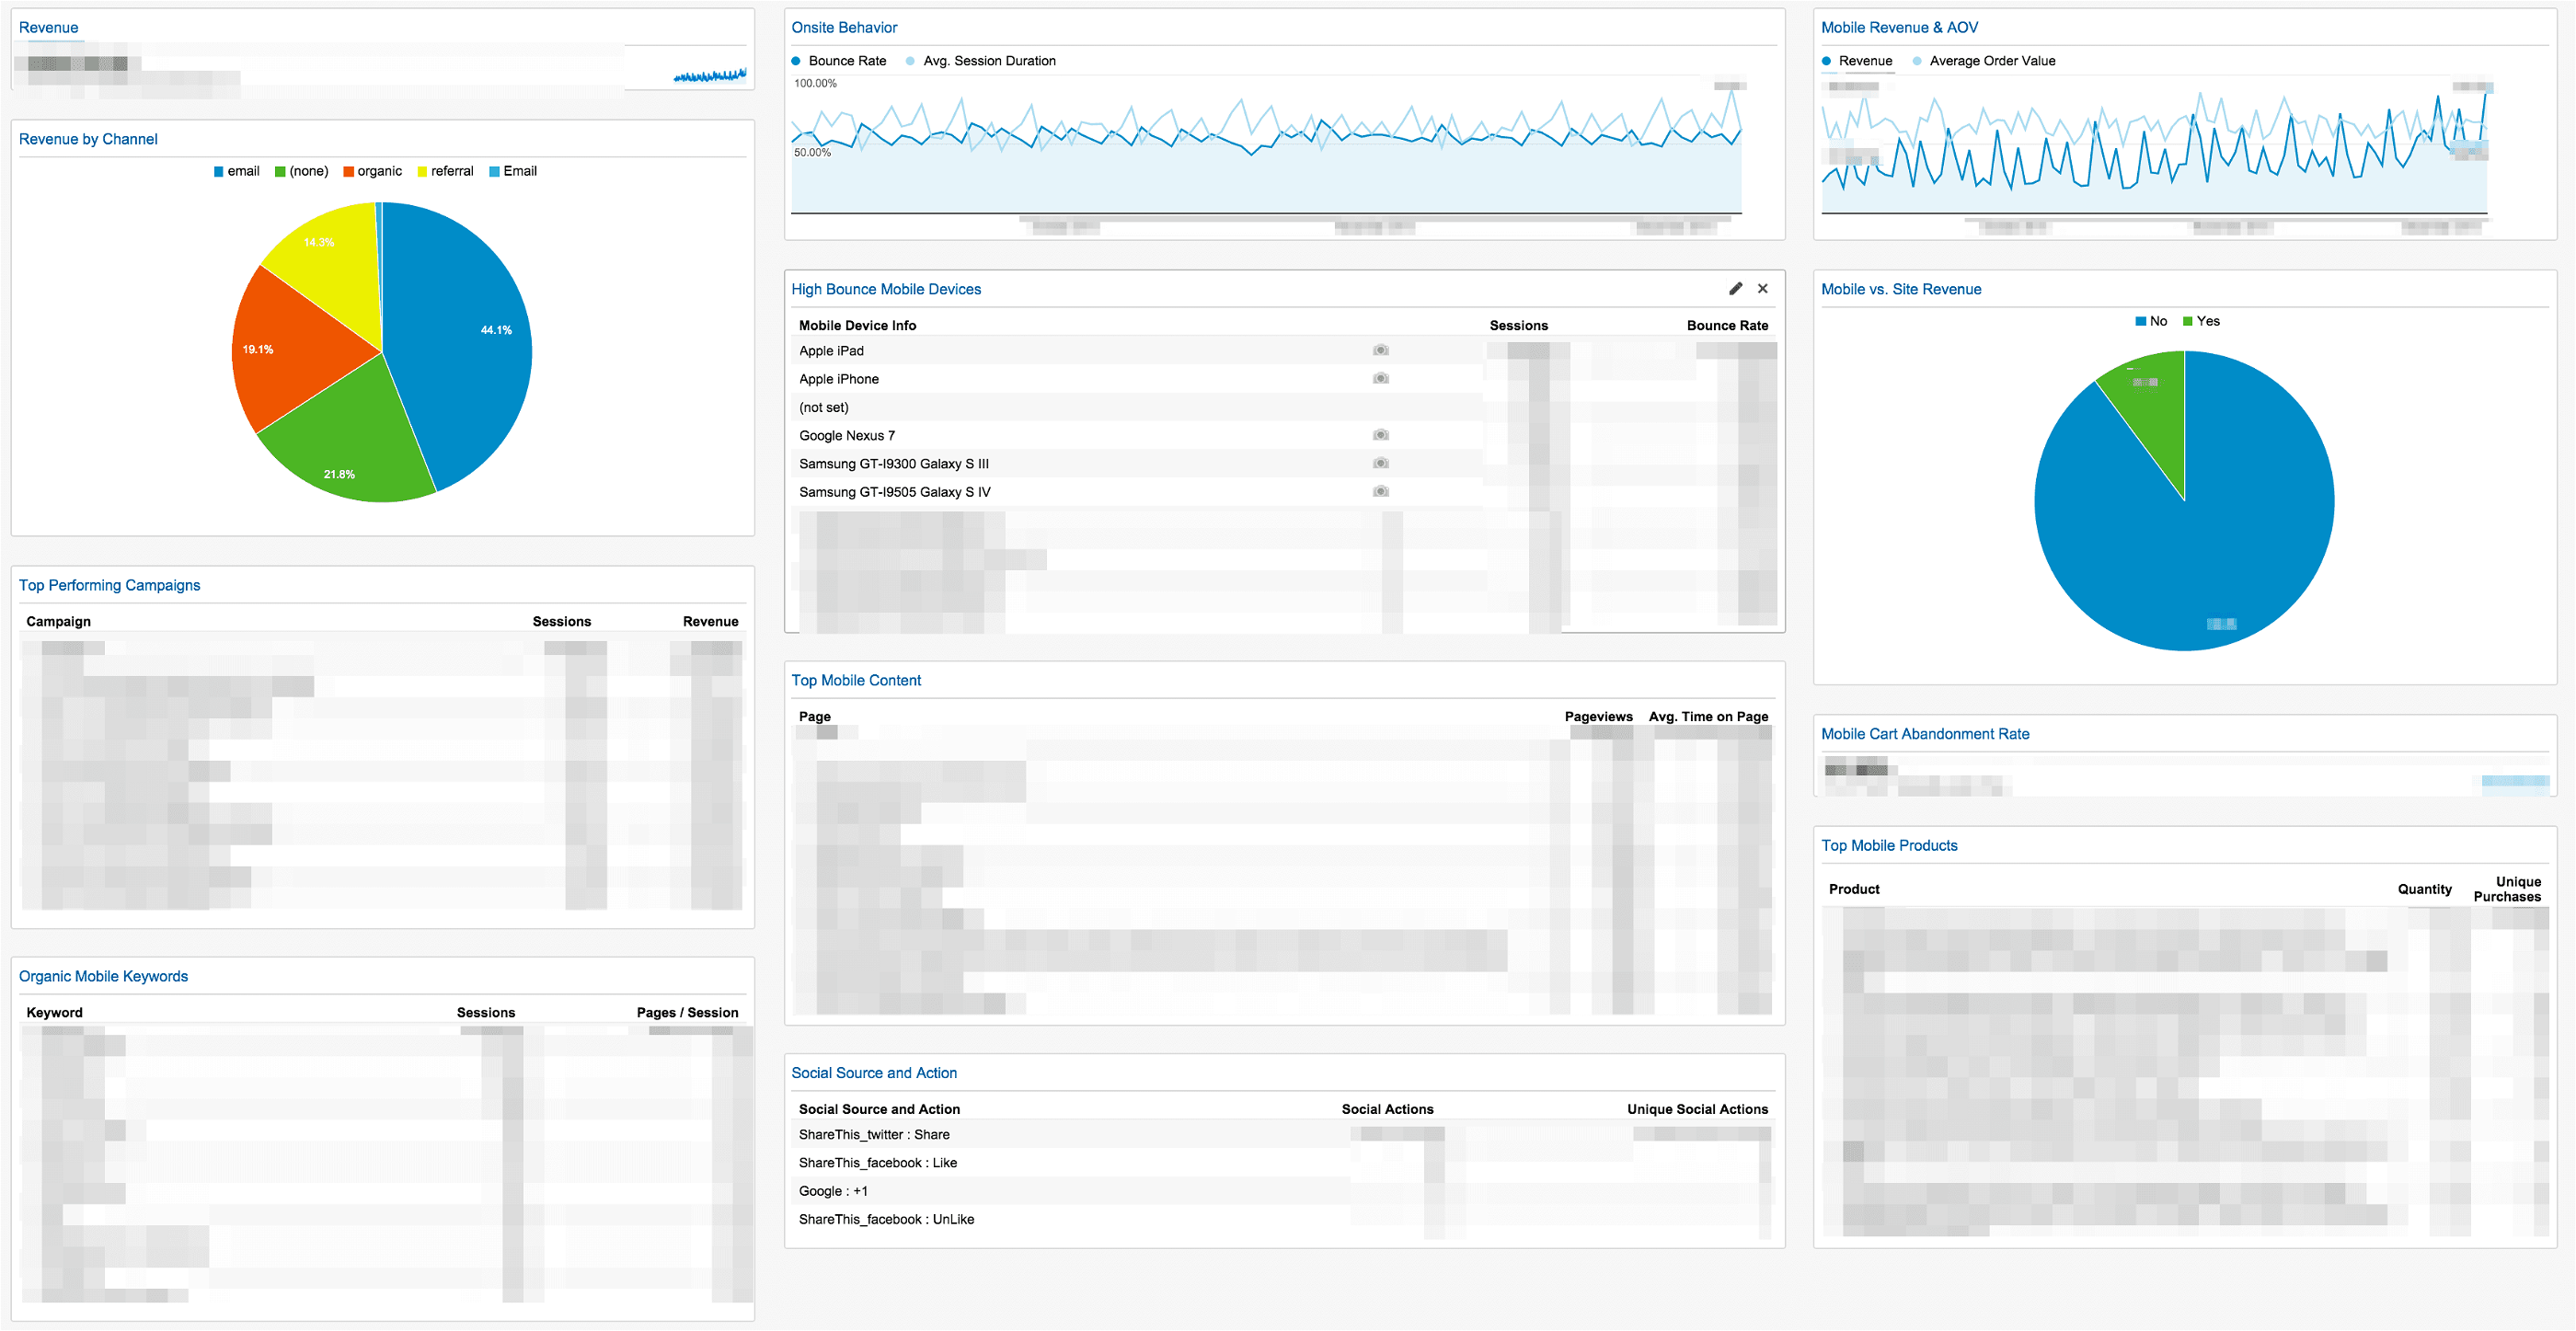
This dashboard, created by Justin Cutroni, maximizes all the 12 boxes and offers both mobile and tablet ecommerce data, which you can quickly grasp.
Here are some top widgets which you can customize:
- Top Mobile Content in which you can utilize accessible pages on tablet and mobile devices.
- High Bounce Mobile Devices which help you detect devices that may possess adaptive and responsive issues.
- Mobile Revenue/Average order Value helps you to know how your content is being shared on social media across tablets and mobile devices.
- Mobile Revenue Vs. Site Revenue- a pie chart that depicts the share of aggregate revenue on mobile.
- Mobile-Cart Abandonment rate enables you to identify abandonment rates on a cart across mobile devices and tablets.
2. Perfect Dashboard for Ecommerce Revenue
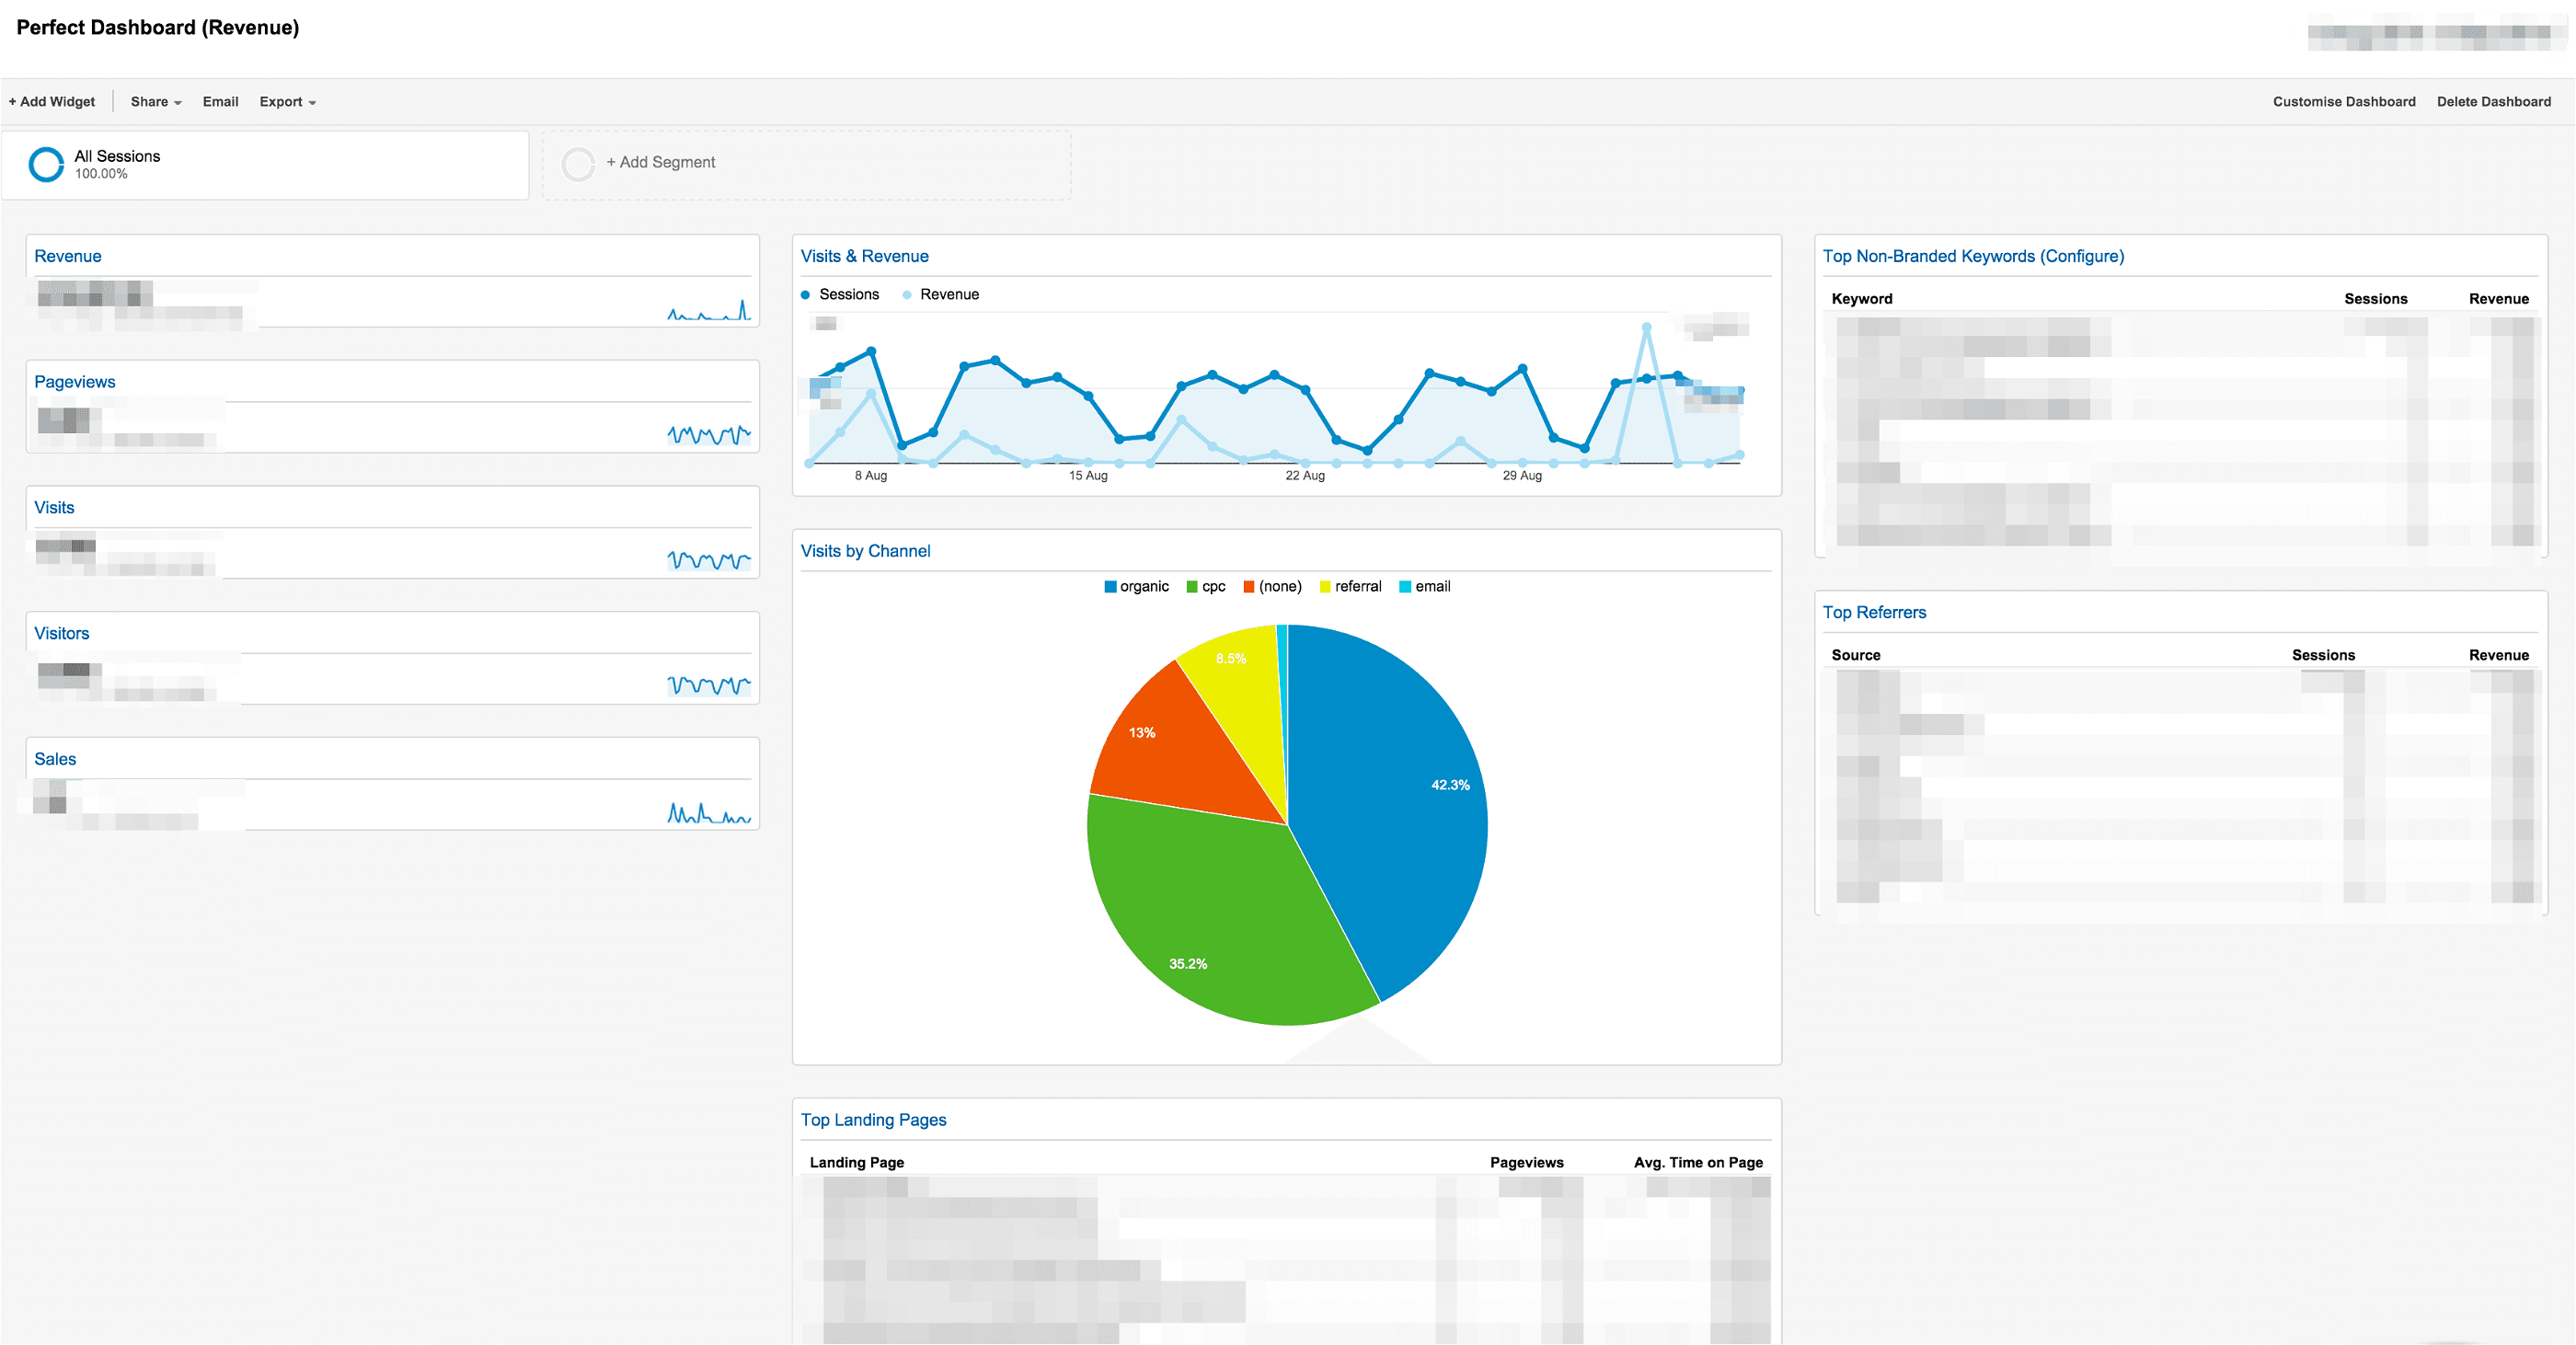
This ecommerce dashboard is created by Portent.
- You can access the following key metrics:
Pageviews, Revenue, Sales, and Visit. - It also has Visits & Revenue and a channel-referral pie chart.
- Its top landing pages table is highly efficient as it depicts top landing pages arranged by the average time view spent on the site, as well as page views.
3. ResponseTap Google Analytics Ecommerce Dashboard
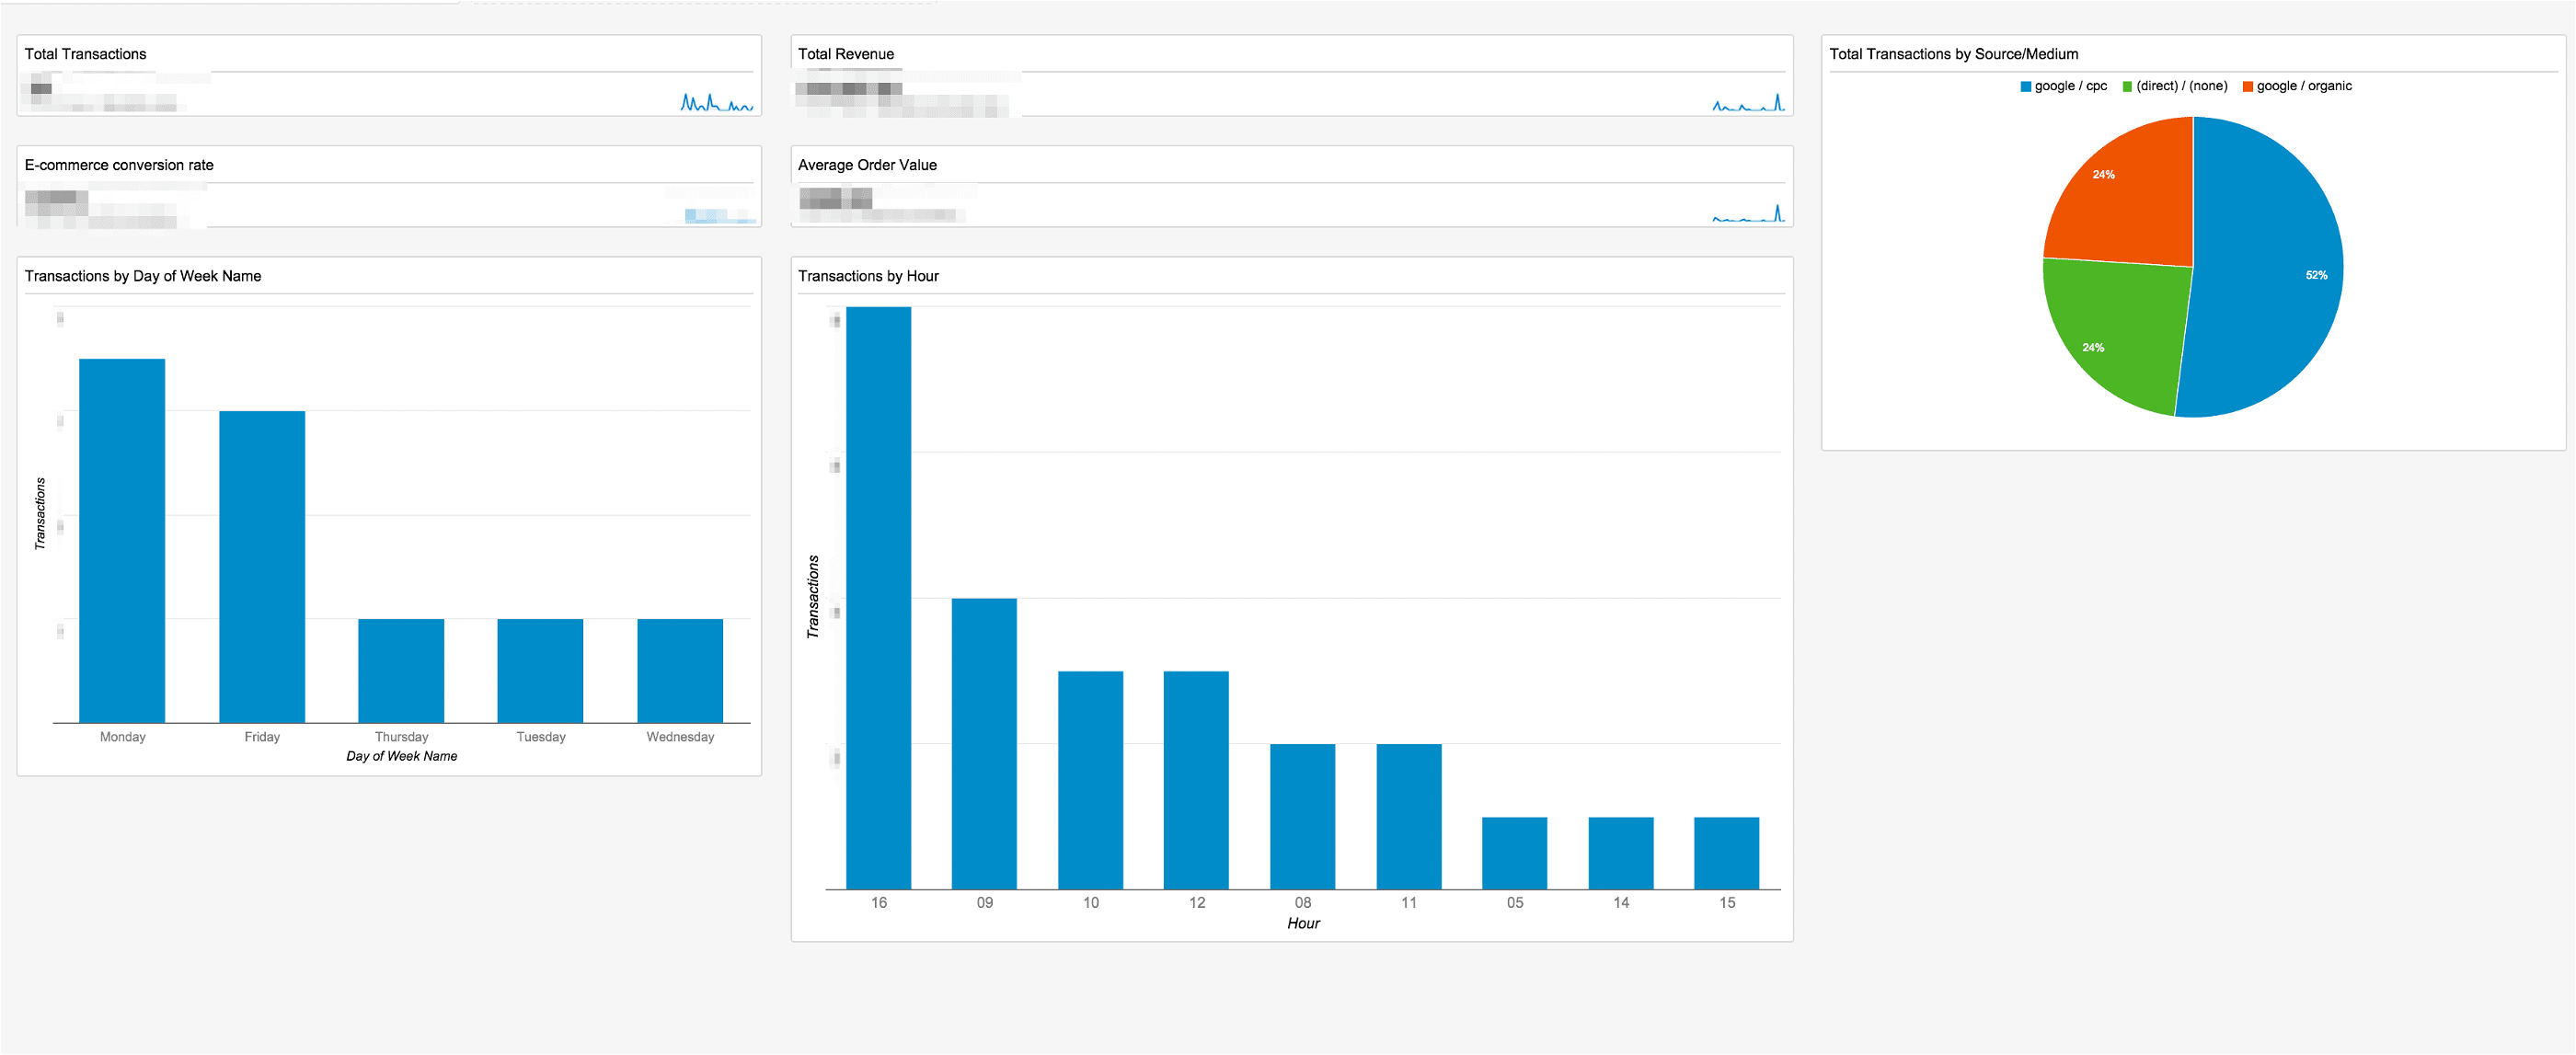
This dashboard is created by ResponseTap.
This quick-to-grasp eCommerce dashboard deals with transaction metrics.
Notable ones are 'Transactions by the Day of Week Name' Bar charts, which showcase transactions by weekdays as well as the 'Transactions by hour' widget, which depicts transaction details by each hour of the day.
You can utilize this dashboard to apportion more live chat assets over active periods generated by this report.
4. SEO Dashboard - Discovering Top Content and Keyword
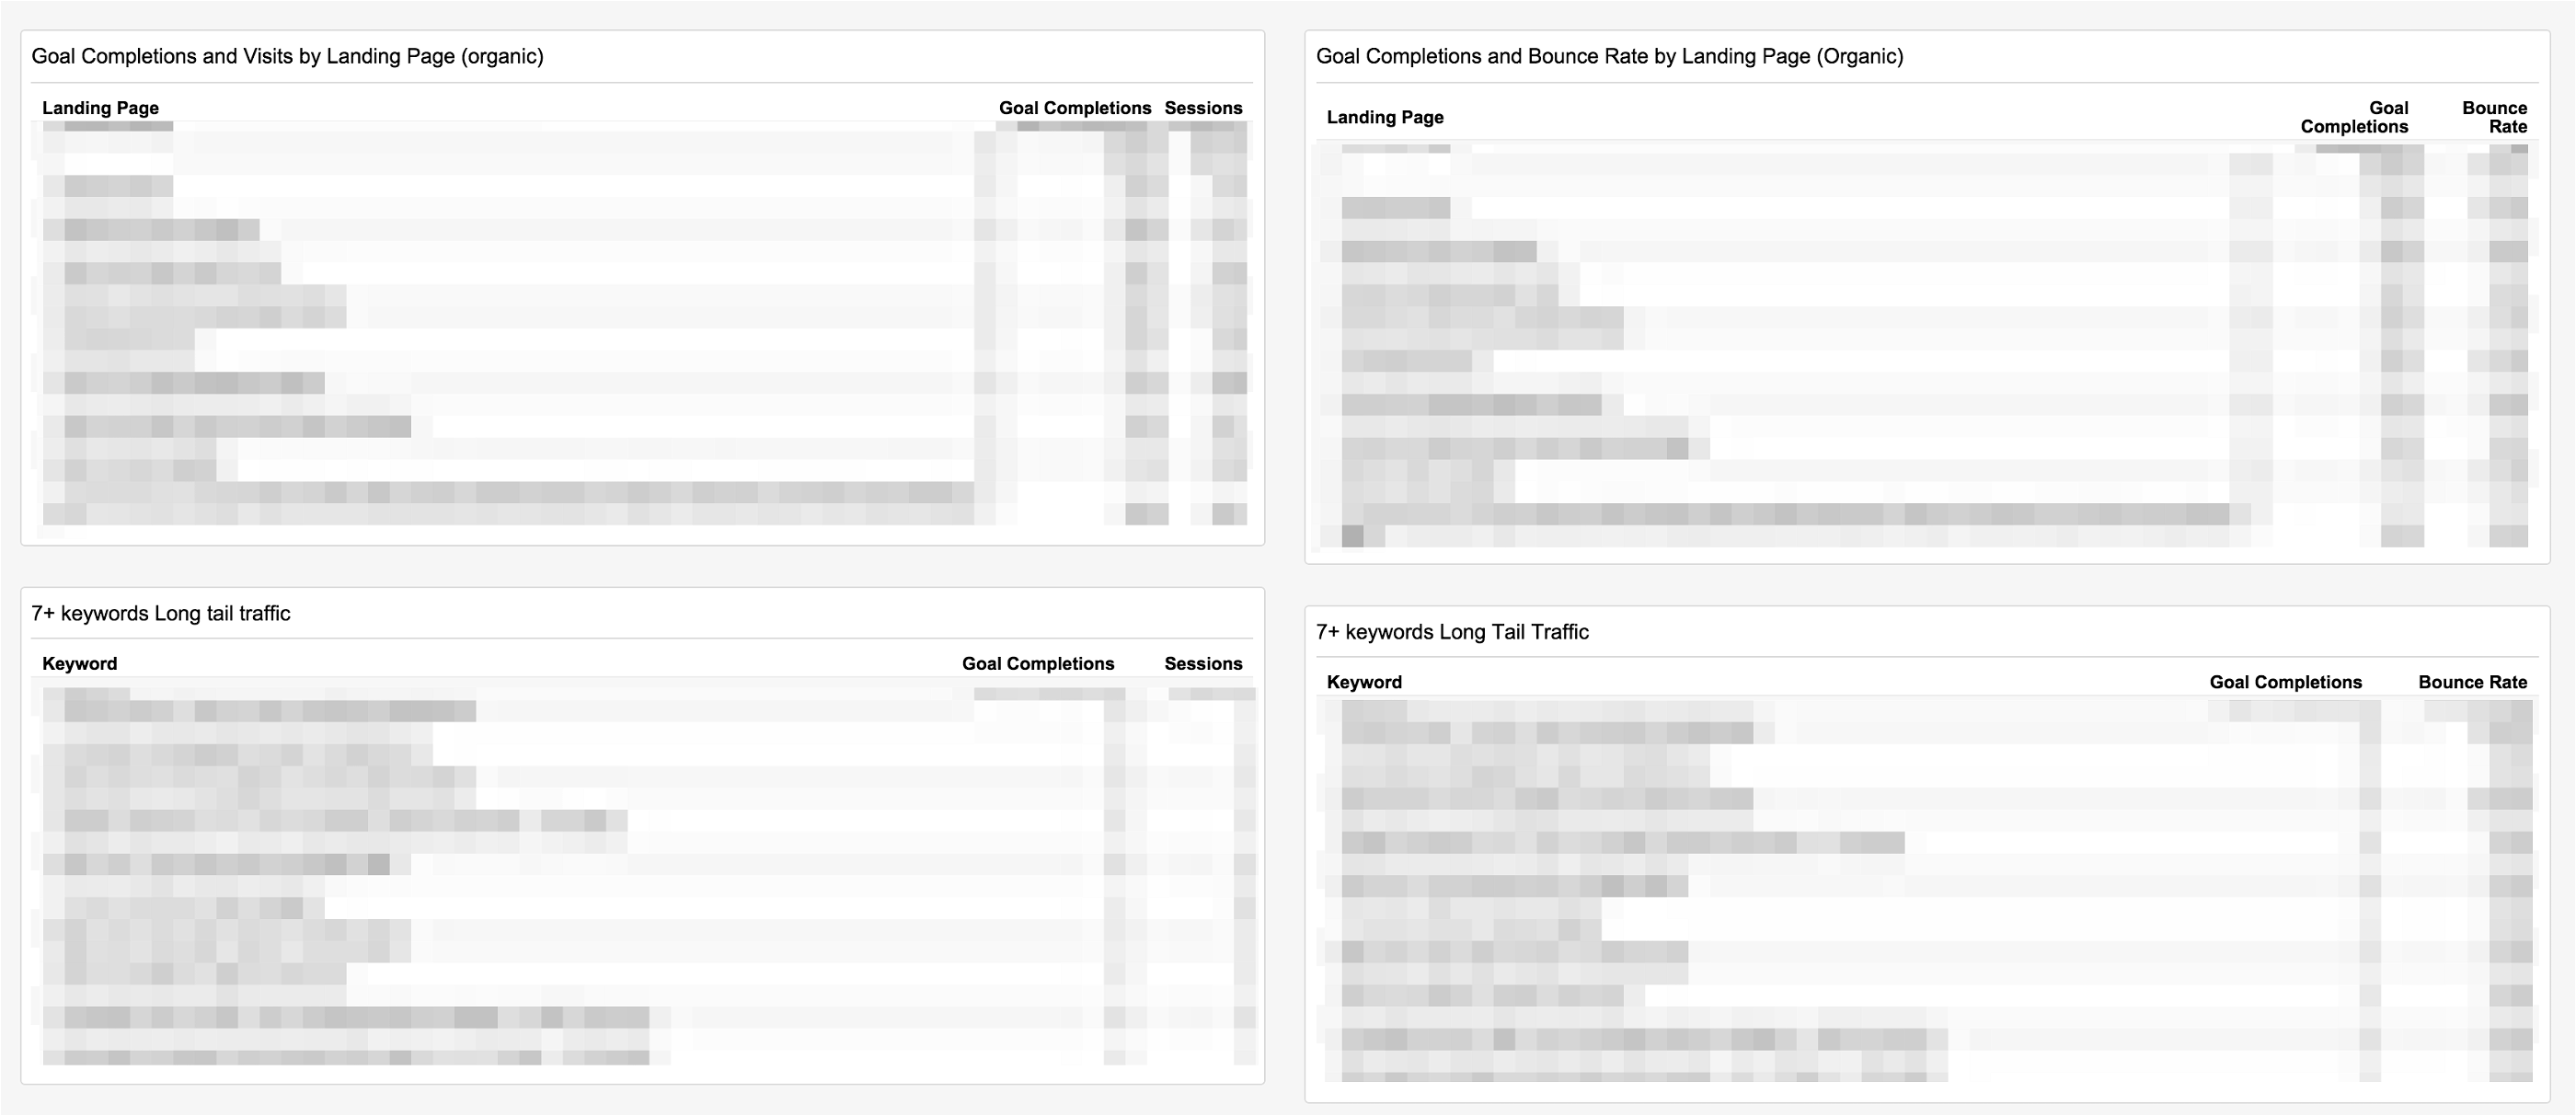
SEO dashboard is handy with the departure of keyword data. It shows keyword data for 5-10% of organic traffic.
It is a dashboard you need to have in your arsenal as it showcases:
- Organic landing pages with the highest conversions or goal completions.
- Seven-plus long-tail keywords with the highest conversion based on how you establish the conversion settings.
- 5+ keywords, 3+ keywords, 2+ keywords, and 1+ keywords with the highest conversions.
5. All-in-one Google Analytics eCommerce Dashboard
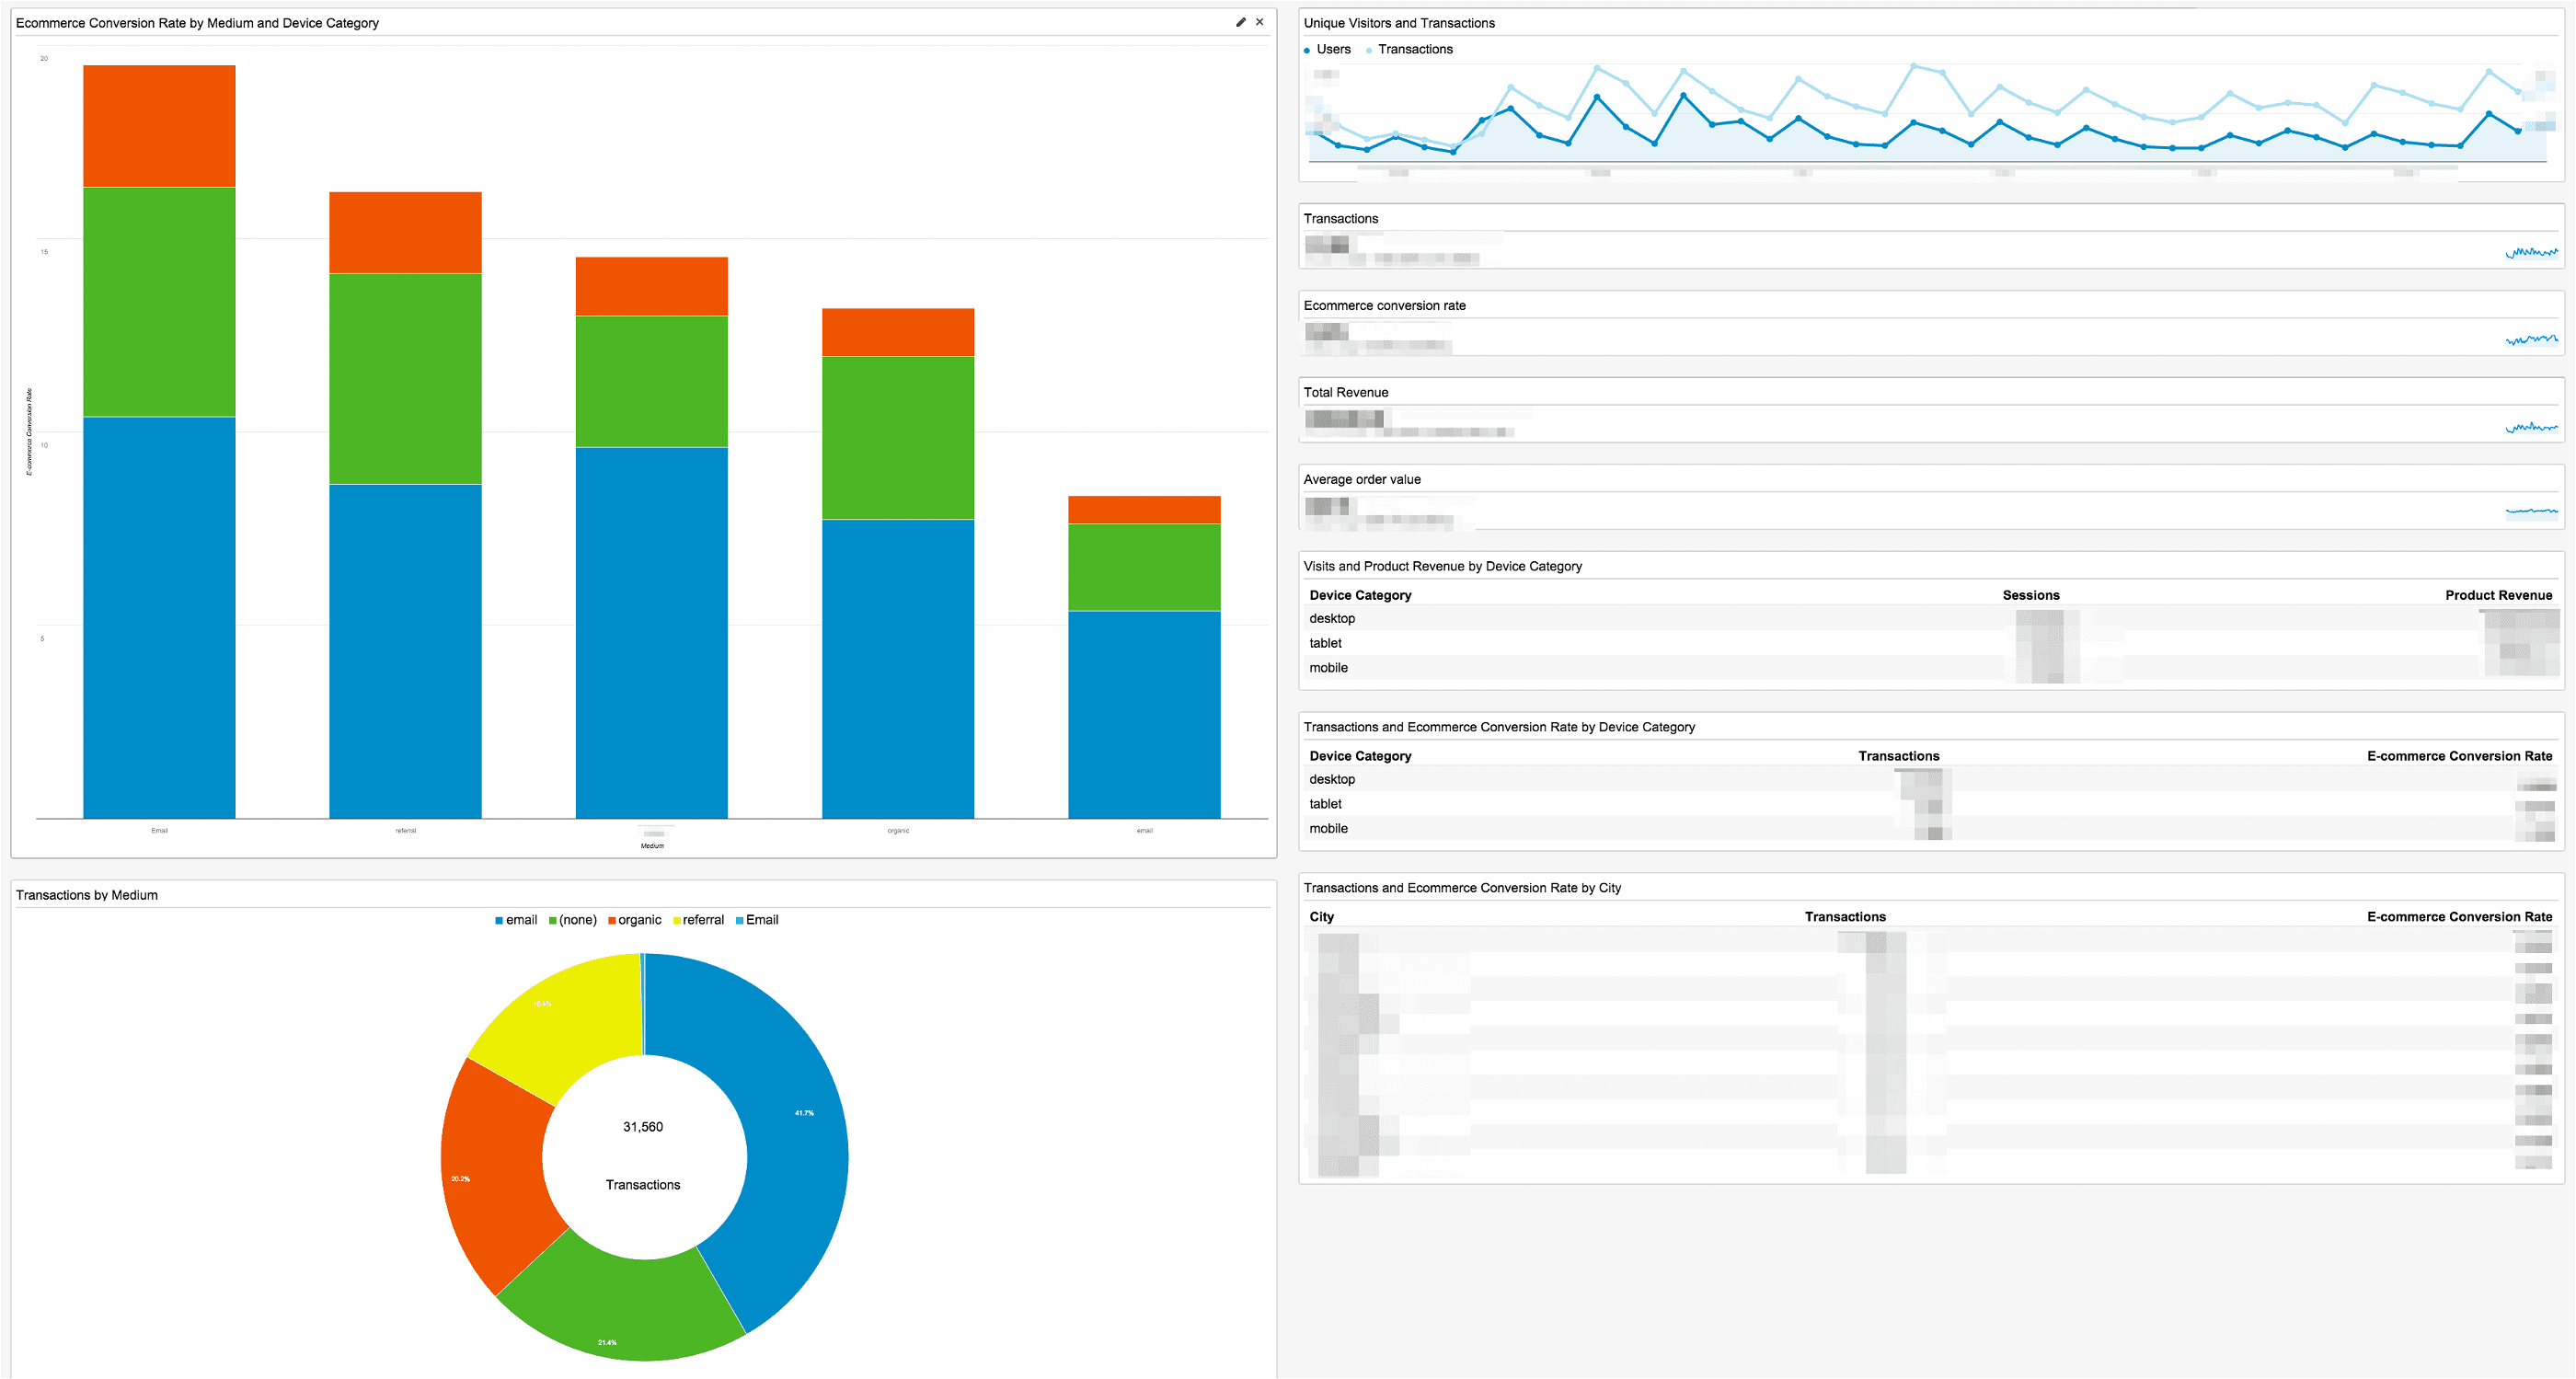
This dashboard is created by Paolo Margari.
- It leverages 12-boxes or widget limit with crucial eCommerce transaction metrics.
- The eCommerce Conversion Rate is a big, colorful bar chart that is labeled by Device and Medium Category.
- It shows the rate of conversion of device format by mobile, tablet, and desktop.
- It also has a 'Transaction by medium' pie chart, which shows your top eCommerce sales referral media.
- There exist corresponding tables for the stated graphs above and also standard eCommerce metrics like conversion rates, transactions, and revenue.
- Another widget that deserves to be mentioned is called the 'Transaction & Ecommerce Conversion Rate by City'. This report explains 'Transaction', as well as conversion rate by City.
- You can both the primary, as well as the advanced sections in filtering traffic origins as well as categories, products, and product SKUs.
6. Social Media Google Analytics Dashboard
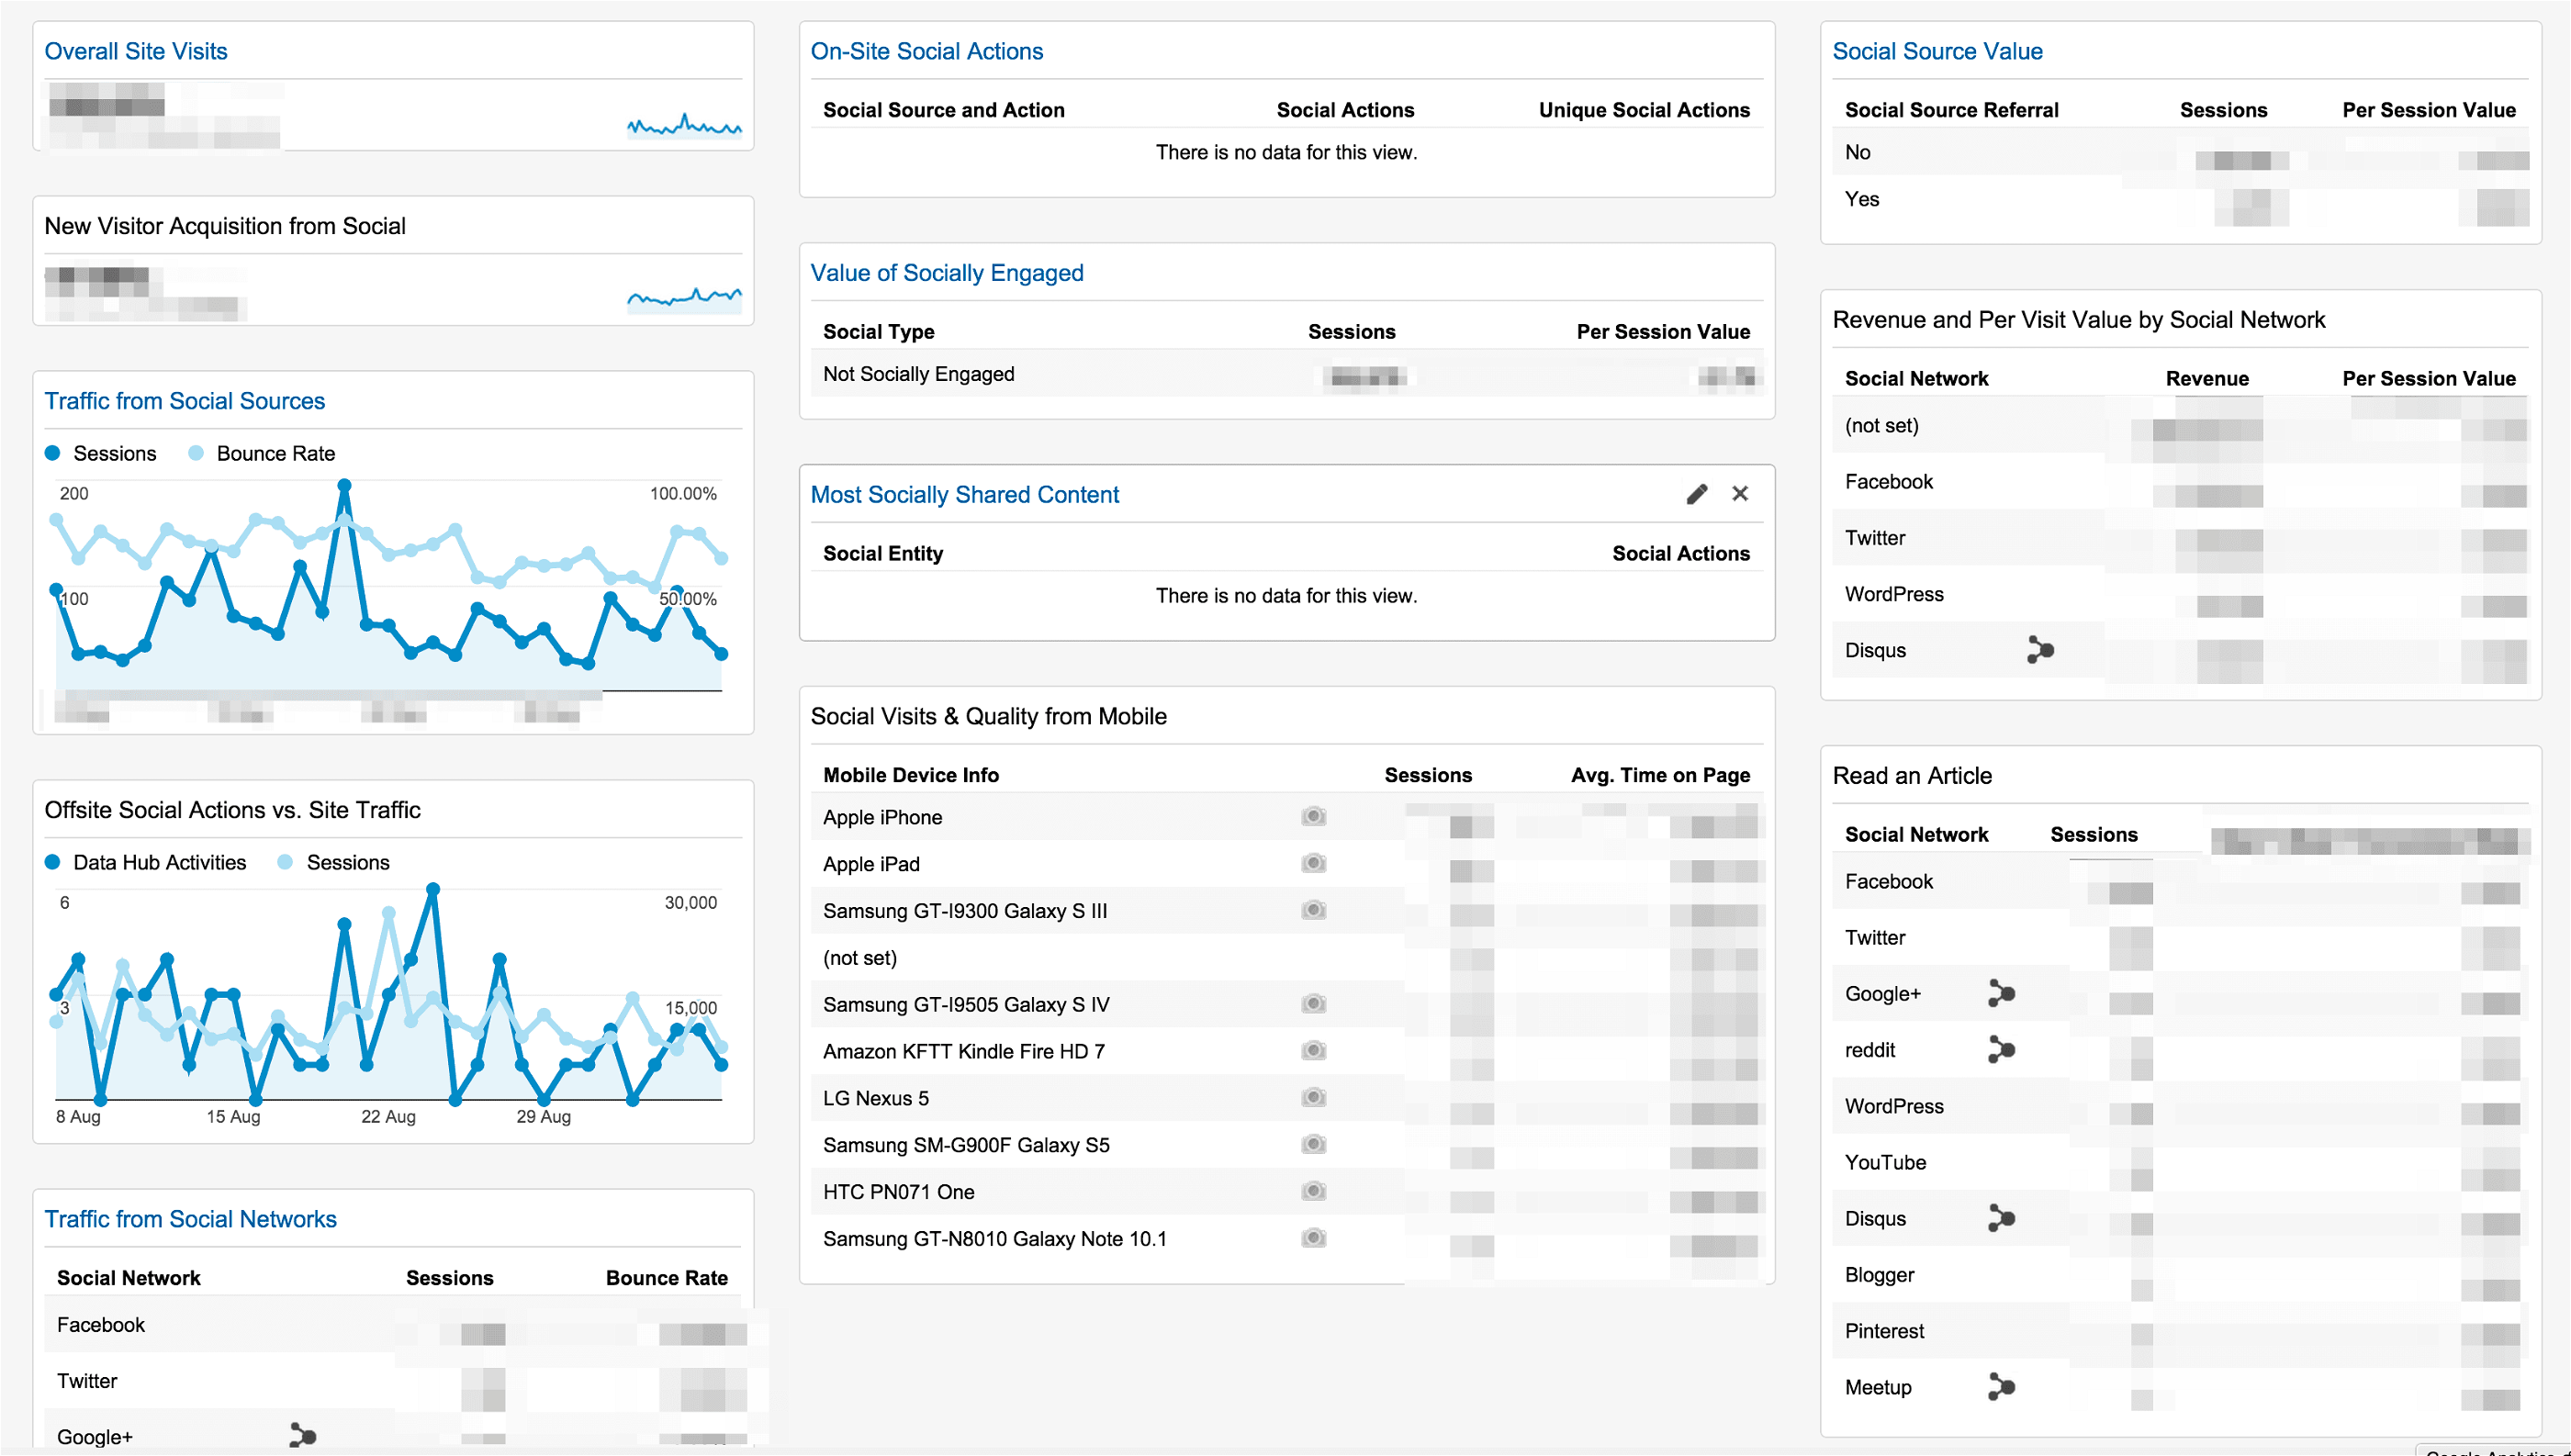
This dashboard offers a clearer insight into the performance of your social media campaign strategy and its impact on your business. The vital reports in this dashboard are new visitors acquired from social media channels.
- The income per view by social channel, Social visits, and quality from devices.
- It also has reports on metrics which cover off-site activity, on-site activity, conversions as well as outcomes.
7. Email Google Analytics Ecommerce Dashboard
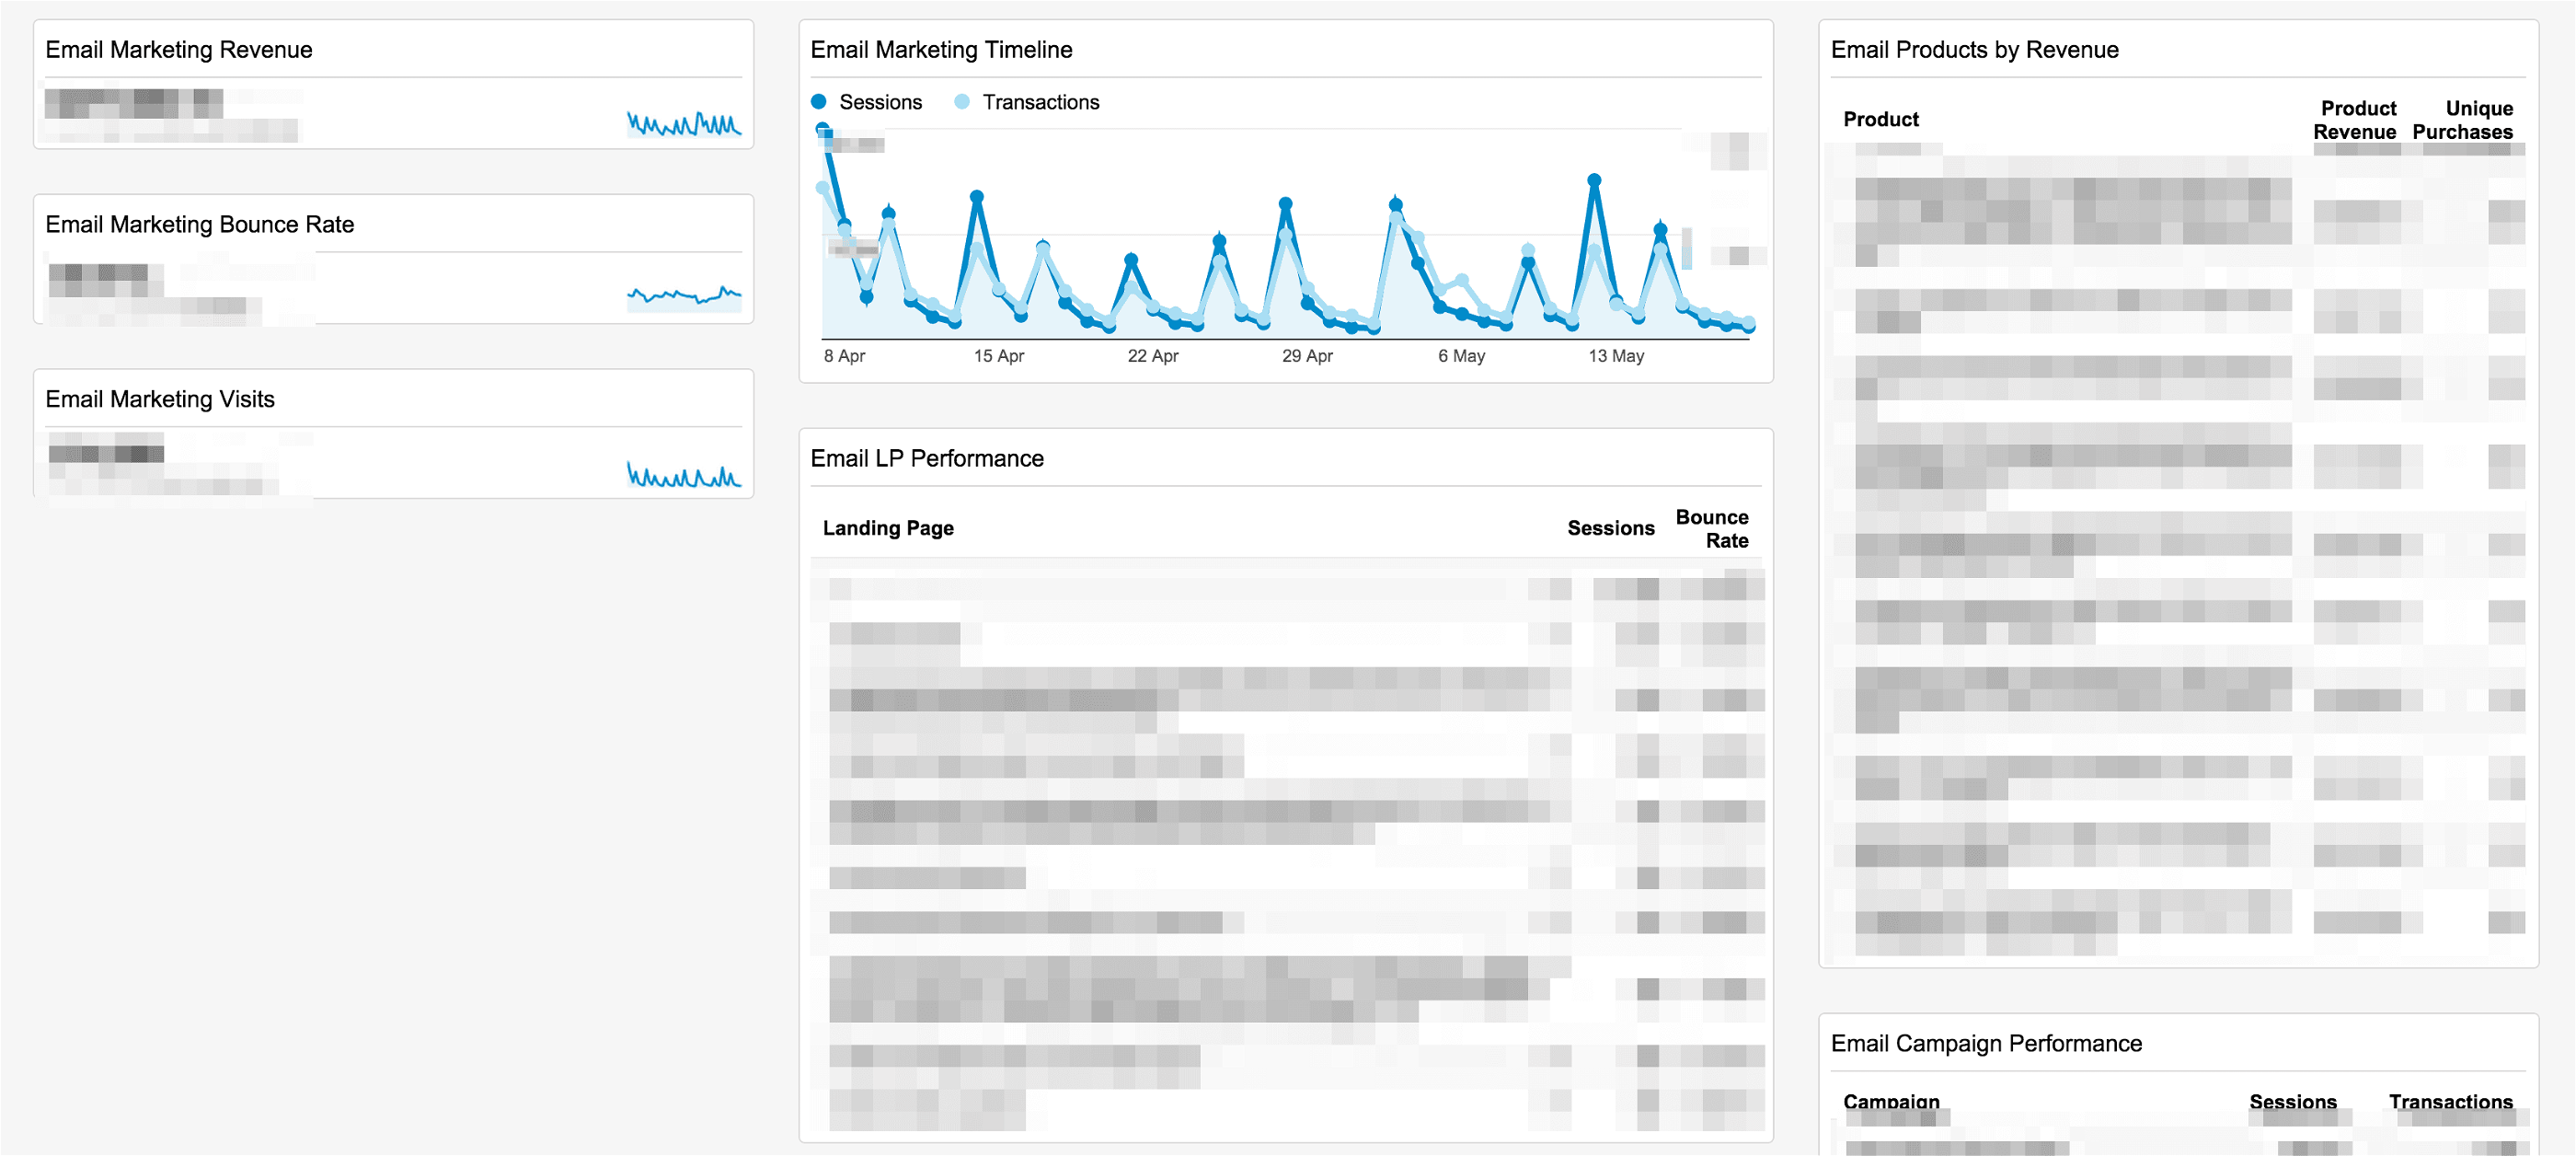
Email marketing is highly essential in business planning and strategy. You need it to boost your sales most effectively.
You can utilize the Blast Analytics Dashboard to generate critical insights relating to traffic coming to your store. It also provides critical data points about email marketing procedures.
This dashboard provides reports relating to:
- The revenue generated via email marketing.
- Products that generate the highest revenue via email marketing campaigns.
- Performance report on email campaign.
- Bounce rate from email traffic.
- Landing page report.
8. Engagement, Loyalty and Traffic Growth GA Ecommerce Dashboard
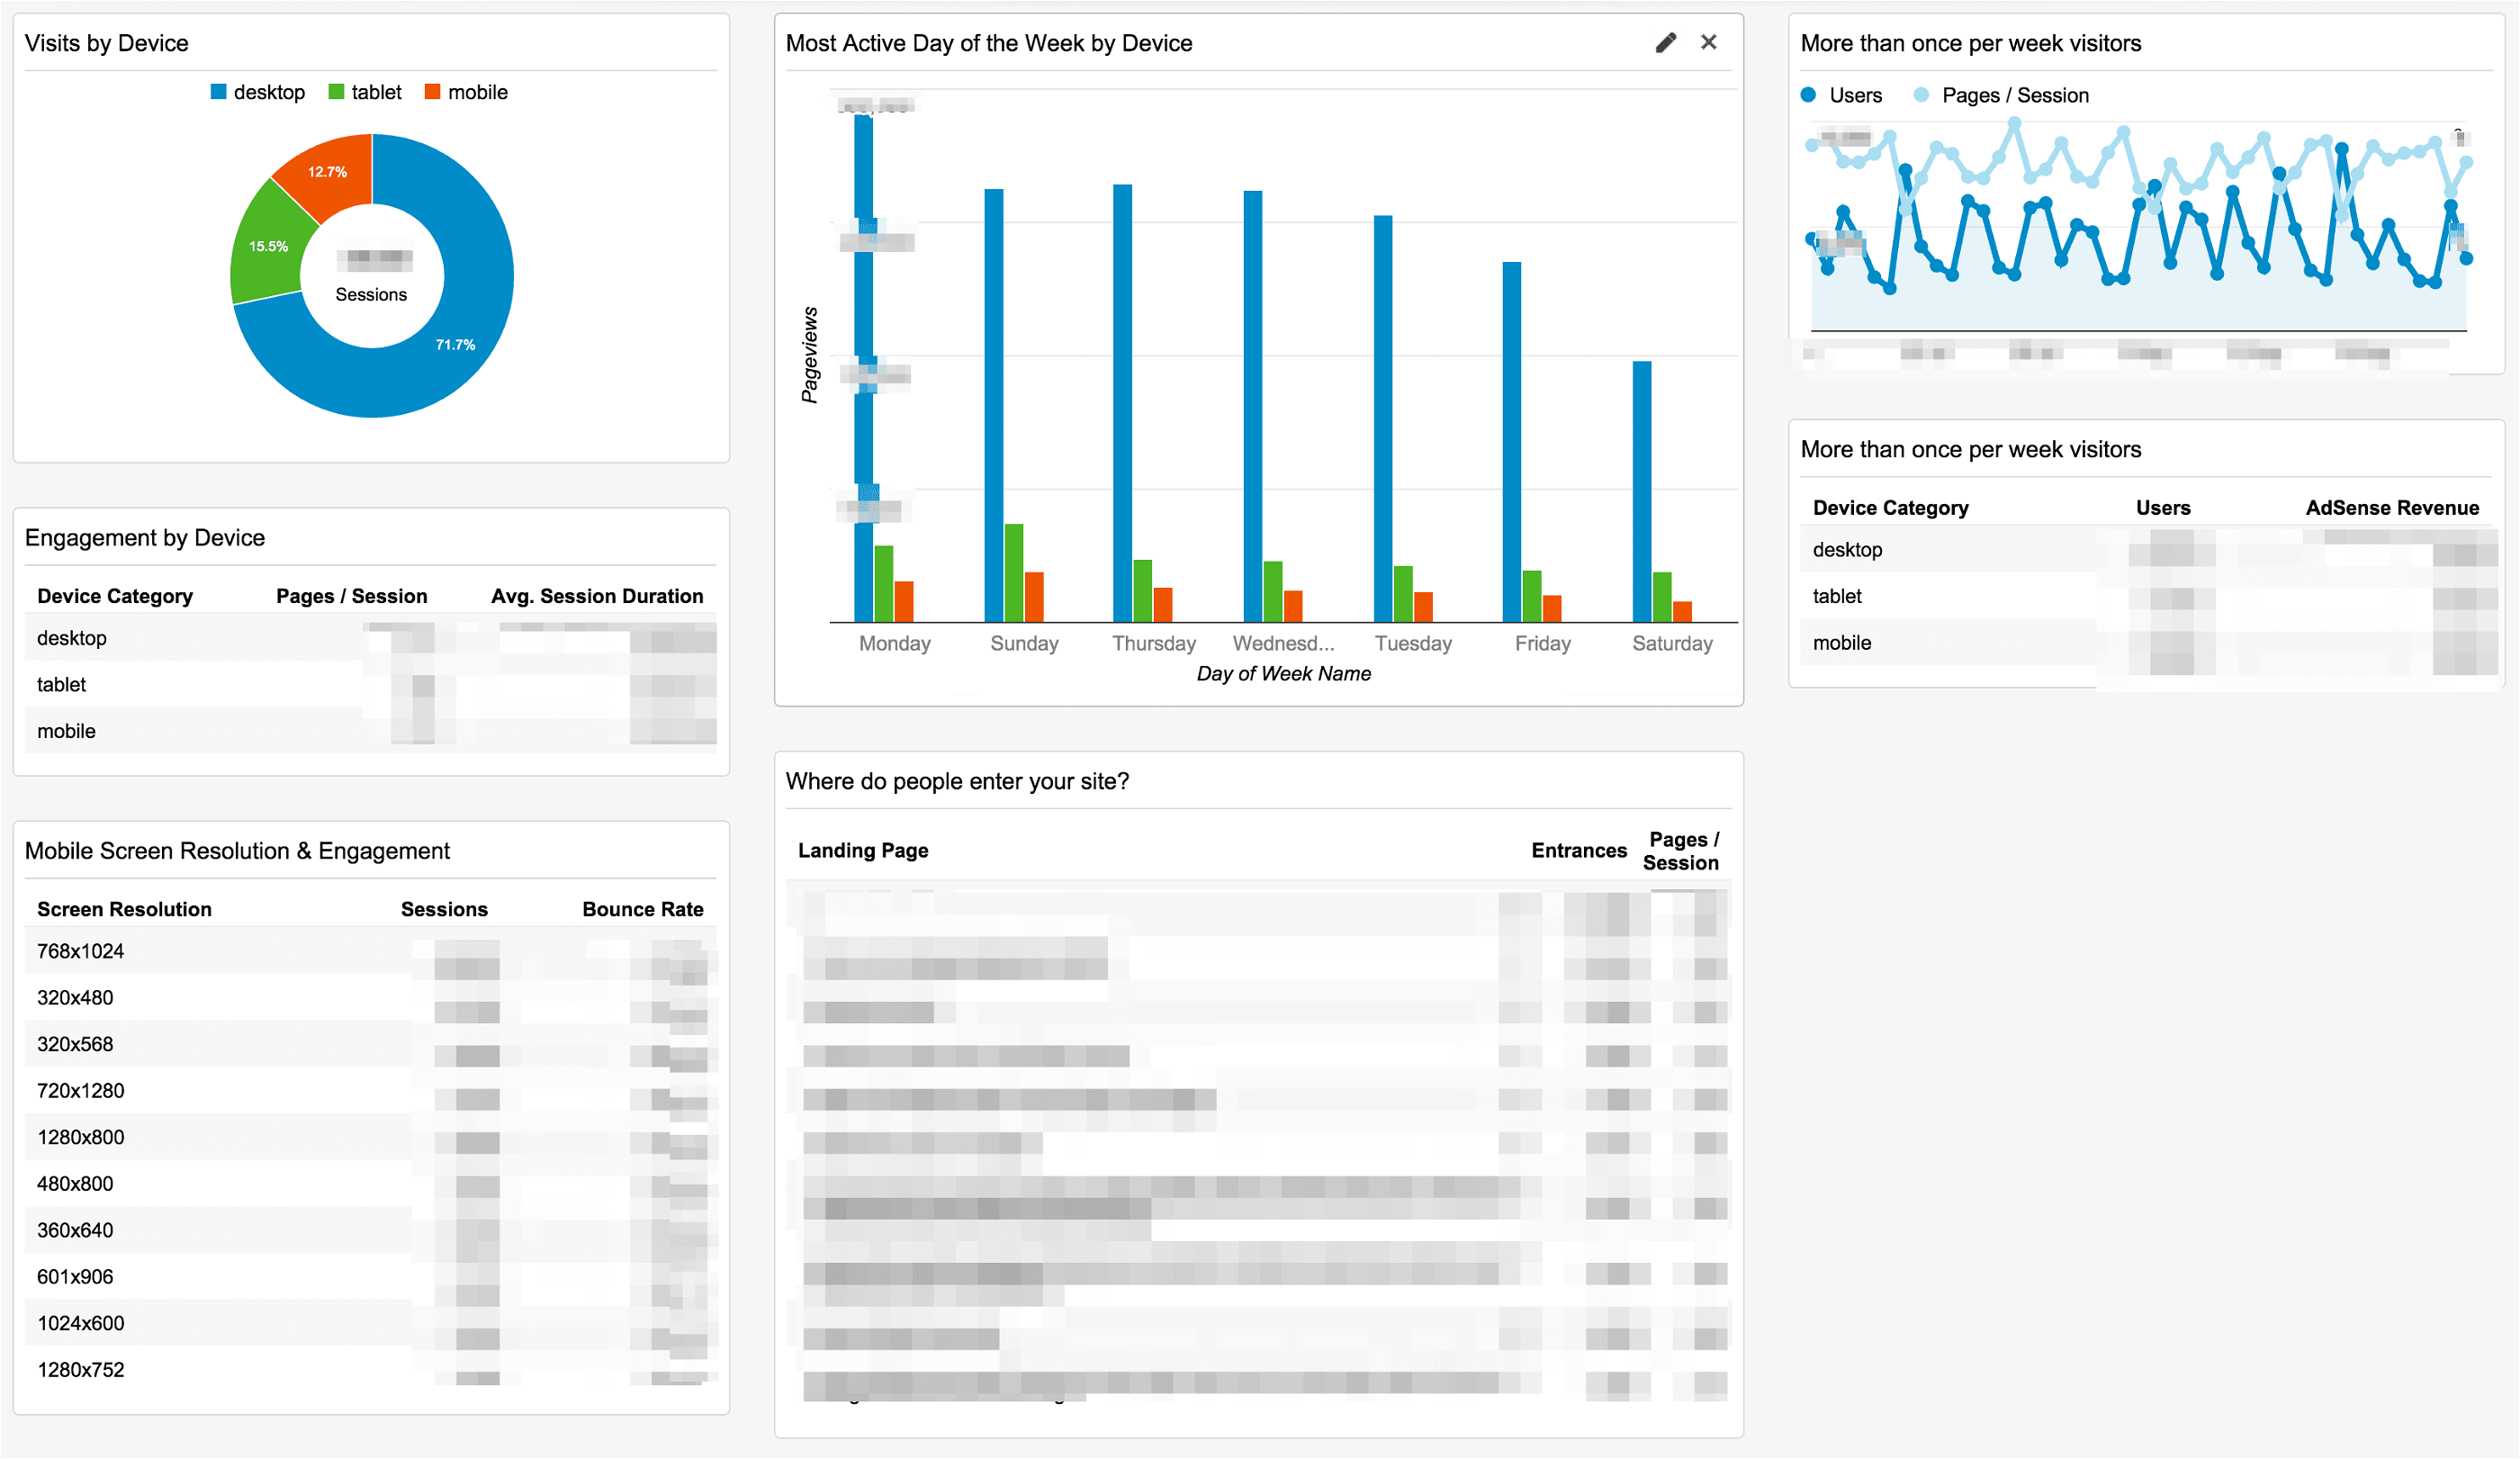
This dashboard offers on device-specific vital metrics. However, its focus is on generating engagement metrics relating to tablet, desktop, and mobile devices instead of transactional data.
It is an easy and fast way to know how site visitors engage content on your website from the standpoint of a device.
It covers these metrics:
- The pageviews by weekday for mobile, tablet, and desktop.
- Repeat site visitors metrics based on device.
- Pages per session, as well as the bounce rate based on device.
- The best engaging traffic origins.
The primary aim of this dashboard is to offer all you need to perform analysis for traffic growth and also to enhance loyalty and engagement on your website.
Conclusion
Dashboards are an efficient means of deriving optimal value from Google Analytics to bolster your eCommerce business.
Having these customized Google Analytics eCommerce dashboards at your beck and call handles tedious data sourcing and organization endeavors.
This will ensure you channel your efforts on other important things such as critical metrics that improve your eCommerce business' bottom line.
Published on Apr 04 2020
WRITTEN BY
Gintaras BaltusevičiusGintaras is an experienced marketing professional who is always eager to explore the most up-to-date issues in data marketing. Having worked as an SEO manager at several companies, he's a valuable addition to the Whatagraph writers' pool.