Ecommerce Analytics: Actionable Insights for Business Success
The eCommerce industry is growing at an exponential rate. Google's investment in partner integrations like Shopify, Woocommerce and others opened the door for eCommerce companies to grow their businesses. But with so many opportunities, eCommerce analytics becomes even more essential.

Dec 10 2021●6 min read


With all the innovation such as headless eCommerce, the eCommerce business is getting pretty competitive. And to take over the competition, the business needs proper eCommerce analytics. You can choose many different routes on how to stand out from your competition. Marketing campaigns, customer journey, CX - customer experience, or even on-site optimization. All these actions require you to pull data out of your eCommerce tools and analyze it for the best insights. But how to do it and what to look at?
What are eCommerce Analytics?
Ecommerce analytics is a process involving gathering and interpreting the data from an eCommerce store and related data channels. This process helps you to understand many aspects of your eCommerce business. It does so by analyzing a list of critical metrics that paint a picture of your online store performance. Good reports also allow you to set goals for your e-store, watch over your sales data and see how you're reaching your targets.
What Does eCommerce Analytics Consist of?
Ecommerce analytics consists of four stages that reflect the customer journey. These stages are:
- Discovery - how the customer finds your e-store;
- Acquisition - how you get your customer to land on your site;
- Conversion - how you get a visitor to purchase from you;
- Promotion - how you get customers to recommend your store.
Each of these stages has success metrics. They're unique for each stage and are precisely what you want to analyze.
Ecommerce Analytics Tools
Gathering sales data, social media insights, and customer data is challenging. Each eCommerce platform has a built-in analytics system in some form. But to get a really accurate picture, you will need some extra ecommerce analytics tools:
- Whatagraph - a powerful reporting and monitoring platform. Here you can connect all data sources listed below and look at all the metrics we mention in this article in a single report;
- eCommerce platform - WooCommerce, BigCommerce, Shopify - whichever you built your online store on, it has data for you to use;
- Google Analytics - this is where you see all your traffic, conversions, audience data, etc.
- Social media platforms - Facebook, Instagram, TikTok - wherever you're running advertising campaigns, you will need that data;
- Google Search Console - if you're interested in analyzing organic traffic and how to rank your online stores higher, you will need Google Search Console.
Analysis of a Successful Ecommerce Business
The most important thing here is to pull data to a single place and analyze it together. Compare the data through different time intervals. Analyze consumer behavior on your site. Evaluate your external marketing efforts. That's a lot of steps.
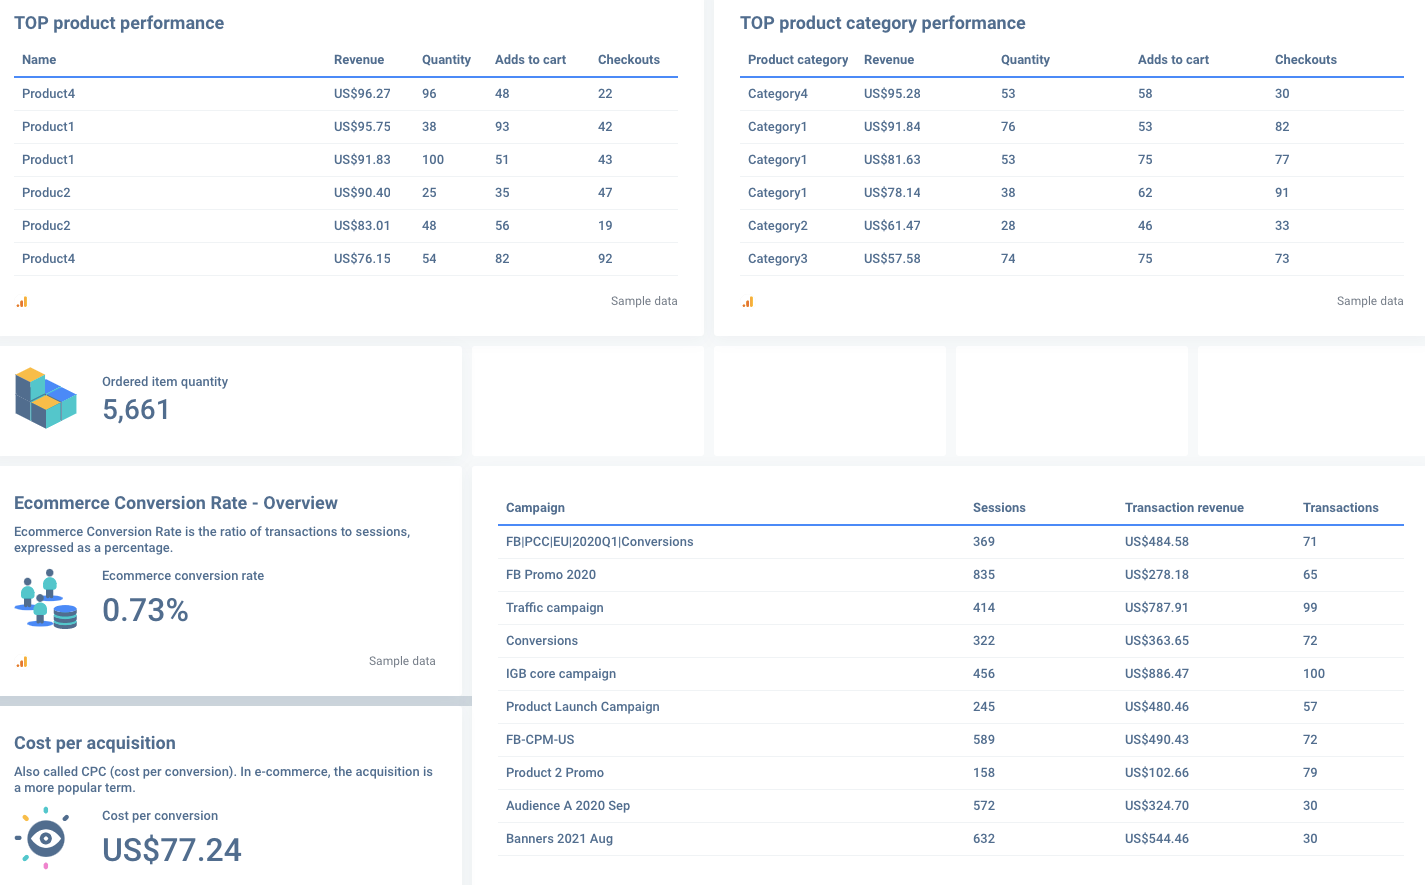
But when you put it into a single report from Whatagraph like this, you will get a clear picture:
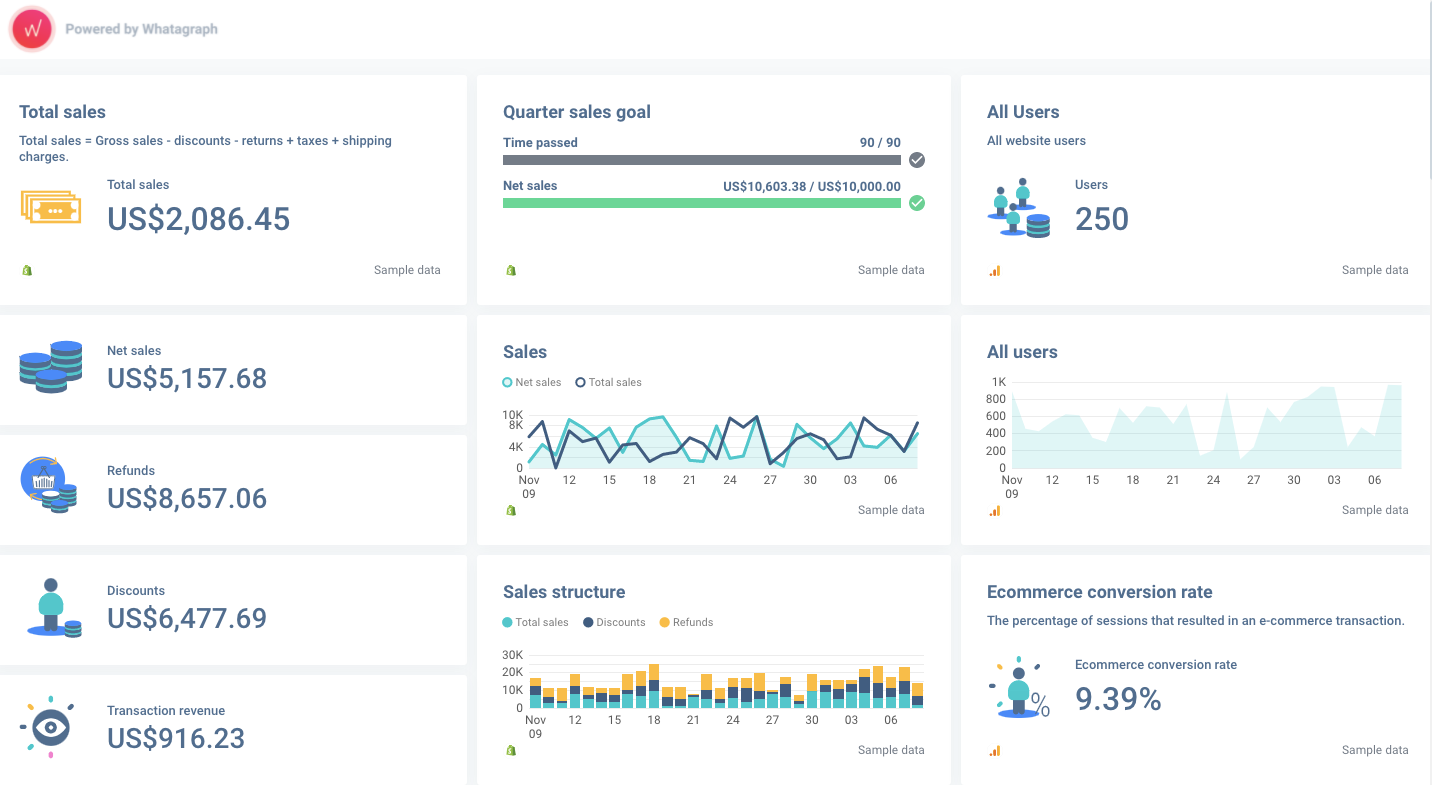
Aim for pulling as much data as possible into a single location. Then set benchmarks for each metric and see which ones pass. That is analysis. Your next step would be setting goals to achieve over a period of time. That's when monitoring starts - which you can do by setting up the same metrics with goal progression.
Let's cover which metrics show the overall state of your online business.
Discovery
First impressions matter. How your customers discover you is the critical first step you should understand in your analysis. Usually, you want to bring your customers by running ad campaigns on social media, via Google Ads and other paid channels. Also, include email marketing campaigns into your analysis.
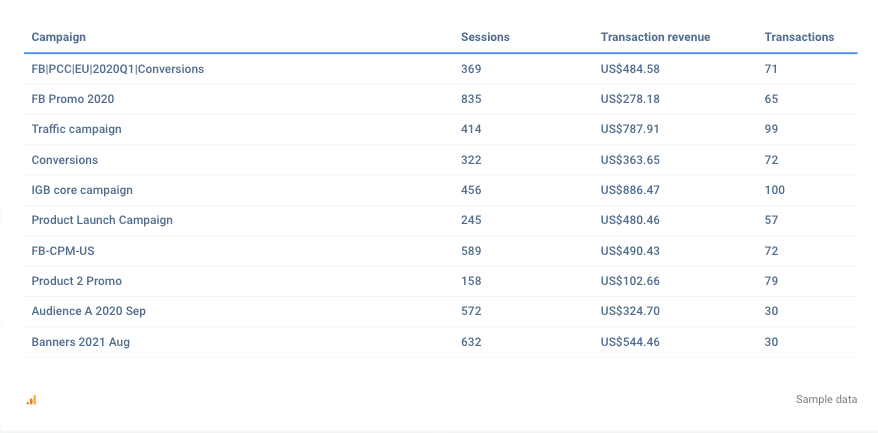
In your eCommerce analytics reports, you first have to look at which campaigns bring the most value to your e-store. Here you can see the number of sessions, transactions and transaction revenue these campaigns bring.
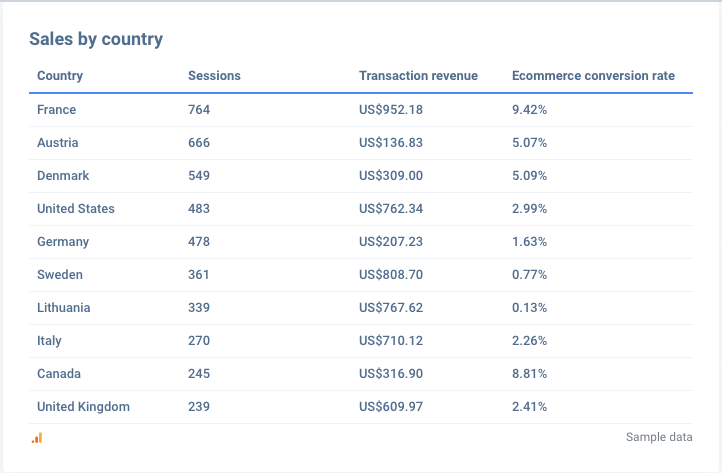
Continue with analyzing your customer profile. This analysis is crucial to increase the discovery of your site. Whatagraph lets you look over the sales distribution by country. This should give you a good geographic insight into where your customers are coming from.
Finally, look for trends. See when customers are most likely to visit your site and when the traffic is lower. Look for patterns and recognize when your campaigns would be more effective.
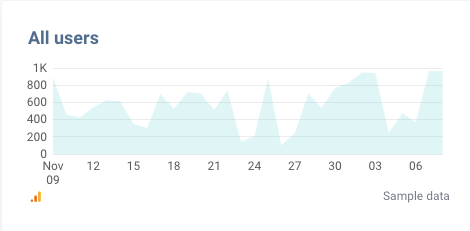
For example, if you see a trend that customers shop more during weekends, consider launching weekend sales campaigns and analyze if that raises sales performance.
Acquisition
So your customer has discovered you. They saw your ad and clicked on it. What makes them paying customers?
Several metrics play a key role in understanding customer acquisition.
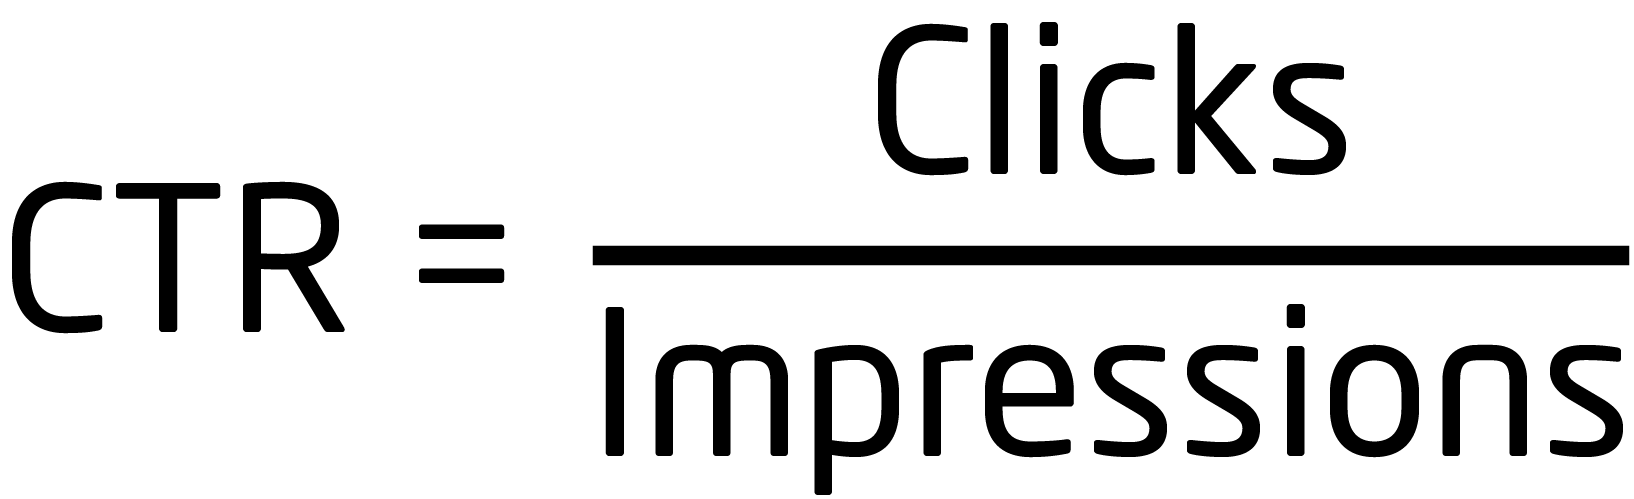
Click-through Rate (CTR)
This will show you what percentage of customers clicked on your ad. It's an excellent way to track your paid marketing efforts and measure how well each campaign works. The average CTR in 2020 was estimated at 1.9%. This number differs depending on the industry you're working on, so be mindful of your business needs.
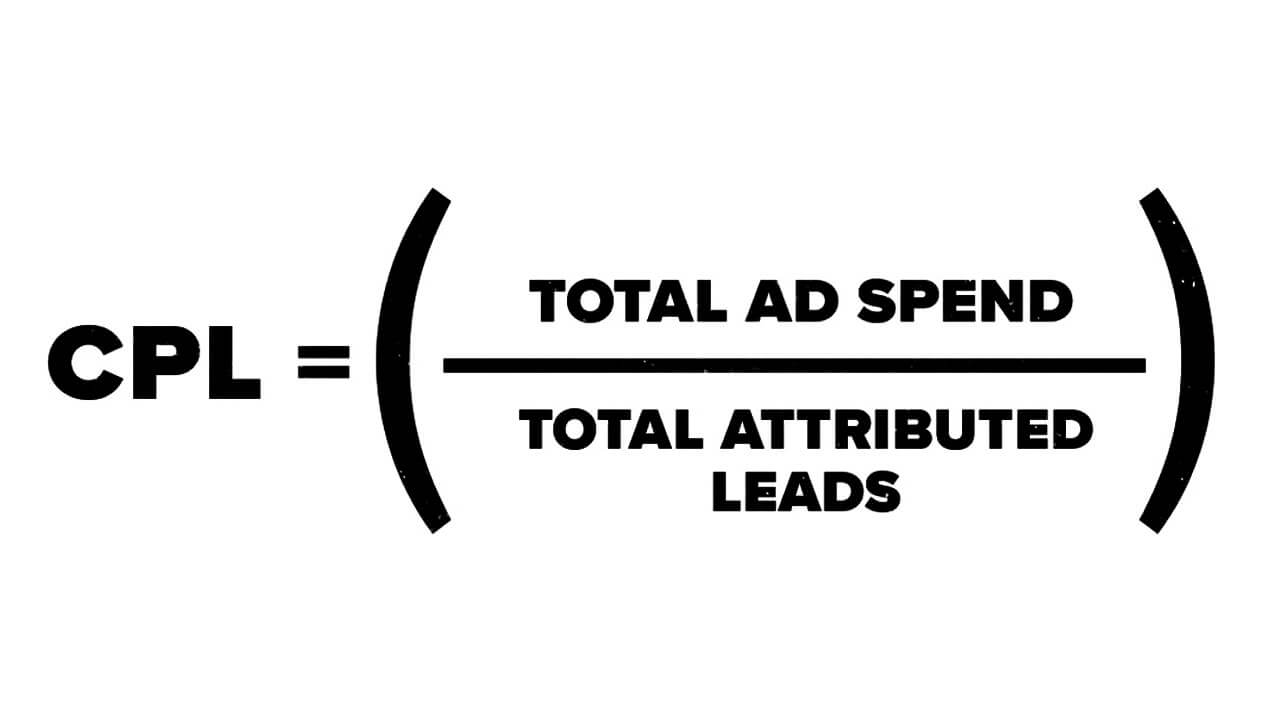
Cost per Lead (CPL)
This is a great metric to track how much it costs to bring all leads to your web store. It takes your total ad spend and divides it by the number of all leads. In 2020, the total average cost per lead was $198. This number varies through different industries, and you can determine your own healthy CPL based on your business costs.
Customer Acquisition Cost (CAC)
Whether you're running an online store for your client or yourself, you must know your CAC - customer acquisition cost. This simple metric will help you determine the budget you will need for your marketing strategy, how to price your stock to make a profit and how large your customer lifetime value should be.

Putting CAC next to an average order value per customer, you can also gain insight into what deals you can run to attract similar customers.
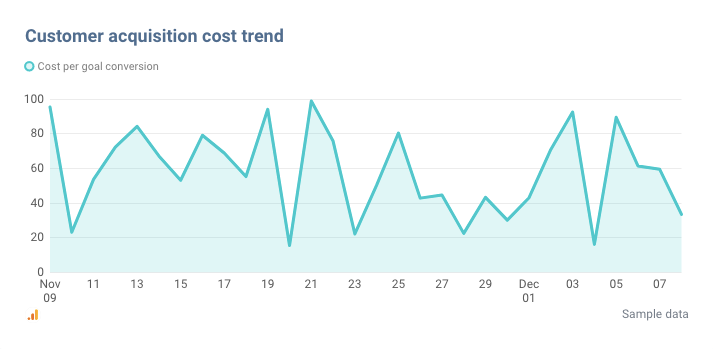 As with AOV, it's worth looking at trends. To determine why CAC rises, compare it to your marketing campaigns costs to adjust your budgets accordingly.
Conversions
This is where the purchase happens. And there are a lot of metrics that indicate the overall status of your conversions.
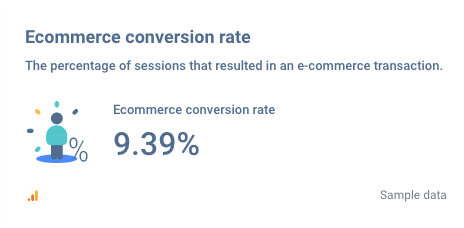
Conversion Rate
The conversion rate shows the percentage of customers that purchased from your store from the total number of visitors. This is a vital metric to evaluate whether your e-store successfully brings sales.
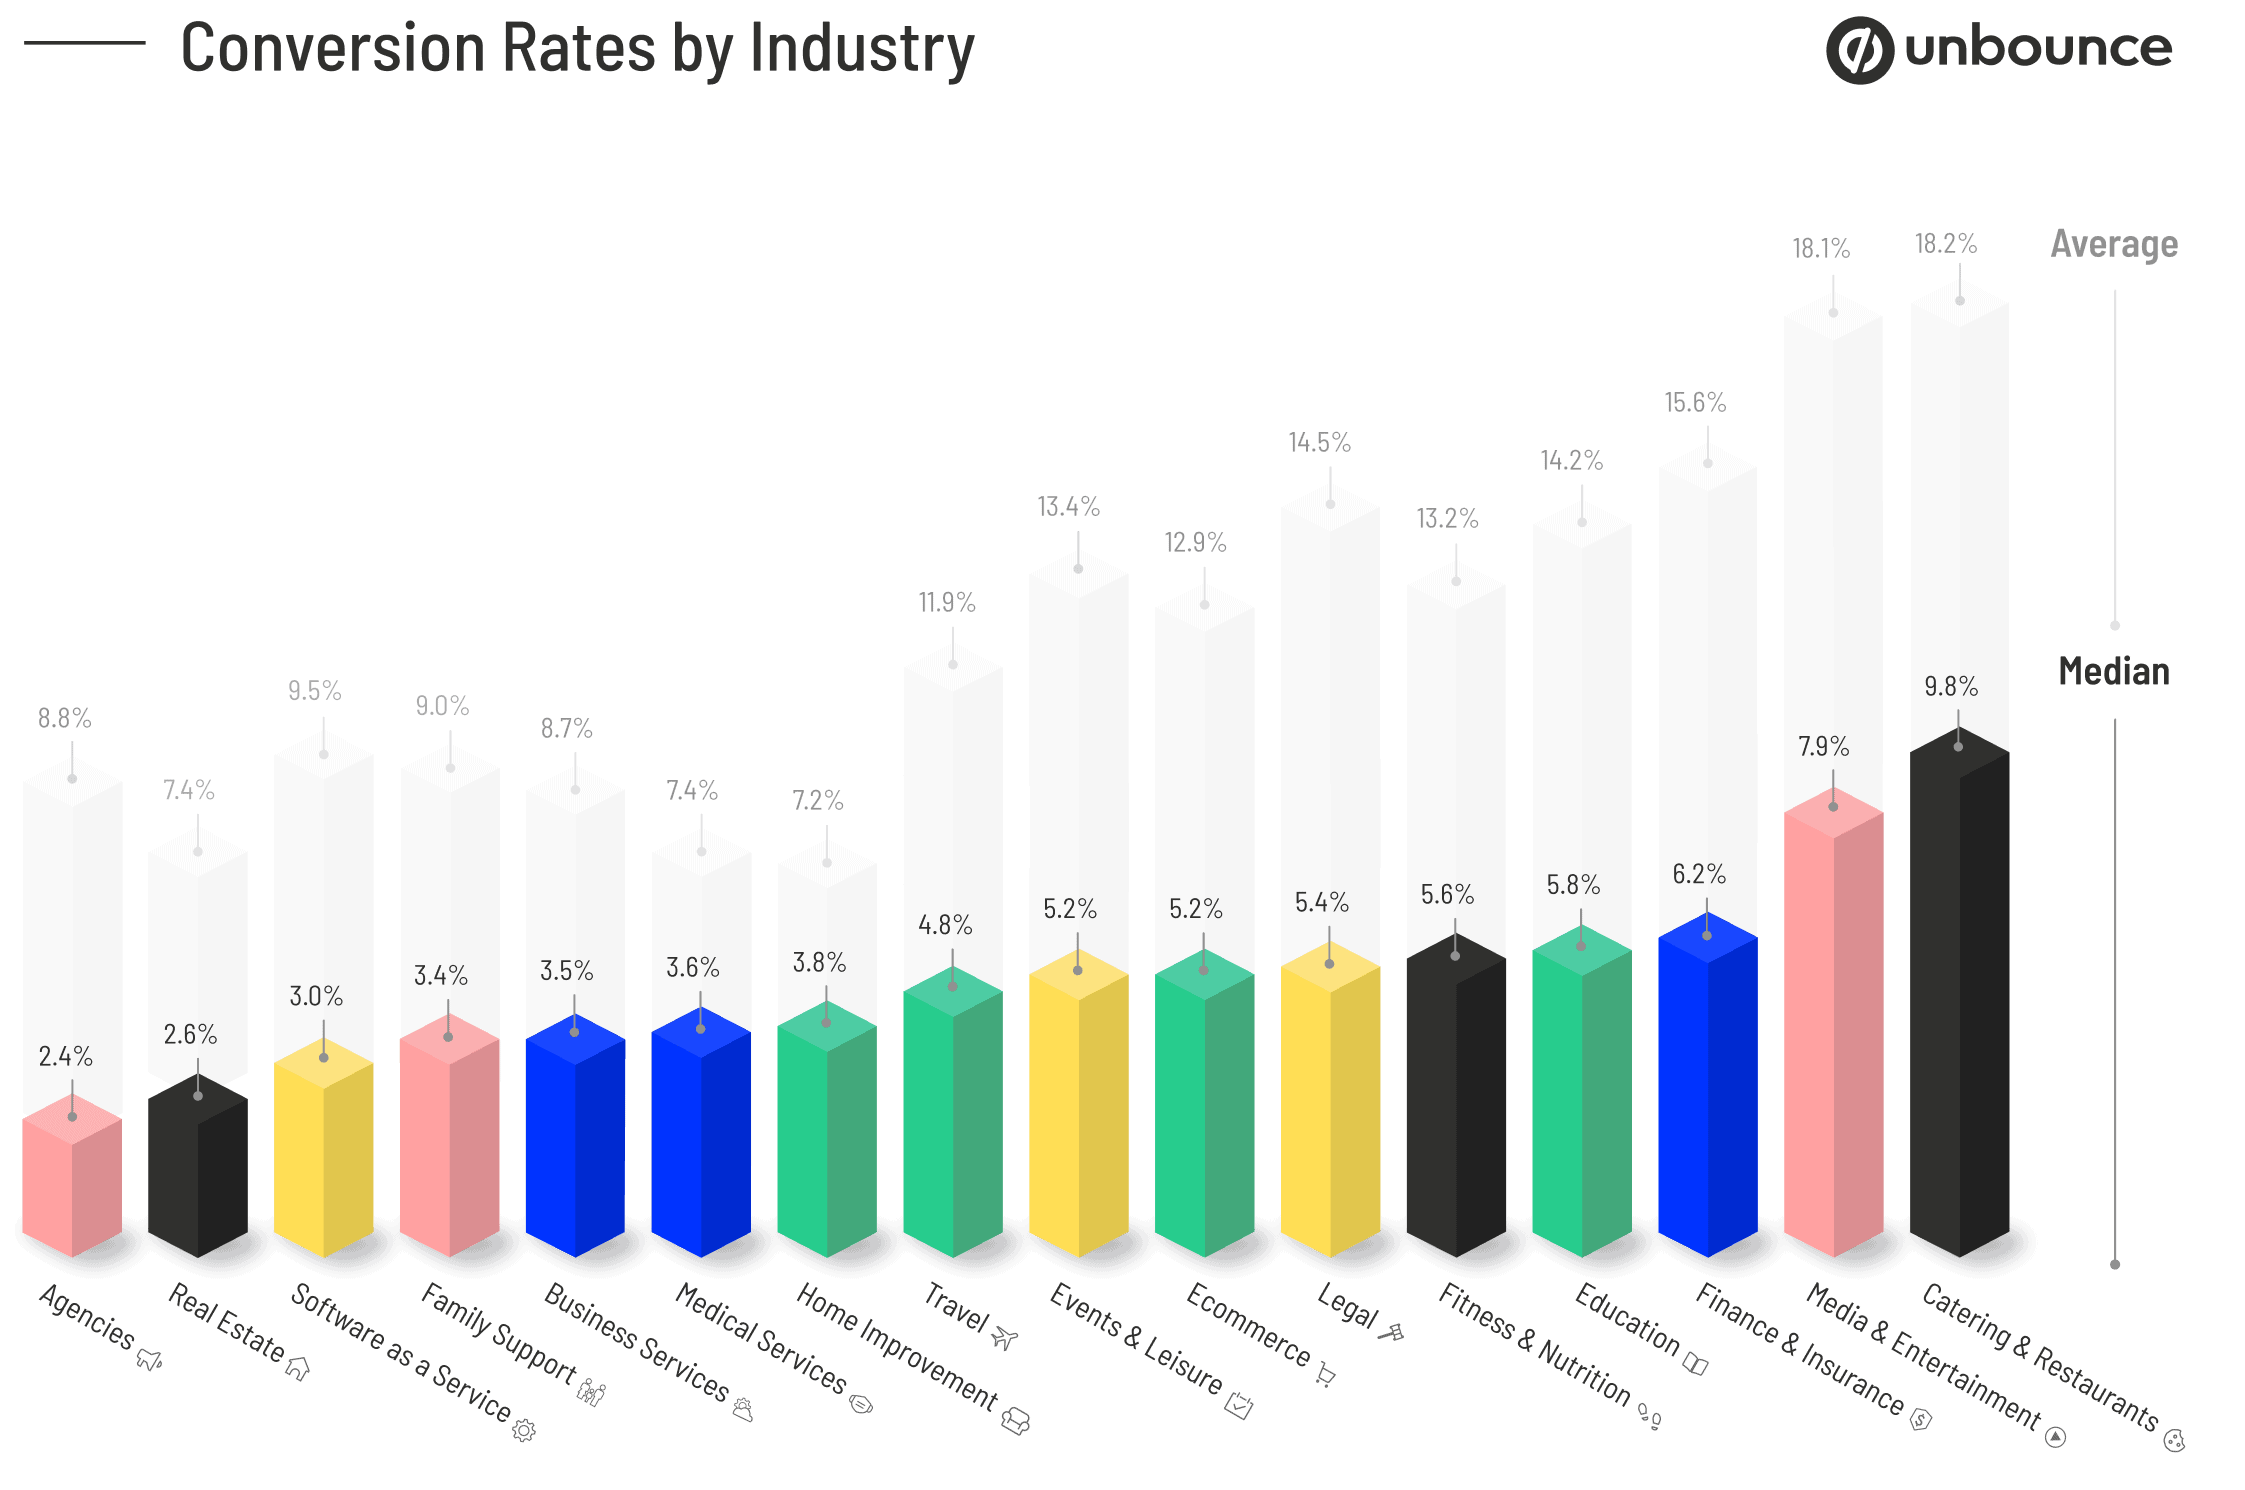
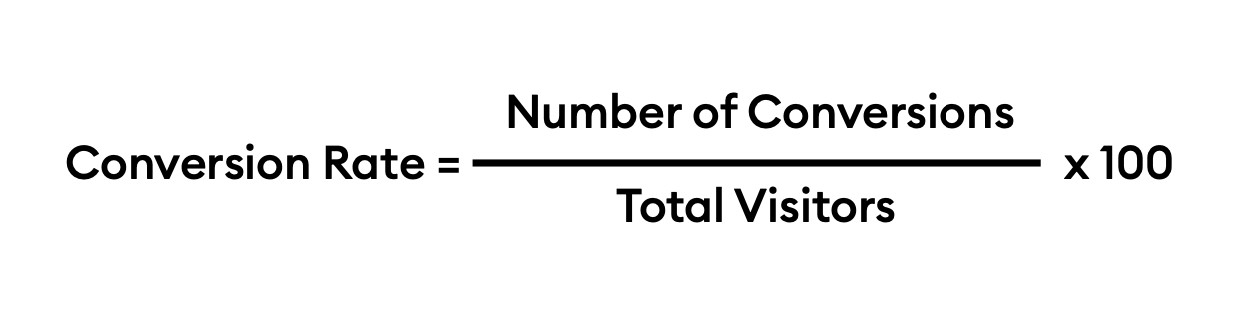 Always keep an eye on your conversion rate. Benchmark it for your business needs, but aim for your industry average at least. Unbounce released a 2021 CR report showing the industry's conversion rate averages.
Take this metric into account when analyzing your eCommerce business. Build a report with Whatagraph, including the conversion rate and set a goal to reach.
Online Sales Numbers
Let's take a break from formulas. You have to make sales at the end of the day, and their values should be at the top of e-commerce analytics.
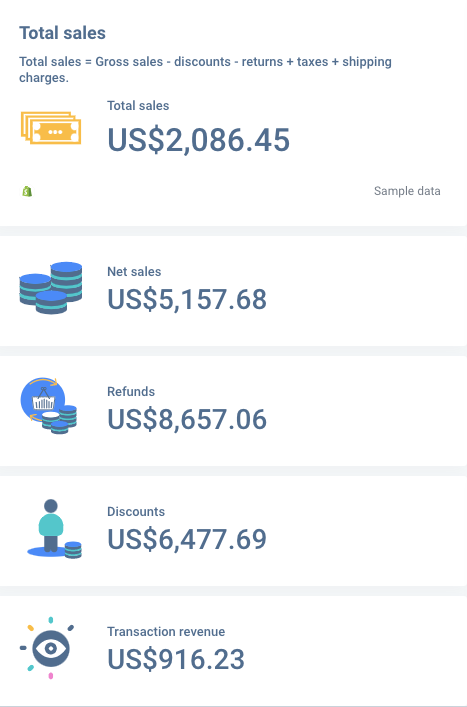
The top 4 numbers to look at here are Net sales, Refunds, Discounts and Revenue per Transaction. The total sales are determined by these numbers and your taxes, shipping, and other costs.
The revenue flow can fluctuate depending on the market you operate in. If it's volatile or seasonal, make sure to optimize your business to not overspend during downtimes. Make sure you plan your marketing tactics ahead of time to prepare for the shopping season.
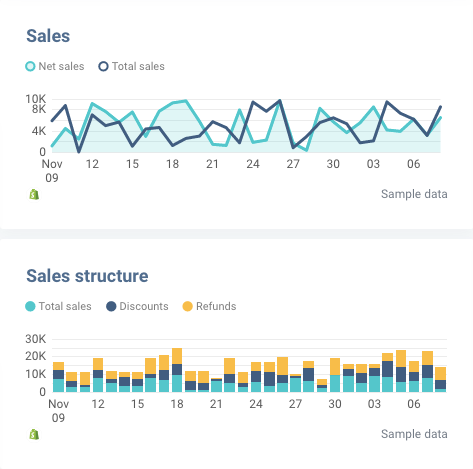
On the other hand, if your eCommerce business is mainly stable in sales, you can prepare a broader marketing strategy that spends the entire year. Watch for trends and prepare your marketing efforts and deal offers accordingly.
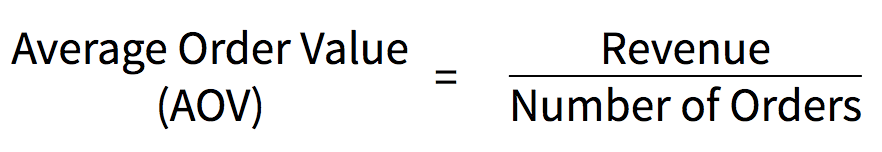
Average order value (AOV)
Coming back to formulas now. AOV is the value your customer brings you. This is the value of orders a customer purchases. With it, you can also show the value to the customer. Bundles, deals and minimum spend for free shipping all raise the order value in the eyes of your customer - and your revenue.
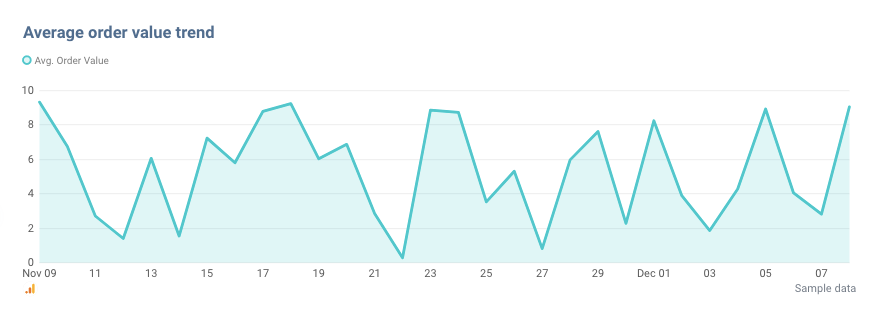
Track the average order value trends too. See where they dip and rise. Take into account what campaigns or deals may have influenced the change. In Whatagraph, you can see the AOV trend for a set amount of time.
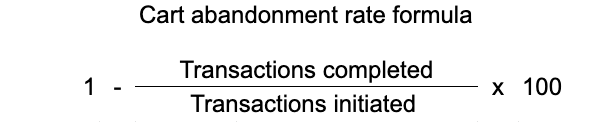
Cart Abandonment Rate (CAR)
This metric focuses on customers who added items to their carts but didn't purchase. Across all industries, the cart abandonment rate is on average at 70%. That's a high rate, so if your analysis shows anywhere close to this number - chances are it's still within the norm.
Despite that, you should aim to reduce this rate as much as possible. A frictionless checkout process on payment or better offers could help entice customers to purchase.
Customer Retention
Business owners focusing on returning customers reap the rewards. The rule is that 80% of your revenue comes from 20% of your customers. Also, the CAC is always higher for new customers rather than retaining existing ones. Some studies also showed that increasing CRR by 5% can raise profits by as much as 25% or more. This is an area of eCommerce worth focusing on.
Any e-commerce tracking will have metrics focused on customer retention.
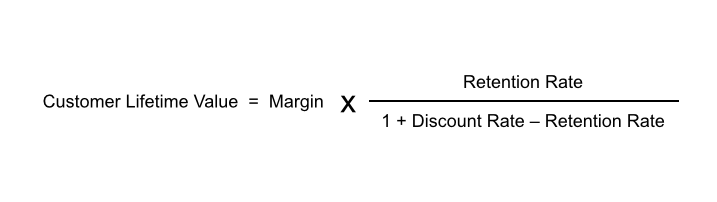
Customer Lifetime Value (CLV)
This metric shows how much a customer spends over their entire time with your eCommerce store. It's a good metric to track, as it gives you an insight into how much your customers like shopping with you.
Trends also help. If your CLV trend is increasing, it means you're getting more repeat customers and repeat purchases. If it's stagnant or downward-trending, consider adjusting your stock or e-store website.
Repeat Purchases and Average Customer Life
These two metrics are straightforward but reveal a lot. The number of repeat purchases your loyal customer makes signals good customer retention.
Average Customer Life (ACL) indicates how long, on average, a loyal customer stays with you. Naturally, you'll want to prolong this number as much as possible. Personalized deals, email marketing campaigns and other targeted campaigns would be an excellent way to help increase it.
Net Promoter Score (NPS)
Often overlooked, but a critical metric. With high CLV and a good number of repeat purchases, you can also see how your actual customers can bring even more value outside the e-store.
Do you know that classic question:
On a scale of 0 to 10, how likely are you to recommend this eCommerce store to a friend?
Using this score, you can determine what percentage of your customers actually promote your online business.
On a scale from 0 to 10, your customers can be segmented into these categories:
- Promoters - customers who respond with a score of 9 or 10. Typically, these customers have high CLV and ACL.
- Passives - customers who respond with a score of 7 or 8. These customers usually didn't become loyal upon first purchase or were not happy enough with the experience.
- Detractors - customers that respond with a score of 0 to 6. These customers were unhappy with the experience, are unlikely to buy from you again, and could discourage others from buying from you.
Based on this quantitative information, you get your Net Promoter Score:
Total % of promoters – total % of detractors = net promoter score
While this metric is not essential when analyzing eCommerce business, it can certainly improve your customer experience. Consider looking at it when running an eCommerce analysis.
Enhanced Reports to Track the eCommerce Data
All the key performance indicators listed above can be combined into a single report. That's what we call enhanced eCommerce analytics. They show the entire picture of your eCommerce growth, each popular marketing channel and form data-driven insights.
Google Analytics does a decent job in tracking your eCommerce performance. But it doesn't consider marketing data outside of Google's ecosystem. So you might be able to see that customers are coming from social media marketing channels. But you will not see their exact journey towards your site. You'd need to log into the social media analytics and look it up on a different eCommerce analytics tool.
Next-level eCommerce analytics are performed on a single report or dashboard. Whatagraph will let you do just that.
Where to Start?
Start by using this free eCommerce report template. It will give you quick insights into your online store performance. Use metrics suggested by the template or add some from this list. This way, you will better understand your eCommerce data and help you compile a plan of action to move your business forward.
Published on Dec 10 2021
WRITTEN BY
Indrė Jankutė-CarmaciuIndrė is a copywriter at Whatagraph with extensive experience in search engine optimization and public relations. She holds a degree in International Relations, while her professional background includes different marketing and advertising niches. She manages to merge marketing strategy and public speaking while educating readers on how to automate their businesses.