Top 10 KPIs and Metrics for Google Analytics You Should Be Tracking in 2025
How not to get lost in the 500+ dimensions & metrics of Google Analytics? By defining the key performance indicators that really matter for your report.

Oct 20 2022●8 min read


- What Are Google Analytics KPIs?
- Is Google Analytics the Best Option to Track KPIs?
- 1. New Users
- 2. Returning Visitors
- 3. Bounce Rate
- 4. Average Time on Page
- 5. Average Page Speed
- 6. Goal Conversions
- 7. Top Acquisition Channels
- 8. Cost per Acquisition
- 9. Top Pages
- 10. Exit Rate
- The Best Way to Track These KPIs
- Bottom Line
This blog will discuss 10 KPIs you should track in Google Analytics to improve your client’s overall website, including everything from the copy on your landing pages all the way to the UI and UX.
What Are Google Analytics KPIs?
Google Analytics KPIs are metrics used to measure the success of your website and show how close you are to meeting your business goals. They include metrics like traffic, bounce rate, CTR, and conversion rates. These KPIs help you track performance and make data-driven decisions.
These KPIs are used to determine which pages perform best, which pages have the highest exit page rate, and how much time visitors spend on any page - among other things.
This information is critical if you want to improve the performance of your client's website, whether they sell a software product or run an ecommerce store.
This means that you must first set goals with your client. This will help and guide you as to what KPIs to track. Because if you want to improve the conversion rate, you will focus on KPIs such as bounce rate and cost per conversion instead of revenue and profit or search engine rankings.
Then, you need to troubleshoot your client’s website and detect site issues, and areas that need optimization, and learn what is working just fine and what needs to be improved.
Lastly, it’s all about running experiments, getting access to data and evaluating your progress. For this, you’d need to get a reporting tool that would allow you to connect multiple data sources and pull info from them.
Is Google Analytics the Best Option to Track KPIs?
As previously stated, if you want to improve your work, you'll need a reporting tool to track Google Analytics KPIs. This is easy to do with Google Analytics. It's free, convenient to use, and generates simple reports you can use to assess your clients’ business goals.
However, when it comes to the best, GA may not be it.
Google Analytics users on G2 talk about the tool’s limitations, such as:
- Reliability. Apparently, there are too many bugs that restrict marketers from getting accurate data.
- Customer support. Understandably, because the tool is free - there is no support to help you with those bugs.
- No cross-channel reporting. If you wanted to compare how your client’s audience behaves on the website and with your PPC campaigns, you wouldn’t be able to do it.
Now let’s cover those Google Analytics KPIs:
1. New Users
New users is a KPI that Google Analytics tracks whenever a new session is initiated on your client’s website. It gives an insight into the percentage of new people who landed on the client’s site for the first time ever.
Google keeps track of this number by determining whether or not a user already has a cookie. So this number is not 100% reliable as a single user could land on your client’s site from multiple different devices, yet each session will be counted as new.
Why do you still need to track it?
In a nutshell, it gives an overview of how well your marketing efforts are paying off to attract new people to get interested in a client’s business.
The new users KPI is about 2 things:
- Measuring how many new people learned about and got interested in your client’s campaign;
- Evaluating your paid and organic campaigns. This includes copy, CTA’s and keywords you target.
2. Returning Visitors
Next, we have returning visitors.
This KPI reveals the percentage of people who visited your client's website for the second or subsequent time.
Google Analytics, opposite to how it tracks new users, detects if a user already has a cookie present, which would imply that a user has already been on the client’s site before.
If you build an audience overview report in GA4, you will get a KPI called just users. This has nothing to do with returning users. Rather it measures ALL USERS. So, if you wanted to see a clear comparison new vs returning visitors, you’d need to filter the report.
Go to Audience > Behavior > New vs Returning.
So, why should you track it?
- It gives an overview of your client’s customer loyalty. The higher the return rate, the bigger loyalty customers show;
- Returning visitors often lead to lower bounce rates, higher avg., session duration, a higher number of pages they visited, etc.;
- It shows how well you manage your initiatives to build an engaged audience from your website traffic.
3. Bounce Rate
Third on the list is a KPI called bounce rate.
This KPI is measured in percentages and tracks people who come to your client’s site, take zero actions and leave.
This KPI is essential for digital marketing agencies to track because it allows for the identification and resolution of technical issues with the website performance (perhaps your client's site is not mobile-friendly) or content gaps (perhaps your content is not sufficiently covering certain topics). A high bounce rate will generally harm your marketing strategy efforts, so lowering it should be your top priority.
Furthermore, tracking your bounce rate accomplishes the following:
- Identifies the data sources from which users are drawn, such as social media or organic traffic;
- It is useful to see how users interact with the client's website pages;
- Determines which data sources have the lowest and highest bounce rates.
4. Average Time on Page
This is one of the most important KPIs, particularly for copywriters and SEO specialists. It’s called the average time on the page.
Basically, it shows the average time all the visitors spend on any particular page.
The longer they stay on a single page, the better it is optimized, answers audience questions, and has a high user intent. It also gives insight into whether or not your content is engaging and relevant to that audience. In short, whether your marketing campaigns are performing or not.
However, keep in mind that long average times on certain pages could mean errors. For example, if you see that the checkout pages have a high average time, it can indicate that there are some issues with load speed, credit card payments, etc.
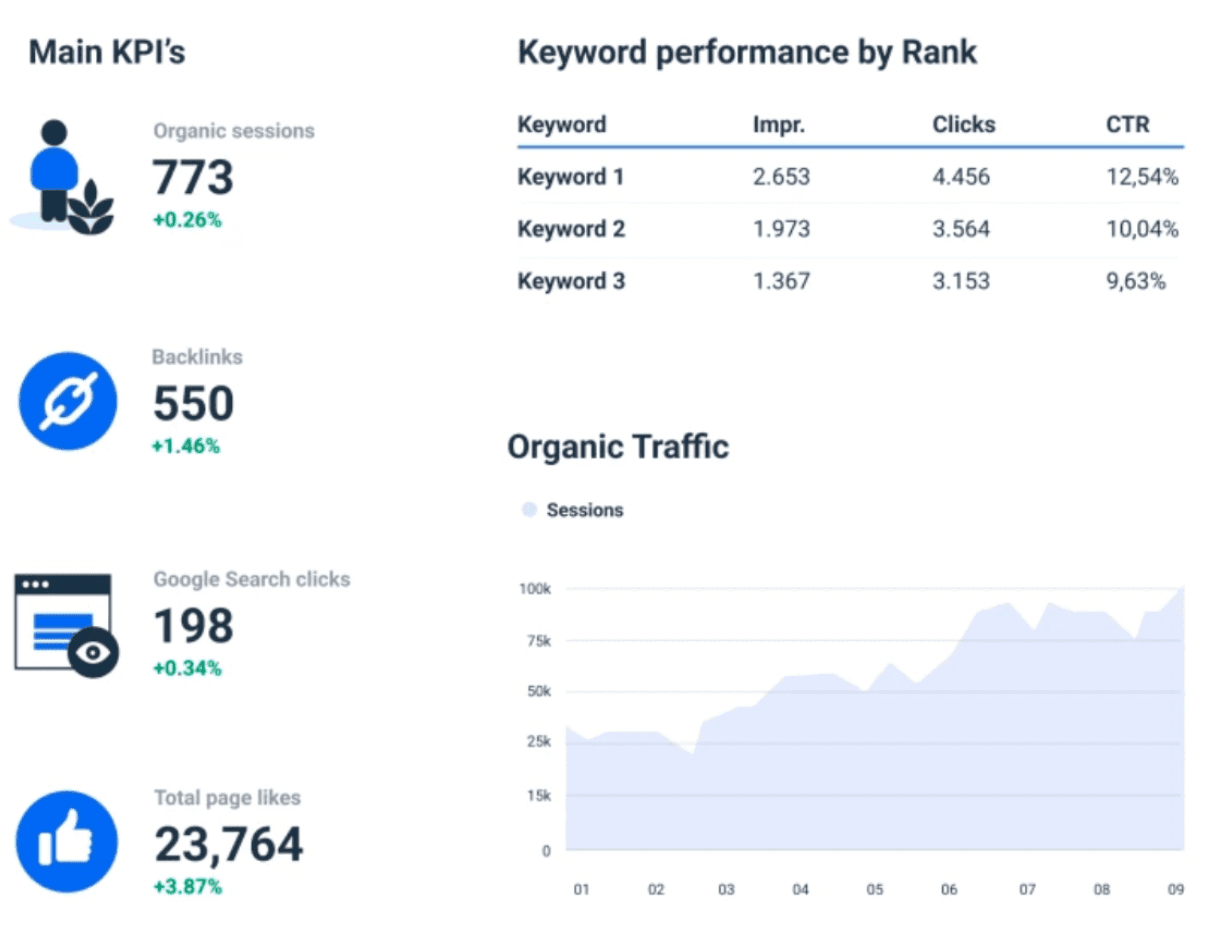
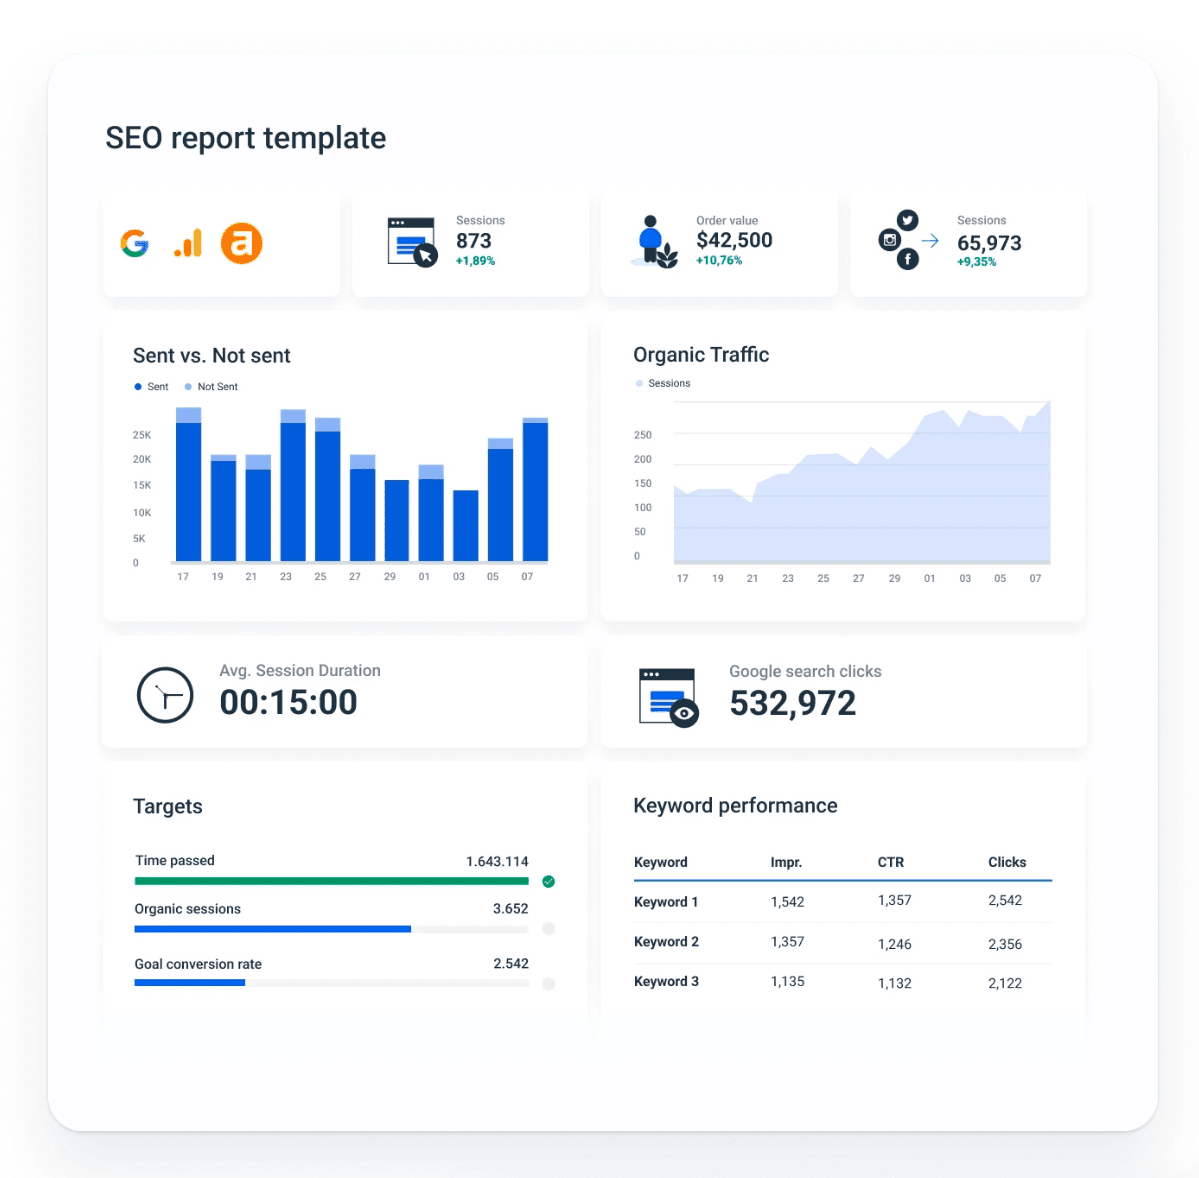
If you need a modern and fast SEO reporting tool to track all these KPIs, take a look at the example above. This is a preview of what your next report could look like, with all the key metrics included.
5. Average Page Speed
Your content is perfectly optimized, generating massive traffic, but your bounce and exit rates are also at an all-time high? Double-check your client’s average page speed as this is one of the crucial Google Analytics metrics.
Average page speed might seem like a KPI that is not crucial, but when you think about it, it’s all about user experience.
Did you know that we humans aren’t patient? Your site should be optimized to load within 3 seconds, as 40% of people won’t wait longer than that.
Here are quick tips to improve your site speed:
- Compress all your visuals;
- You can try reducing redirects;
- Choose a better site hosting solution;
- Cache your web pages.
6. Goal Conversions
Goal conversion, or goal completion, measures how many users take your anticipated action you are tracking.
Google Analytics calculates this KPI by dividing the total sessions by the number of goal conversions, times 100.
For example, if your goal is ‘100 sign up for a product newsletter, whenever you get a sign-up, it will count as a completed goal. If you have 150 sessions and 7 successful sign-ups, your goal conversion rate is (7/150)x100=4.6%
Evaluating and measuring goal completion rates can tell you how well your client’s site is performing in particular areas of interest. A low rate indicates that you don’t motivate people enough to take the desired action, whereas a high one indicates that your efforts are paying off.
Other reasons why it is important to track goal conversions:
- It gives insight into the quality of your produced marketing materials.
- A high lead-to-win rate means your campaigns generate high-quality leads for your sales team.
- Your sales funnel's success can be measured.
- A high goal completion rate shows that your campaign inspires your target audience to act.
Learn about goal completion by downloading a complete GA4 dashboard template designed specifically for agencies.
7. Top Acquisition Channels
There is a time in marketing strategy when marketers plan to retarget people who have already considered buying a service or product, visited a client’s site or made a purchase.
Finding top acquisition channels helps to identify which sales and marketing channels are the most popular and most successful when it comes to acquiring customers.
Google Analytics tracks and presents top acquisition channels KPI and clearly filters those channels into: direct, organic search, referral, paid search, social, and other. This helps to see which channels are performing the best and which one need more effort in improving the number of sessions and users.
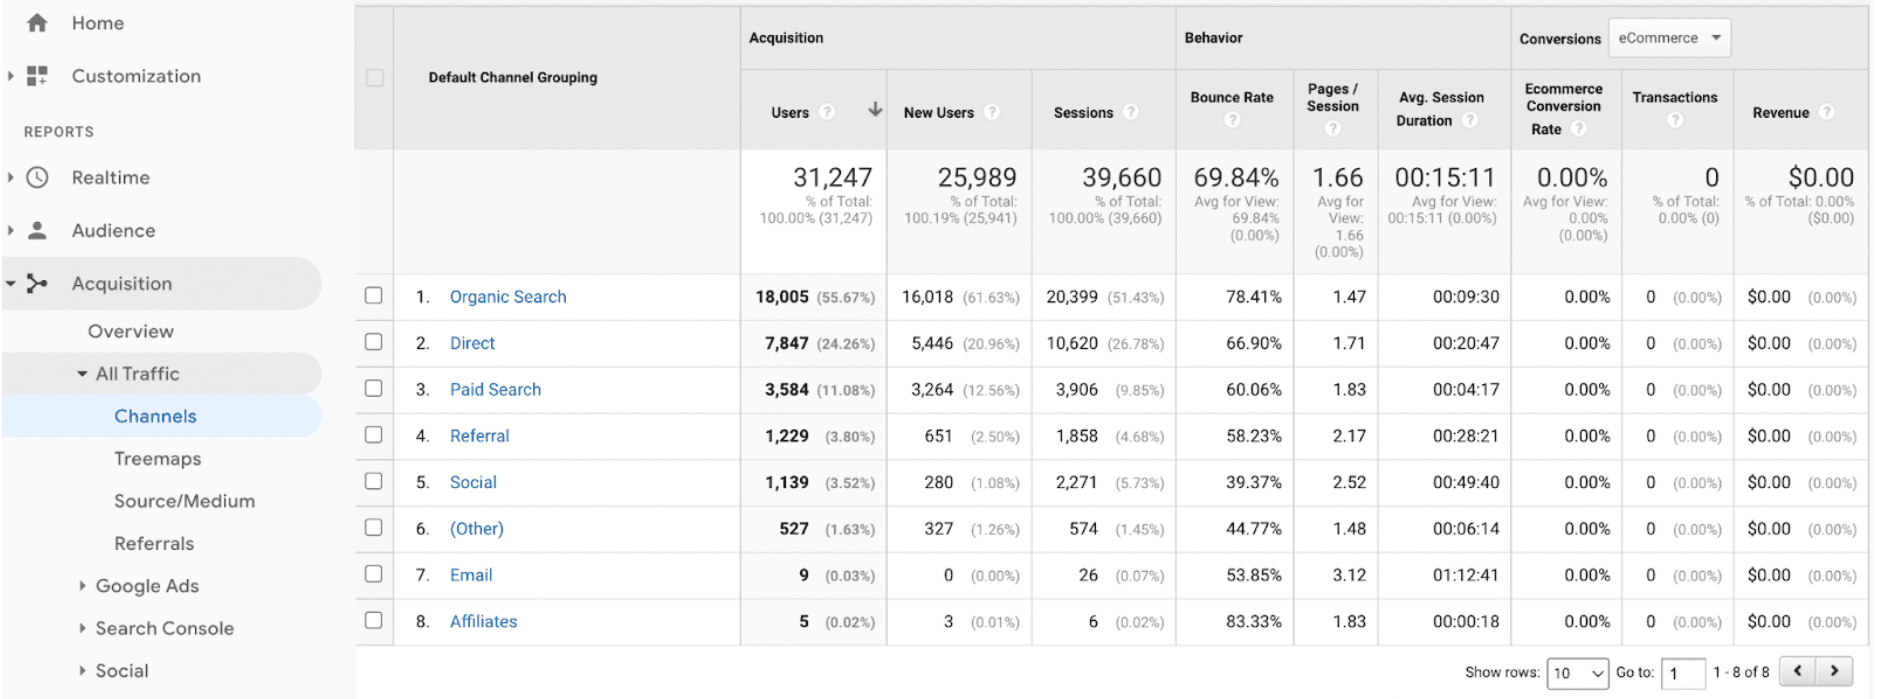
This easy comparison table allows marketers to compare the performance of different channels. It also prevents you from overspending money and wasting time on underperforming sites.
For example, you focus your efforts on PPC and targeting certain branded keywords. You see that traffic has increased in your paid search, and specifically from the source ‘Google ad’. Well, congratulations, you are driving traffic to your client’s site and the number of users is bound to increase.
8. Cost per Acquisition
Now that we covered top acquisition channels, you also need to track the costs of acquiring a single customer.
This action could be anything from generating a lead or a click, to a purchase or a sign-up.
Note: There is no benchmark against which to compare your CPA. It will ultimately vary depending on the client’s business, industry, products, and prices. However, a good rule of thumb is that the lower the cost, the better your ad campaign will perform with your demographics.
CPA is particularly significant to monitor as it allows you to get a glimpse at the effectiveness of your ad campaign. CPA should be calculated alongside other metrics such as ROI, ROAS, and conversion rate. This will get you a complete picture of how well your ad campaign is performing. If you measure your cost per acquisition and discover that it is higher than expected, this is a sign that your strategy needs to be reviewed and optimized.
9. Top Pages
Top pages refers to the first pages visitors land on the client’s website. For example, checkout page, about us page, features page, etc.
Examining the type of these top websites is crucial as it tells you the brand awareness level of website visitors, their intent and interest.
How can marketers take advantage of that?
They can use this data to optimize top pages in order to reduce conversion journeys. This includes improving CTAs, possibly including visuals, and writing compelling copy that targets people's intent.
It's also about giving these website visitors a better experience. Understanding their behavior and intent is critical for conversion metrics.
10. Exit Rate
Lastly, we got the exit rate.
This is an important metric if you want to know how frequently people leave a specific page.
For example, a user may arrive at the pricing page, then click on the features page, and then leave. That’s an exit on the features page.
The total exit rate for the features page is then calculated as the number of exits divided by the number of pageviews received.
Monitoring exits can help you understand the effectiveness of specific pages on your client's site: if you know which page(s) people are exiting the most and at the highest percentage (i.e. the exit rate), you can determine which pages need to be improved.
Note: high exit rate is NOT always bad. When you think about it, a user has to leave at some point. Even though you can improve those pages with the highest exit rate, you should also consider - context. If a user exits on a thank-you page, high exit rate is desired. But if it’s on the checkout page, you need to investigate and tackle issues ASAP.
The Best Way to Track These KPIs
Obviously you can use Google Analytics to track these and other GA data and metrics. The tool is free and generates clear reports.
However, if you work with multiple clients managing multiple different accounts - it may not be an efficient way.
Moreover, Google Analytics is not for everyone as its UI and UX are not optimized and designed for a regular marketer who doesn’t have a tech background. Not only that but their customization options are extremely limited, they offer no customer support or a feature to simply automate Google Analytics reports.
Solution?
Build a Google Analytics report in less than 5 minutes and track crucial marketing KPIs with Whatagraph.
Save time by using pre-made templates, an Overview feature to oversee all your clients and an automation feature to send regular reports.
You can also improve client reporting by using one of our customer-favourite features called white-label. Change our Google Analytics 4 report template to match your own branding and personalize reports to impress your clients.
Bottom Line
Launching any strategy related to Google means - huge volumes of data. It’s great because with the right reporting tool you can easily understand it all and apply gathered knowledge in future campaigns. But it can also be overwhelming due to not knowing which KPIs to track.
Even though this KPI may not meet your ‘niche’ goals, it provides the top 10 of the most useful and common KPIs. They all allow you to get insight into clients’ behavior, sales funnel, retention, etc.
Start reporting with Whatagraph and you won’t lose any of this important data. Book a call and find out how Whatagraph can help
Published on Oct 20 2022
WRITTEN BY
Dominyka VaičiūnaitėDominyka is a copywriter at Whatagraph with a background in product marketing and customer success. Her degree in Mass Communications/Media Studies helps her to use simple words to explain complex ideas. In addition to adding value to our landing pages, you can find her name behind numerous product releases, in-app notifications, and guides in our help center.