12 Top KPI Reporting Tools for Agencies in 2025
Keeping up with technology, getting data messages across effectively, allocating budget, saving time, creating engaging content, and monitoring its engagement… these and many more data-related agency pain points can be a proper drag. At the same time, they can all be solved with modern and powerful data reporting tools.

Feb 11 2020●8 min read


Choosing a reporting tool is just as important as choosing the right type of marketing campaign for your clients. Do it right, and you’ll save time and money. Do it the wrong way and you’ll make a dent in your budget and waste precious time.
Today, we prepared a list of the very best KPI reporting tools for agency use. These tools are robust, easy to use, and can easily handle many data points.
Let’s dig in.
1. Whatagraph
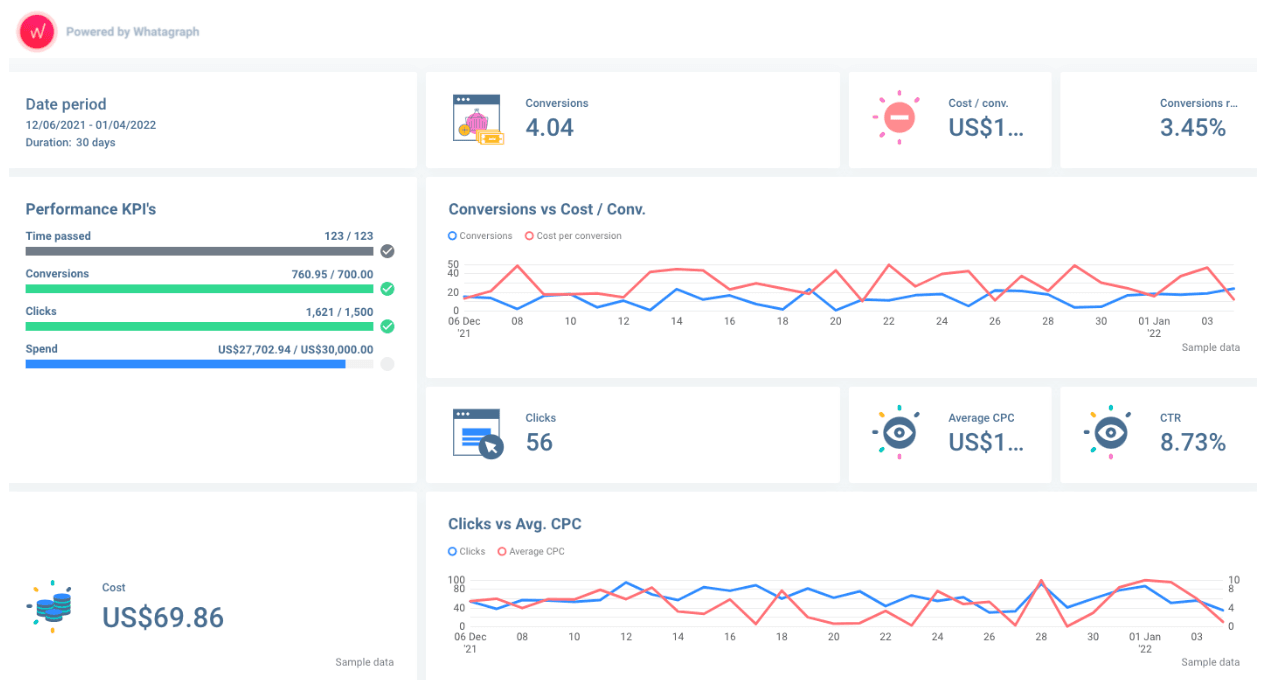
Whatagraph is a reporting software marketing agencies use to create and automate dashboards and reports. It provides actionable insights, has flexible functionality and drill down features.
Best Features
- KPI reports can be customized. This means you can drag and drop the widgets you need to see the data you want and remove any distracting elements.
- Provides comprehensive data without limitations. Whatagraph will report if the audience is from more than 30 countries. This is true for all KPI metrics.
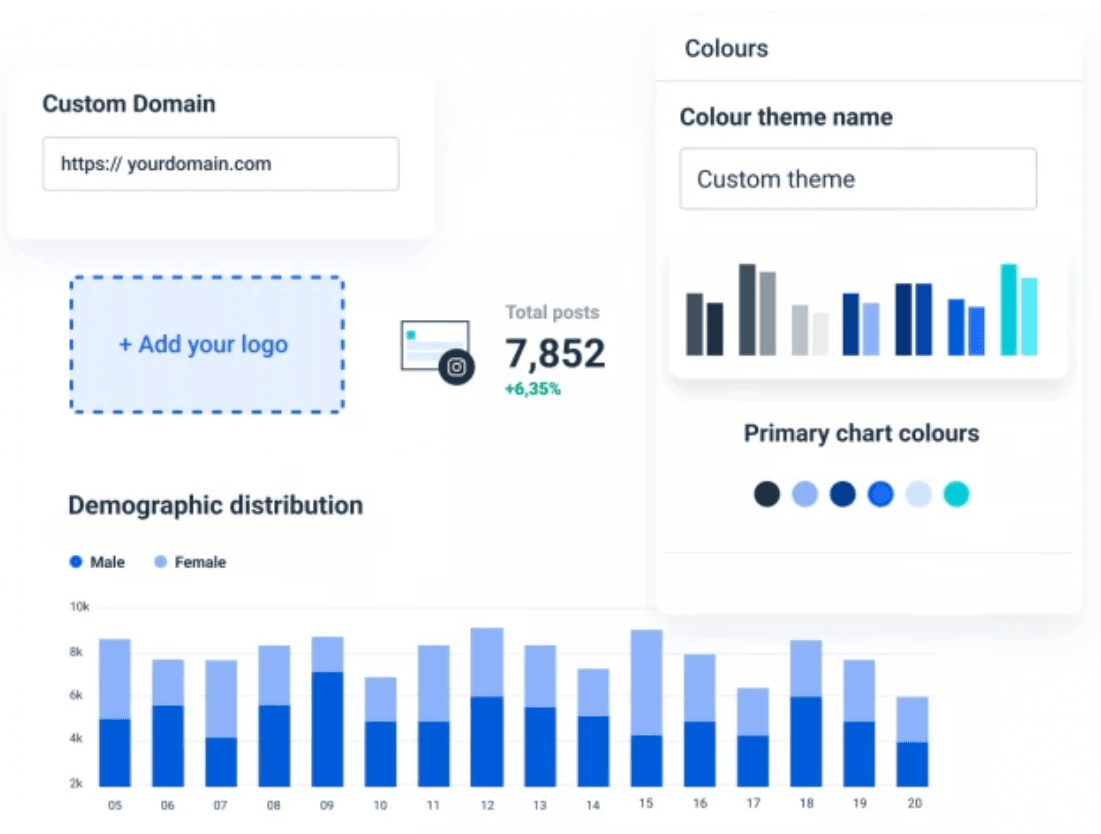
- Reports can be white-labeled. This means that marketing agencies can change logos, colors, fonts, and other details to match their branding and style better. In other words, the reports look like they come from your agency and not from Whatagraph’s tool.
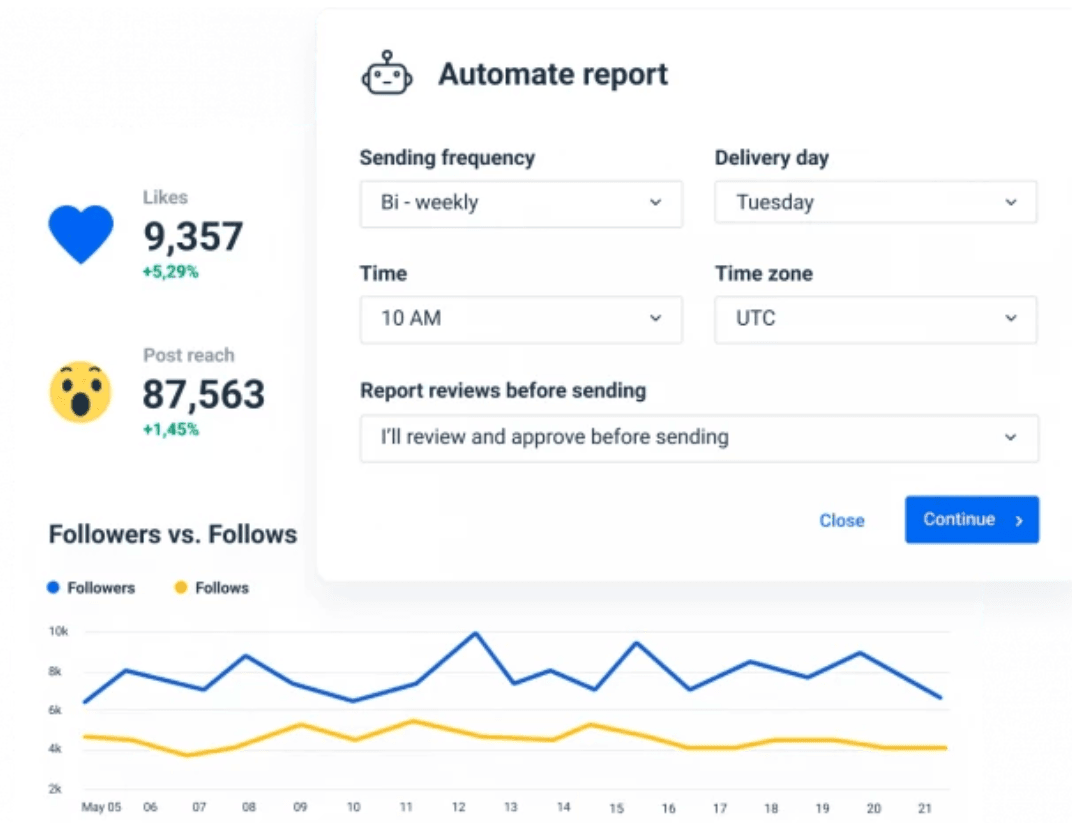
- You can send automated KPI analytics reports to clients at predetermined intervals that you can set yourself. Weekly, biweekly and monthly - anything that comes to you and your client’s mind.
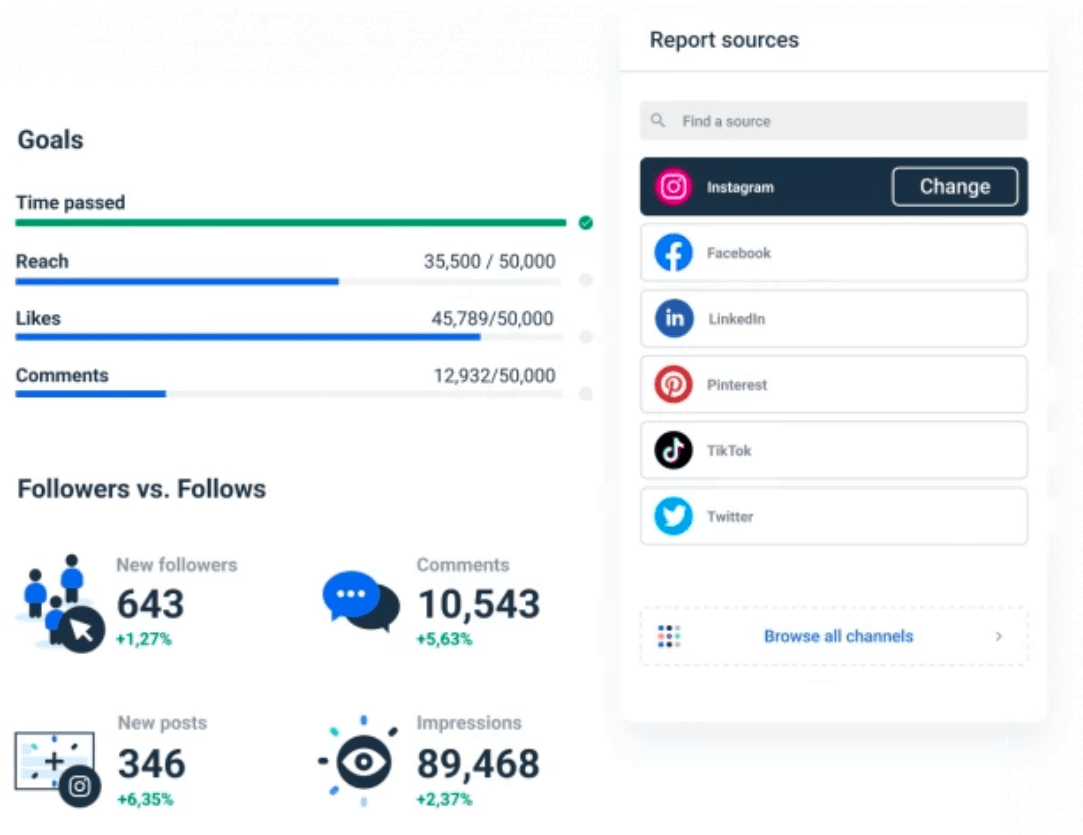
- You can generate a cross-channel report comparing Instagram's performance to other channels such as social media platforms (Facebook, Twitter, YouTube, Pinterest, etc.) or Google Analytics. Whatagraph integrates with over 40 platforms, ensuring that you report on the exact channels you cover for your clients.
- By creating a dashboard, you can access real-time and historical data for that account.
- You can save time using the KPI reporting tool instead of creating a report from scratch.
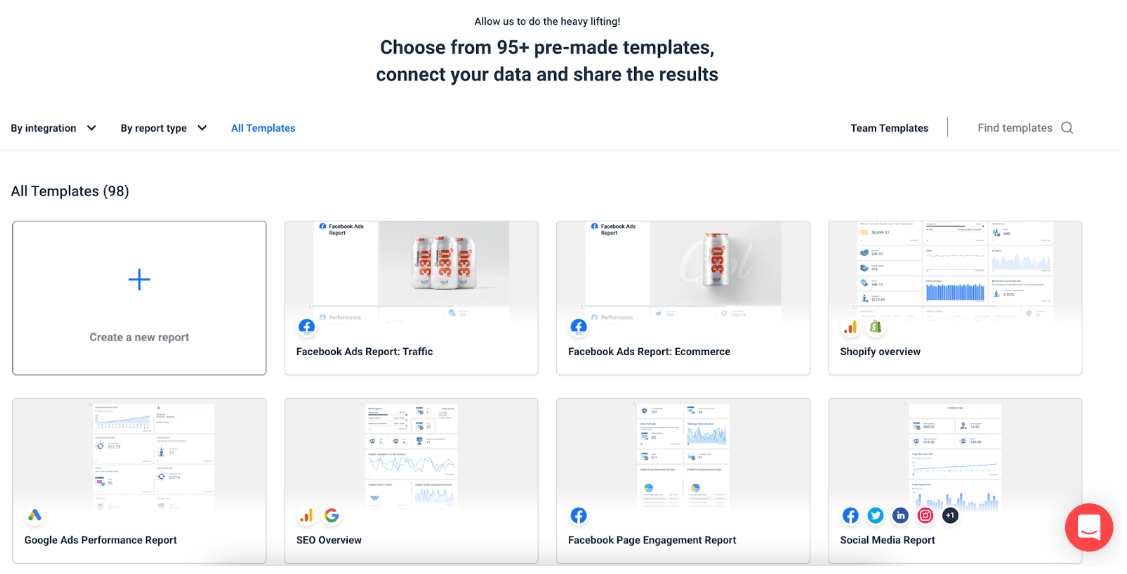
- You can gain access to a pre-made gallery containing over 90 ready-to-use templates.
- 24/5 customer support service.
- You can get a dedicated account manager to help you with any requests. If you’re having trouble getting started and creating your first report, we’re there to help.
- You can download it as a desktop app and use it as a native app.
Learn how to build a KPI dashboard.
Whatagraph also offers:
- A chance to become a Whatagraph partner;
- Help center with a convenient search button where you can type keywords of your question and in no time get answers;
- Blog, where you can find tips and tricks on creating different types of reports; newsflashes; industry news; case studies; and product updates;
Pricing
Whatagraph's pricing scales with your needs. Check out our pricing page for the most up-to-date information.
Who Is It Best For?
Whatagraph is built for freelancers, marketers, business owners, and marketing agencies. Our reporting tool would benefit anyone promoting their business and needs data to create optimized strategies. However, marketing agencies can benefit from Whatagraph the most.
2. Metrics Watch
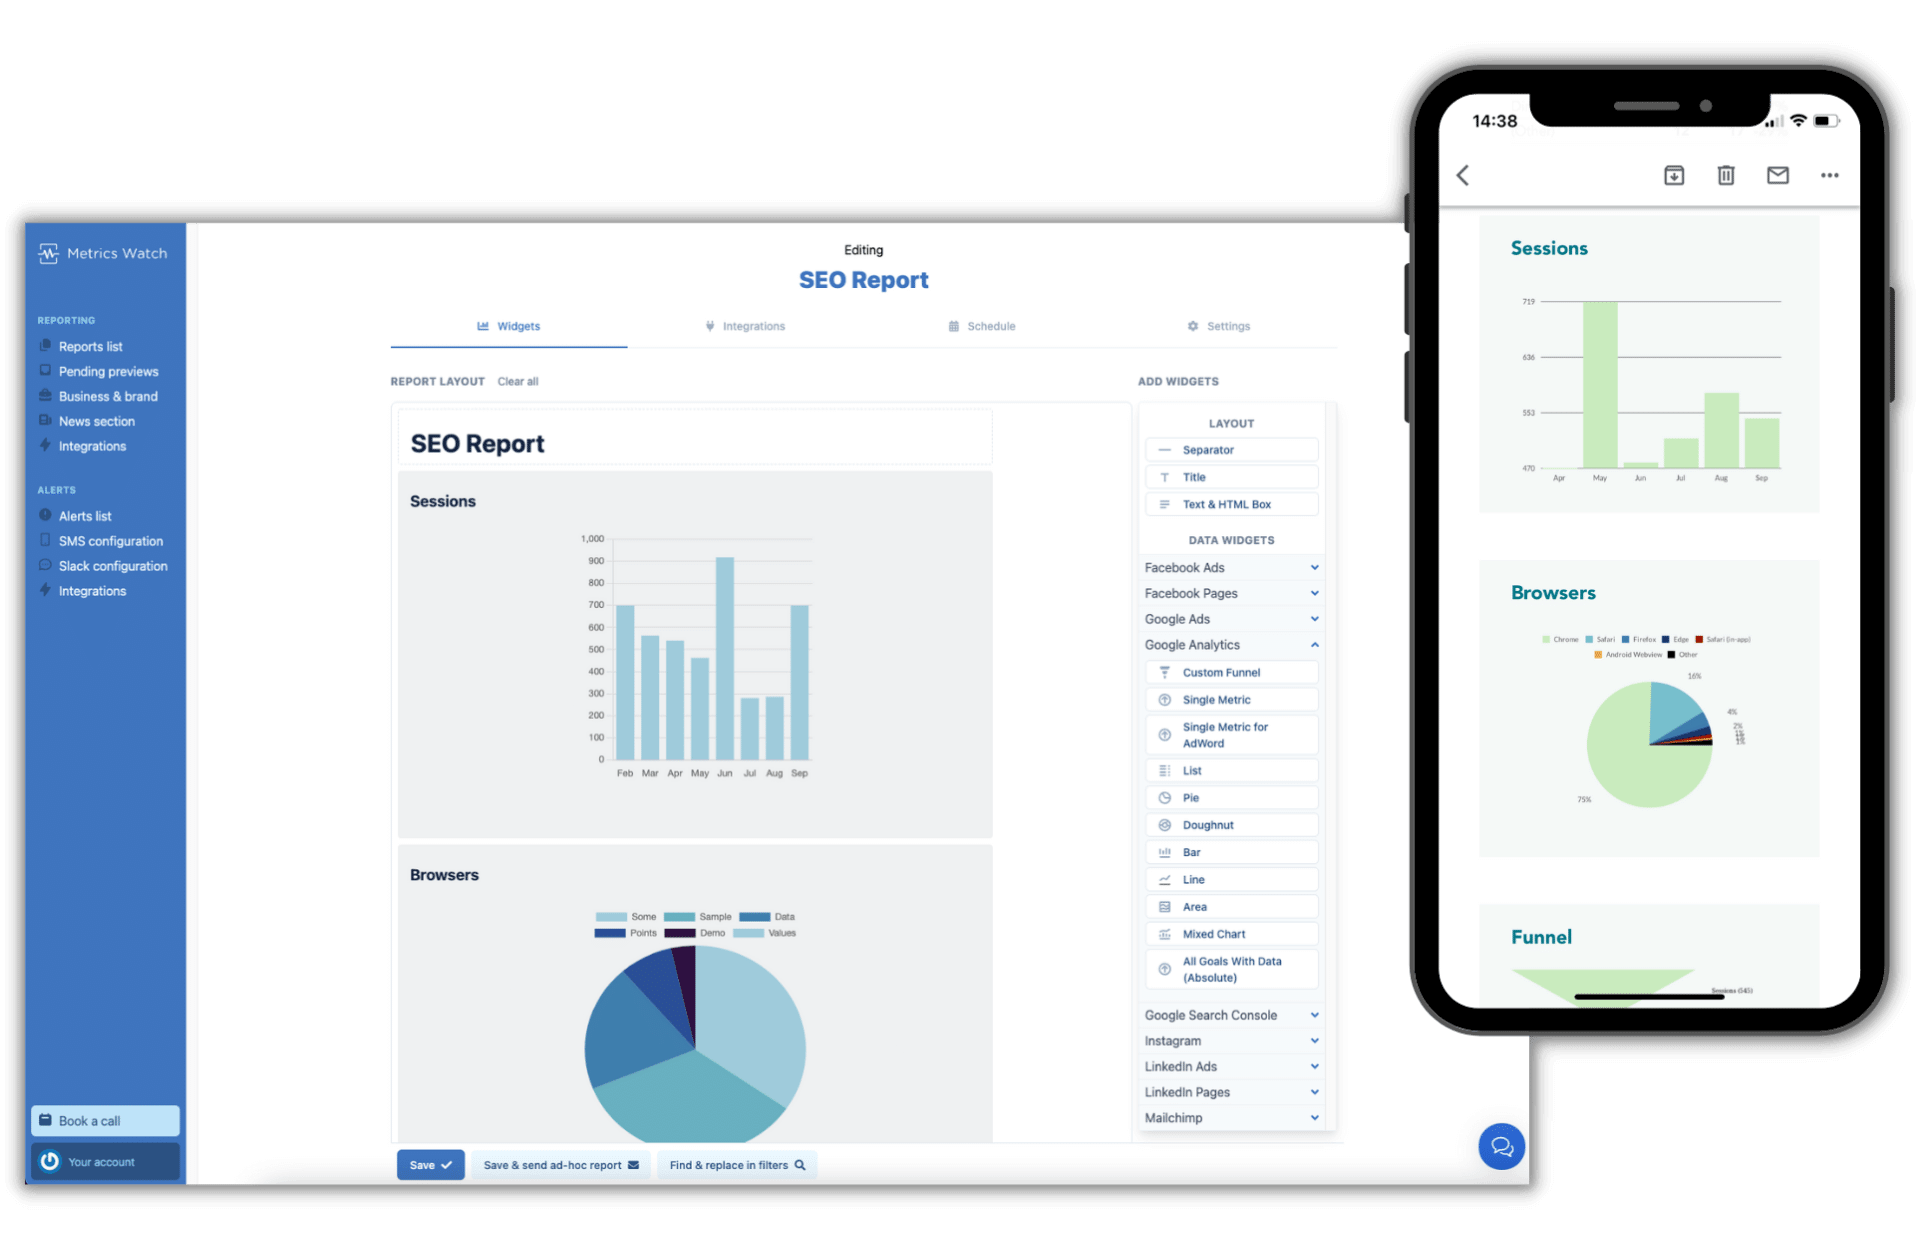
Metrics Watch is an email-based reporting tool designed to reduce friction between marketers and their data. It does this by using the body of the email itself to display charts and graphs, so you can send professional marketing reports without the need for PDF attachments or third-party links.
Top Features
- Email-based marketing reports
- In-body reports (no PDFs or links)
- Fully automated
- Connects with popular data sources
- Sample report templates
- PPC Markup
Metrics Watch also offers the following resources for all plans:
- White-label options
- Concierge service
- Rapid support
Here is what the Metrics Watch report builder looks like (with mobile preview):
Pricing
Metrics Watch offers a free 14-day trial (no credit card required).
- Starter - $29/mo
- Pro - $50mo
- Premium - $100/mo
- Enterprise - Custom based on your needs
Who is it for?
Metrics Watch has plans that cater to marketing agencies, in-house marketers, and business owners alike.
3. Google Data Studio
Google Data Studio - a popular business performance reporting tool amongst many marketing agencies. One of the main reasons is that it is (seemingly) free to use. Here are some other reasons why Google Data Studio is such a popular choice for agencies and marketers.
Top Features:
- Multiple users can edit a report at the same time;
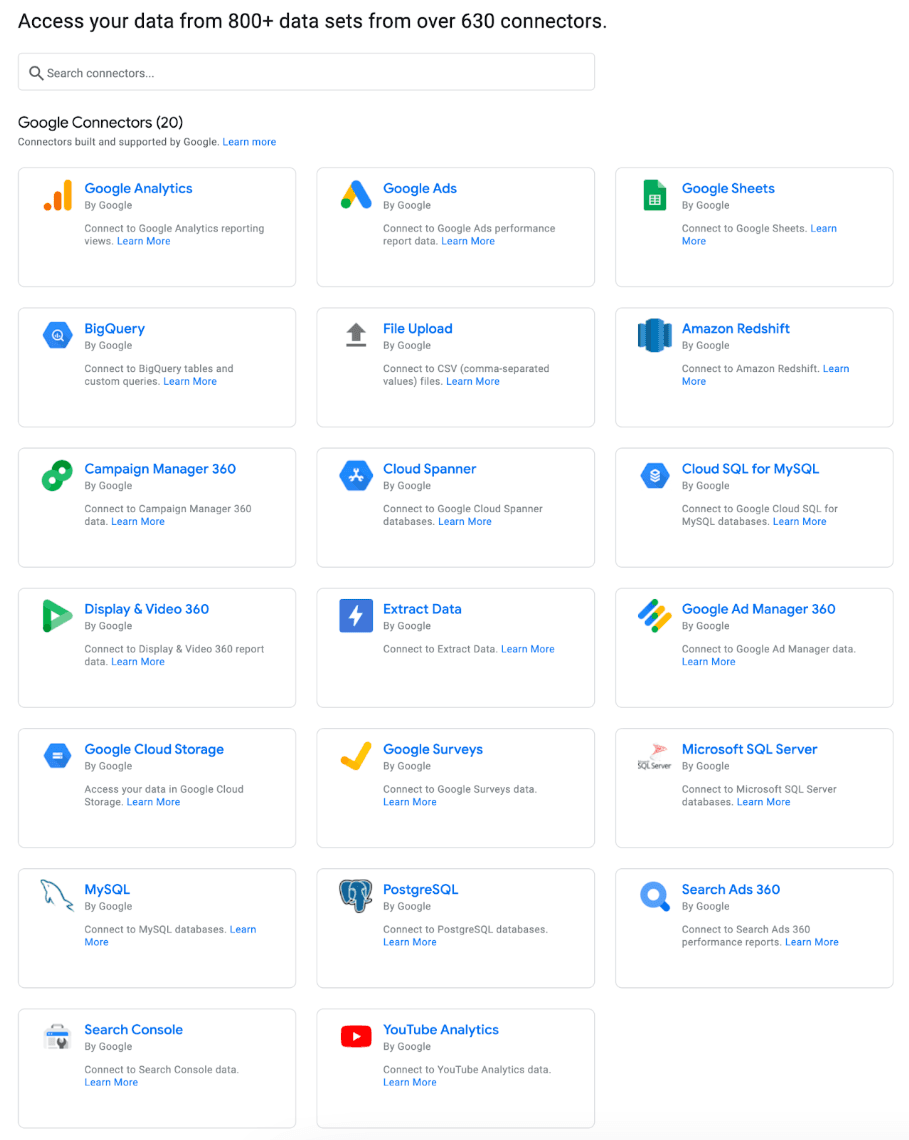
- More than 600 connectors* are available;
- Dashboard personalization;
- Simple to create a report;
- Data visualizations that are interactive;
- Shareable dashboards;
- Tools for filtering;
- Track KPIs in real-time.
Pricing
GDS is free when used with 20 free connectors. To understand their pricing better and what the actual prices are, take a look at this Google Data Studio pricing guide.
Who is it for?
Google Data Studio is great for marketing agencies, freelancers and business owners. However, if you run a marketing agency and need to add many connectors and data sources, you’ll quickly realize that this tool is far from free and can cost quite a bit compared to the other entries on this list.
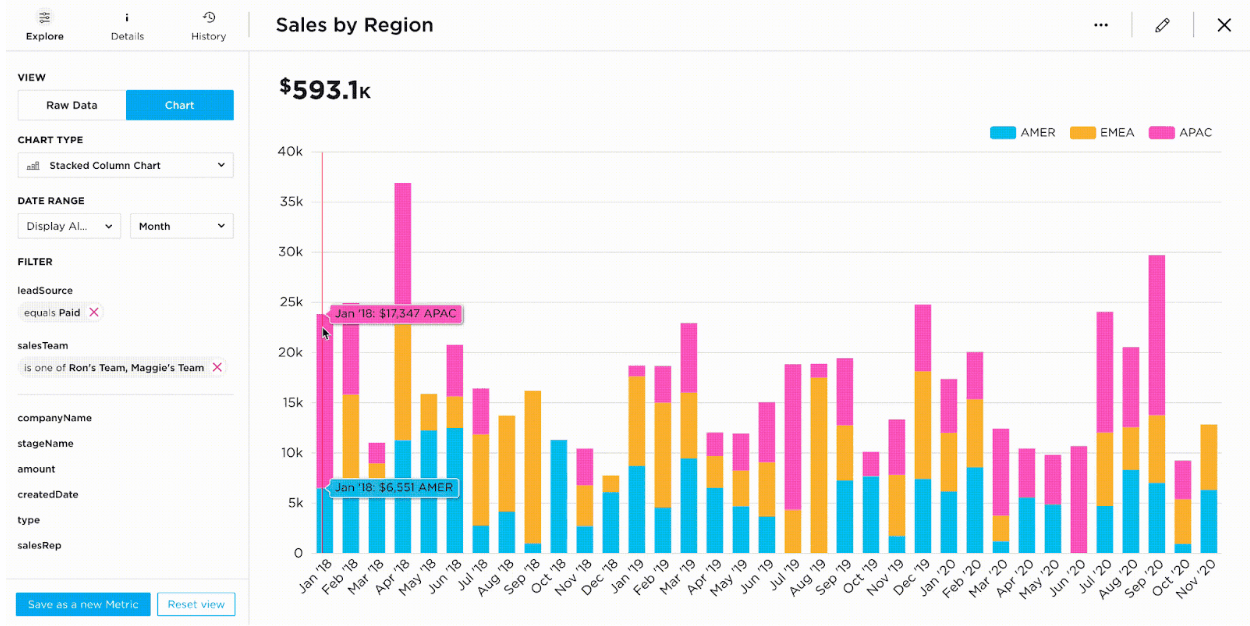
4. Tableau
Tableau is a BI data visualization tool.
It enables users to create various graphs, bar charts, maps, dashboards, and stories to visualise and analyse data to aid in business decisions. Tableau has many distinctive and exciting features that make it one of the most popular business intelligence tools.
Top Features include:
- Real-time business data;
- Data blending;
- Interactive dashboards;
- More than 60 connectors with different data sources;
- Allows to share data with team members and clients (yet, they don’t offer automation features);
- It has a fool-proof security system;
- Cross-database join;
- Collaboration tools.
Tableau also offers resources such as:
- Good customer service;
- Tableau community;
- Tableau certifications and learning.
Pricing
Depending on your monthly needs and requirements, Tableau offers a couple of monthly pricing packages:
- Tableau Viewers - $15;
- Tableau Explorer - $42;
- Tableau Creator - $70.
Who is it for?
Tableau says their tool is designed for ‘analyst, data scientist, student, teacher, executive, or business user’.
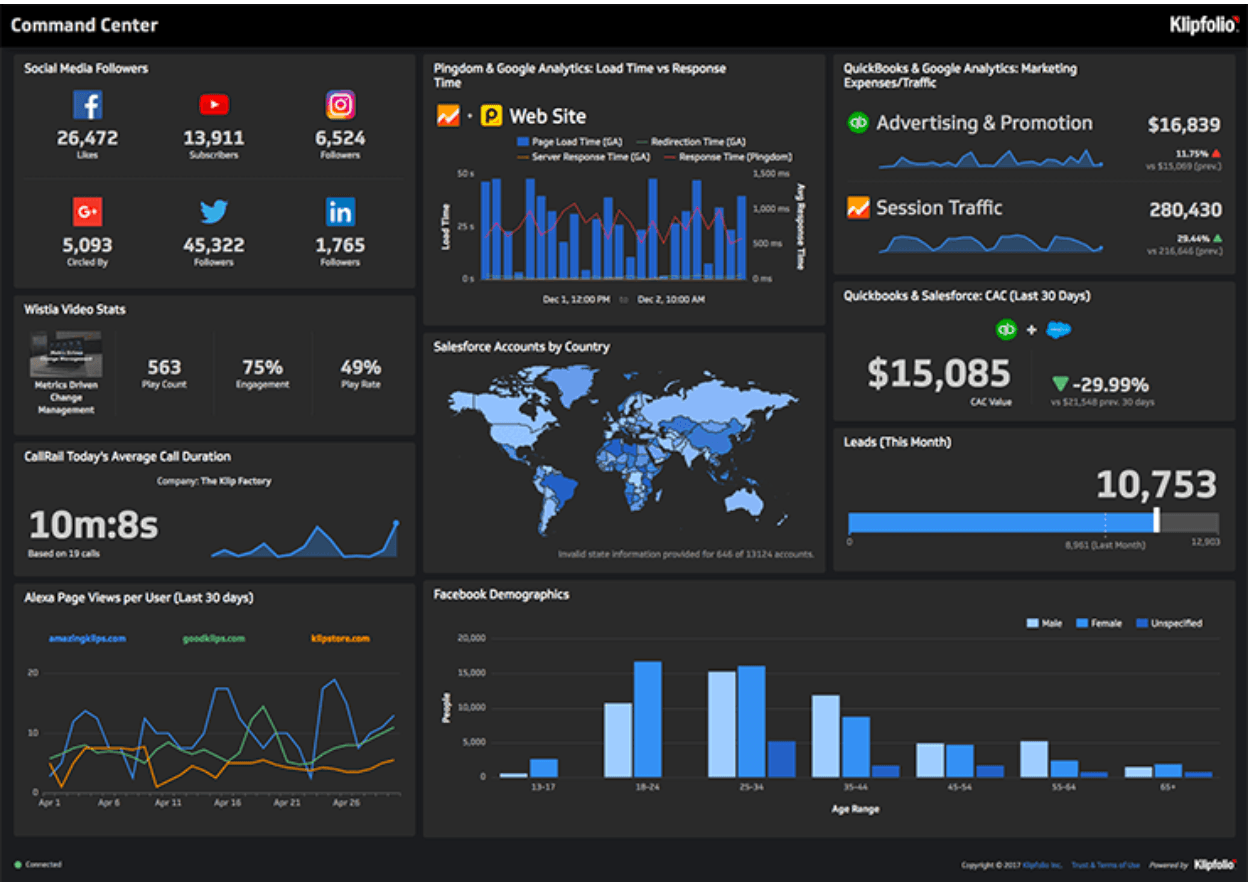
5. Klipfolio
Klipfolio is an analytics software that pulls, aggregates and visualizes data. Klipfolio is a visual metrics platform, it can be used to display your client’s company production and highlight stats. This BI tool provides a user-friendly UI for data visualization and clear data documentation.
Top Features:
- Integration APIs;
- Data modeling;
- Data visualization;
- Report automation;
- Report and dashboard customization;
- 300+ integrations;
- Customer support;
- White-label.
Here is an example of what a Klipfolio marketing dashboard looks like:
Pricing
Klipfolio offers 14 days free trial with all pricing packages.
You can choose if you want to sign a monthly or annual contract:
Agency Starter - $54/mo;
Agency Lite - contact the Klipfolio team for info;
Agency Pro - contact the Klipfolio team for info;
Agency Premier - contact the Klipfolio team for info.
Who is it for?
Klipfolio primarily focuses on providing the best service to marketing agencies. While it does offer a competitive package, the lack of transparent pricing can be a good reason to look at some competitor entries here.
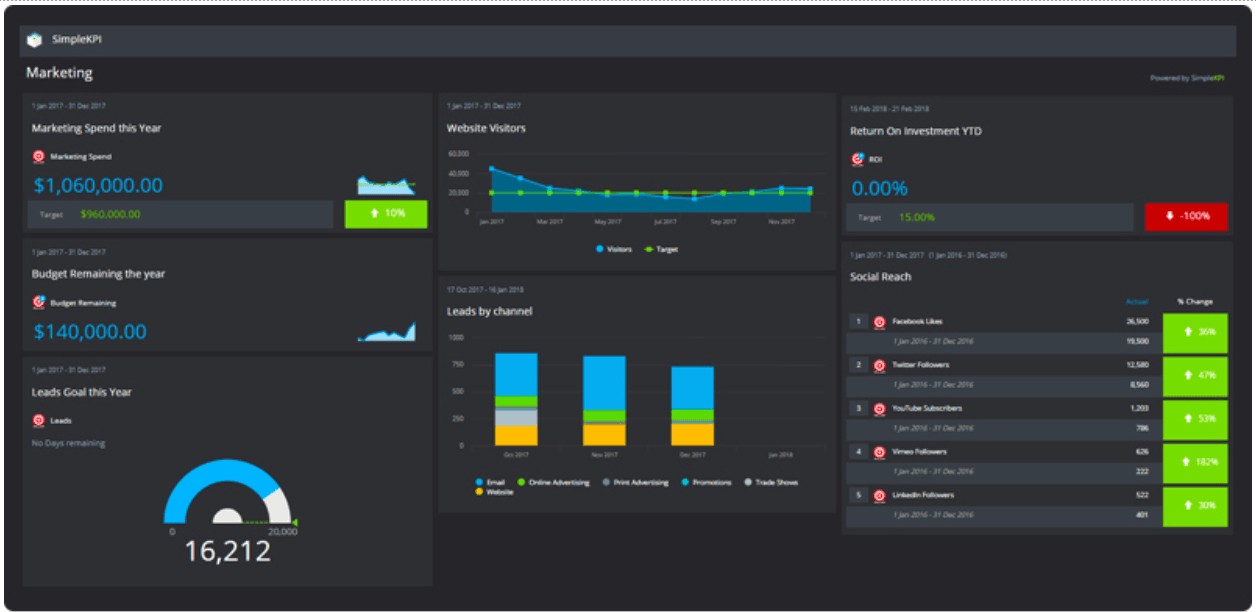
6. SimpleKPI
SimpleKPI is a comprehensive online KPI software solution that includes all the features needed to manage, create, and monitor your Key Performance Indicators (KPIs). It assists marketers in defining and measuring progress toward their business success and provides the ideal combination of KPI entry, management, and reporting - all in one place.
Top Features:
- 24Hhr online support;
- Sharable dashboards;
- KPI templates;
- Customization;
- Export in PDF and Excel spreadsheets formats;
- KPI library;
- Dashboard template gallery.
SimpleKPI offers additional KPI tools:
- KPI dashboard;
- KPI reporting;
- KPI analytics;
- KPI tracking;
- KPI templates.
Here is what the SimpleKPI marketing dashboard looks like:
Pricing
SimpleKPI's standard £79 subscription period is monthly. You can, however, subscribe and pay every three months, six months, annually, or every two years.
SimpleKPI offers a 50% discount for charities, educational institutes, and non-profits.
Who is it for?
SimpleKPI brands itself as a business reporting tool. So, according to them, the tool is best for businesses, enterprises, and start-ups.
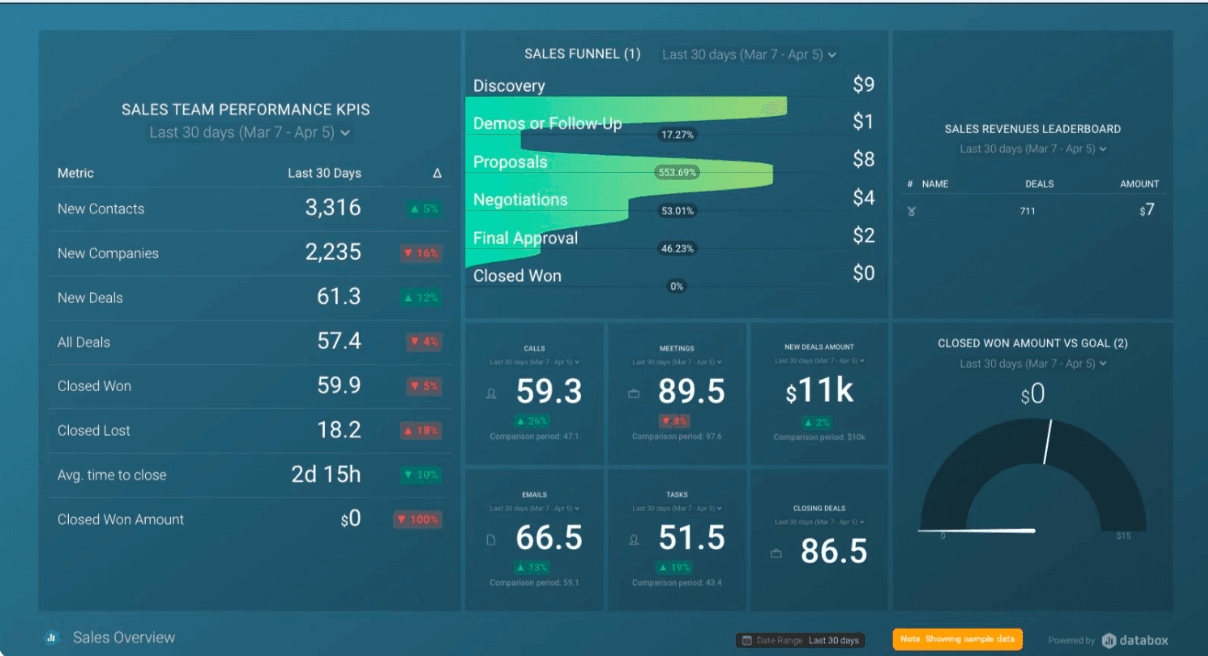
7. Databox
Databox is a business software solution for analysts, CEOs, and decision makers that need quick and simple access to their data.
Databox allows marketers to connect and pull data in one place, visualize performance trends and patterns, track progress and make data-based decisions.
Top Features:
- 70 integrations;
- Goal tracking;
- Daily and weekly scorecards;
- Alerts & insights;
- Automation;
- Real-time data;
- White-label;
- Customization.
This is what the Databox sales dashboard looks like:
They also offer resources such as:
- Guided and personalized 1:1 onboarding;
- Agency consulting;
- Certifications;
- Blog;
- Affiliate program.
Pricing
Databox offers a free-forever plan which allows marketers to create a free account with 3 data source connections, all standard features, and 60 integrations.
You can get monthly or annual paid plans that look like this:
- Starter - $91/mo;
- Professional - $169/mo;
- Performer - $289/mo.
Who is it for?
According to Databox, their tool is most beneficial to CEOs, analytics, decision-maker, and small businesses. This means, that if you are a marketing agency working with multiple clients, this tool may not be appropriate for you and you might want to look for an alternative.
8. Grow
Grow introduces itself as a ‘no-code full-stack business intelligence (BI) platform that empowers everyone in your organization to make data-driven decisions. They clean, aggregate and transform data into visual graphs for better data analysis. Moreover, the Grow reporting tool allows you to connect raw data and store historical snapshots of entire tables.
Top Features:
- Offers databases including MySQL, SQL Server, Postgres, Redshift, and BigQuery;
- Storage flexibility
- Data visualization;
- Customization;
- Dashboard filtering:
- Automation;
- White-label;
Grow also offers:
- Blog;
- Help center;
- A chance to become a Grow partner;
- Various resources for marketers.
This is what their reports look like:
Pricing
Grow.com has not provided pricing information for its product. You need to contact them to get a personalized pricing package.
Who is it for?
Grow focuses on business, no matter their size. They’ve got a page with some of their customers listed, and you can tell they are working with around 1,000 business leaders.
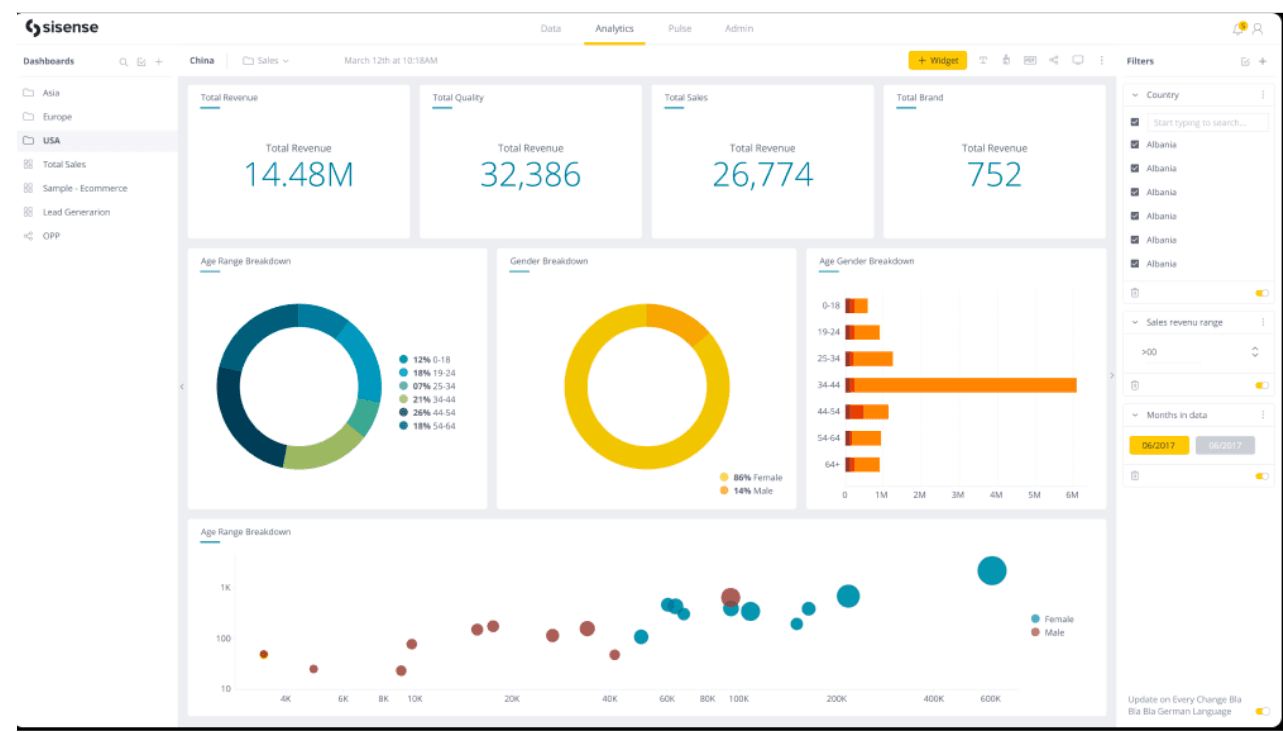
9. Sisense
Sisense is a complete business analytics software solution that allows users to easily create reports and analyze data, covering the entire analysis process from data integration to visualization.
Top Features:
- Interactive widgets;
- Data modeling;
- Data filtering;
- Integrations APIs;
- Predictive analytics;
- Centralized data hub;
- Pre-made dashboards;
- Data export to CSV, PDF, Excel, images, and other formats.
They also offer:
- Different customized solutions by industry (healthcare, retail, manufacturing, tech, financial services, pharma, and life sciences);
- Good customer service;
- Resource library;
- Blog;
- Training courses;
- Pre-made dashboards.
This is what their dashboards look like:
Pricing
Sisense has not provided pricing information for their product. You need to contact them to get a personalized pricing package.
Who is it for?
Sisense is a great tool for organizations that need simple and quick data analysis. Sisense recommends its tool to healthcare, retail, manufacturing, tech, financial services, pharma, and life sciences industries.
10. Supermetrics
Supermetrics collects all of your marketing data and delivers it to your preferred reporting, business intelligence, or storage platform — whether that's a spreadsheet, a data visualization tool, a data lake, or a data warehouse.
Top Features:
- Real-time reporting;
- Report scheduling and automation;
- Data mining;
- Retroactive reporting;
- Metric segmentation;
- Business intelligence;
- Data analytics;
- Custom reports and dashboards;
- Data visualization & presentation.
Pricing
Supermetrics has 3 pricing options:
- Supermetrics for Data Studio - €69.00/ 1 user Per Month
- Supermetrics for Google Sheets - €99.00/ 1 user Per Month
- Enterprise plans - contact customer support/ per year.
Who is it for?
Considering their features, this tool is best for data analytics and engineers who need various platforms to pull data from. As, for example, a marketing agency would use a reporting tool that won’t need extra resources and would have the most common marketing integration built within.
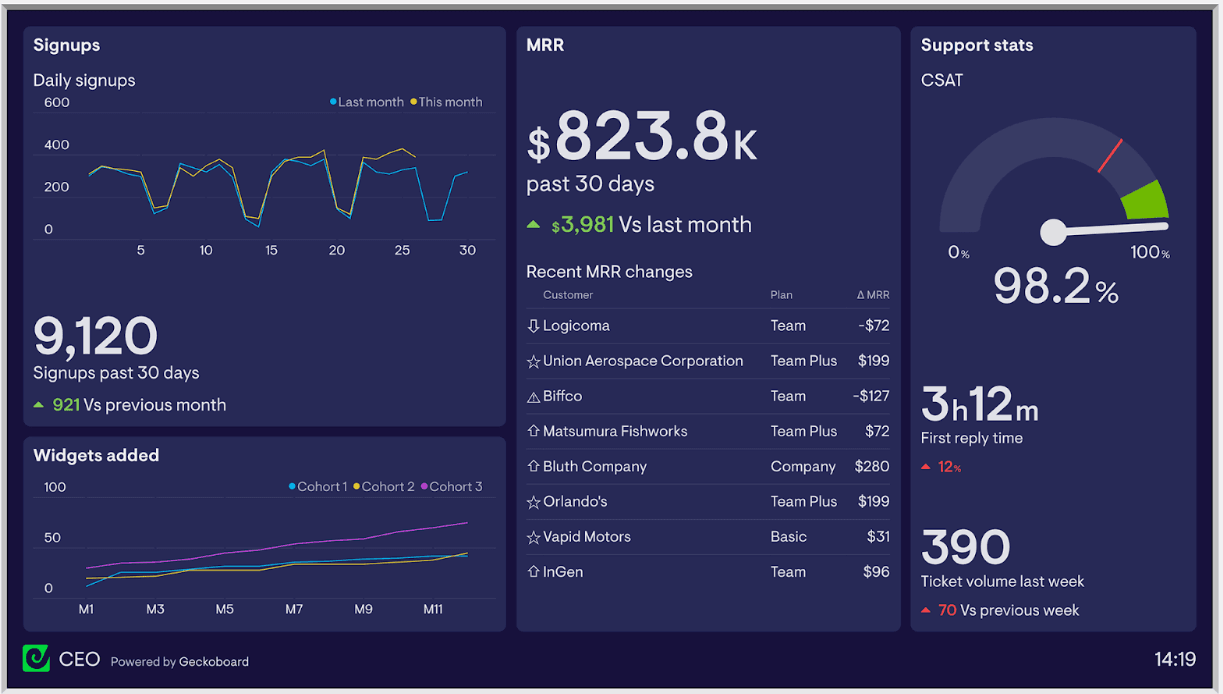
11. Geckoboard
Geckoboard is a tool to create real-time business dashboards, pull data from 80 different tools, and create visually-pleasing reports. It is a tool to present live data, build TV dashboards and get the most important metrics presented to the team members.
Top Features:
- 80+ data sources;
- Sharing via links;
- Customization;
- Datasets API;
- Request custom data sources;
- Widget grouping.
This is what the Geckoboard dashboard looks like:
Pricing
They offer two options - you can pay monthly or annually (and save 20%).
There are three packages:
- Essential - $39/mo (billed annually);
- Pro - $79/mo (billed annually);
- Scale - $559/mo (billed annually).
Geckoboard also provides a free plan for a single spreadsheet-powered dashboard.
Who is it for?
Geckoboard is a tool that creates reports and a dashboard great for meetings, briefing team members, and examining results. It’s best for businesses as they include business metrics and KPIs and have no client-reporting features (such as white-label or automation).
12. DashThis
DashThis is a reporting tool to create and automate visually-appealing marketing dashboards and reports. They offer IT consulting and services. Yet not only that, but they assist marketers and agencies by offering marketing-related integrations and client-reporting features.
Top Features:
- 34 integrations;
- CSV file import system;
- Unlimited data sources;
- Pre-made report templates;
- Sharing via email, with URL or PDF;
- White-label reports.
Pricing
Who is it for?
Considering the features and how DashThis brands itself, it is clear that the tool is best for marketing agencies and small to mid-sized businesses. If you remain uncertain about whether DashThis is a suitable tool for you, feel free to visit our comparison page for a thorough analysis and comparison.
Bottom Line
There are many powerful marketing data reporting tools. Some are more business orientated, and some are more linear to marketing agencies. Consider different features and tool characteristics to find what works best for you.
We want to offer you a tool that is the best for marketing agencies, specifically - Whatagraph.
Sign up for Whatagraph to gain access to a full pre-made template gallery, report automation, and 40 data integrations. Create beautiful reports that your clients will enjoy, and save time by having data pulled from sources automatically. To get started, sign up for a free trial today!
Published on Feb 11 2020
WRITTEN BY
Dominyka VaičiūnaitėDominyka is a copywriter at Whatagraph with a background in product marketing and customer success. Her degree in Mass Communications/Media Studies helps her to use simple words to explain complex ideas. In addition to adding value to our landing pages, you can find her name behind numerous product releases, in-app notifications, and guides in our help center.