Top 10 Website KPIs to Measure Your Client's Website Performance
This article will cover website KPI examples digital marketing agencies should be tracking to monitor clients’ website performance and overall marketing progress. We will go through 10 website performance metrics every marketer should track today.

Aug 03 2022●7 min read


What Are Website KPIs?
KPIs (key performance indicators) in web analytics are specific, pre-defined values that allow you to measure and manage the performance of your website or application. You can achieve this by evaluating campaign effectiveness through different marketing actions or a specific initiative.
Moreover, KPI web analytics help to see how certain initiatives contribute to achieving business objectives. This information then helps when making changes and optimizing strategy or spending.
For example, if you notice that one KPI has increased while another has decreased, it may be time to shift gears or implement a new marketing strategy. KPIs depict the overall state of your marketing and assist you in identifying potential issues to address them before they become more serious.
Lastly, KPIs are important because marketing agencies can identify benchmarks and set data-driven goals when measuring website performance over time.
So, what do most companies measure to determine the success of their websites? Continue reading!
Top 10 Website KPIs to Track
1. Unique Website Visitors
What it is - A unique website visitor is when a visitor lands on your client’s website and engages with one or multiple pages in a specific period.
For example, if a person lands on a page but then engages with three other pages (pricing, features and/or blog page), he is counted as a single unique visitor.
How it is calculated - Take the number of total unique visitors who landed on your client’s website, divided by the number of all unique users counted during a specific period.
You also have two options:
- You can use the Google Analytics tool to get this data.
Create an account → go to Acquisition → Audience report. You can press the ‘+’ sign to add other user segments if needed.
- You can skip all these steps and get unique website visitors displayed with one click in Whatagraph.
Get a website analytics reporting tool like Whatagraph, and get access to all your website KPIs in a clean, modern dashboard or report.
Why it matters - Marketing agencies should track unique visitors because it gives insights into how well their content and overall website perform. This means finding out:
- How popular the client’s website is;
- Where are the issues hindering the website’s performance;
- What the size of the audience is;
- What habits your users have and how they engage with the website;
- How your website ranks in search results and determining what affects your performance the most.
To increase unique visitors numbers, consider these ideas:
- Producing more content targeting highly relevant keywords
- Analyzing your website’s loading speed and finding out ways to reduce it
- Running paid traffic ads;
- Using influencer marketing;
- Improving your on-page technical SEO elements
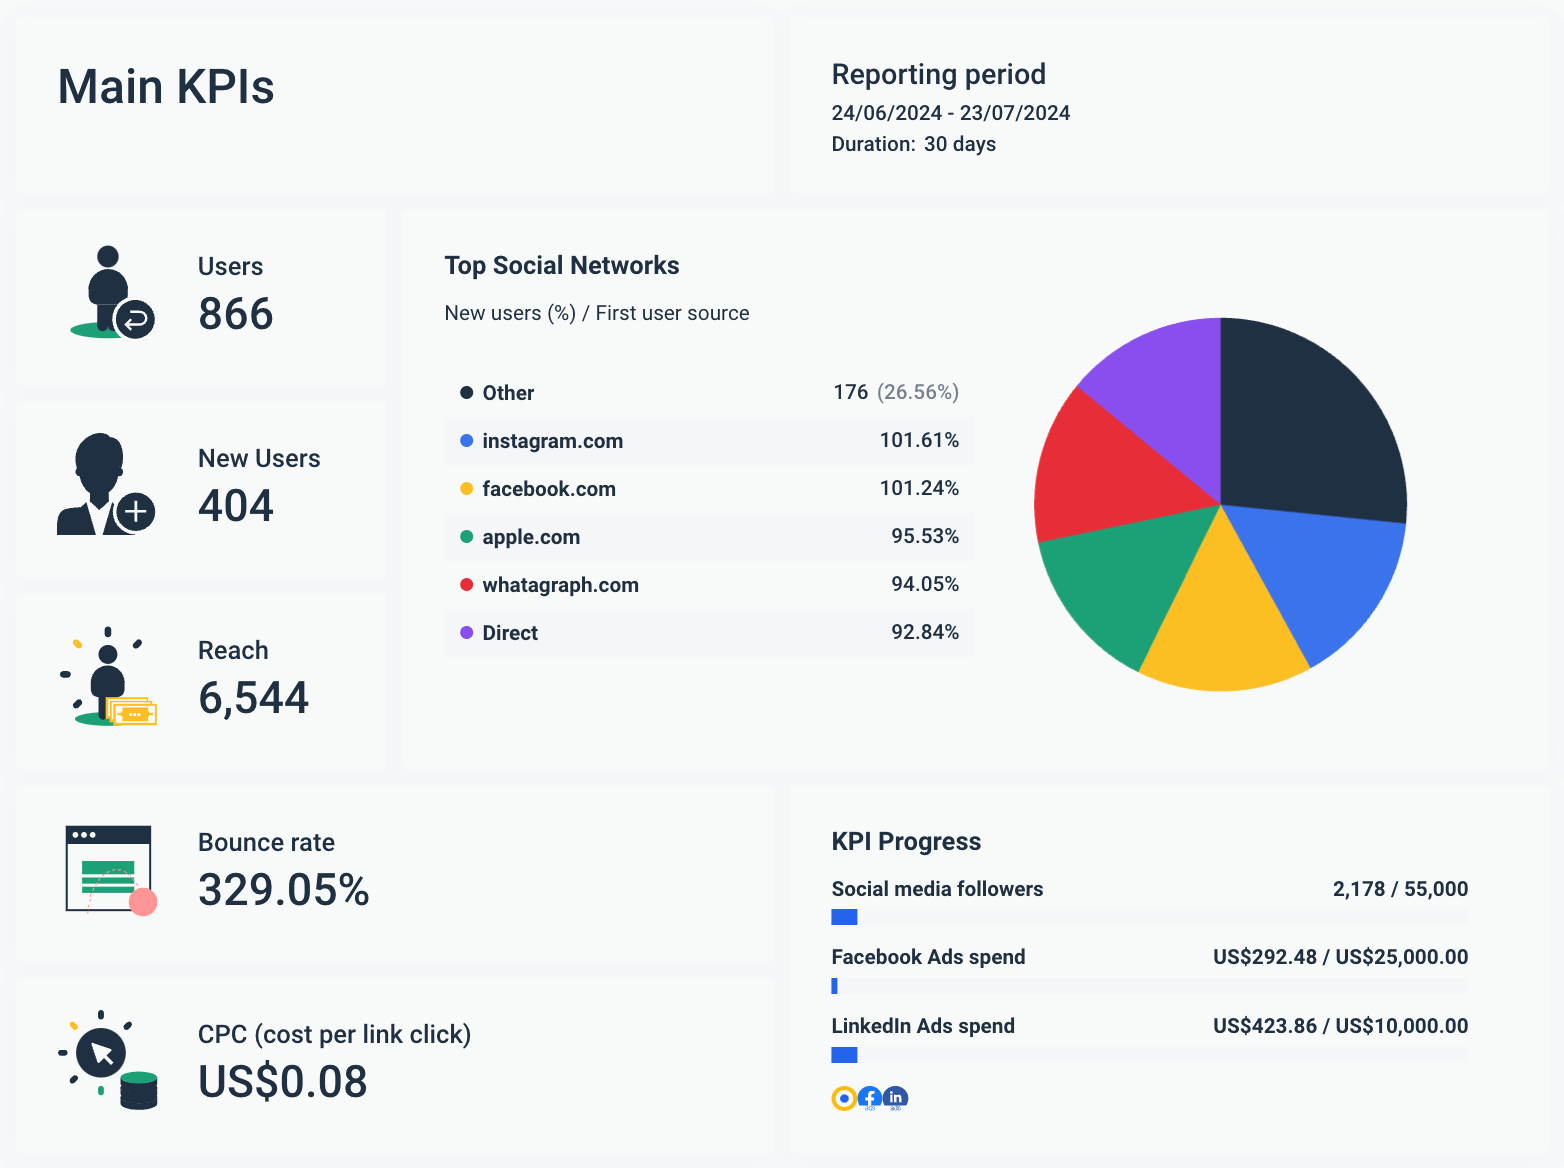
2. Traffic by Source
What it is - Traffic by the source is a KPI that identifies the source of visitors to your client's website.
Traffic could be segmented into different types of sources:
- Devices - mobile, desktop, app;
- Campaign;
- Platform;
- Channel.
How it is calculated - Traffic by source is best displayed with a reporting tool, as it is nearly impossible to calculate it manually.
Here is a website dashboard that you can use to display your traffic segmented by different sources easily.
Why it matters - Marketing agencies need to track traffic by the source to:
- Determine which sources are driving the most traffic and which ones - the least. This includes social media, email marketing campaigns, webinars, and more.
- Better understand the client’s target audience and where they are located;
- Create data-driven campaigns and provide targeted messages for better marketing campaigns;
- Better allocate the budget and distribute it to the channels that need a paid push.
3. Sessions
What it is - A session is when a user interacts with your client's website.
For example, if a single user visits your client's website 5 times from the same device or campaign but on different days, it will be counted as one user but five sessions.
In other words, the session begins when a user visits your client’s site and ends when the user exits.
However, if a user arrives at your client's website, opens a new window, and writes or pastes the URL of one of your pages, then opens it, the session will be counted as a single session because arriving via a direct link does not count as a new session.
How it is calculated - Take the total number of sessions in a specific time and divide it by the number of users in that same time.
Why it matters - Marketing agencies benefit from tracking website sessions because:
- The KPI allows them to see what’s working in their PPC, SEO and marketing efforts and experiments;
- It allows to identify and analyze user behavior and habits;
- It allows them to document the user journey;
- It identifies why people leave the client’s website (this could be due to various reasons such as bugs or errors).
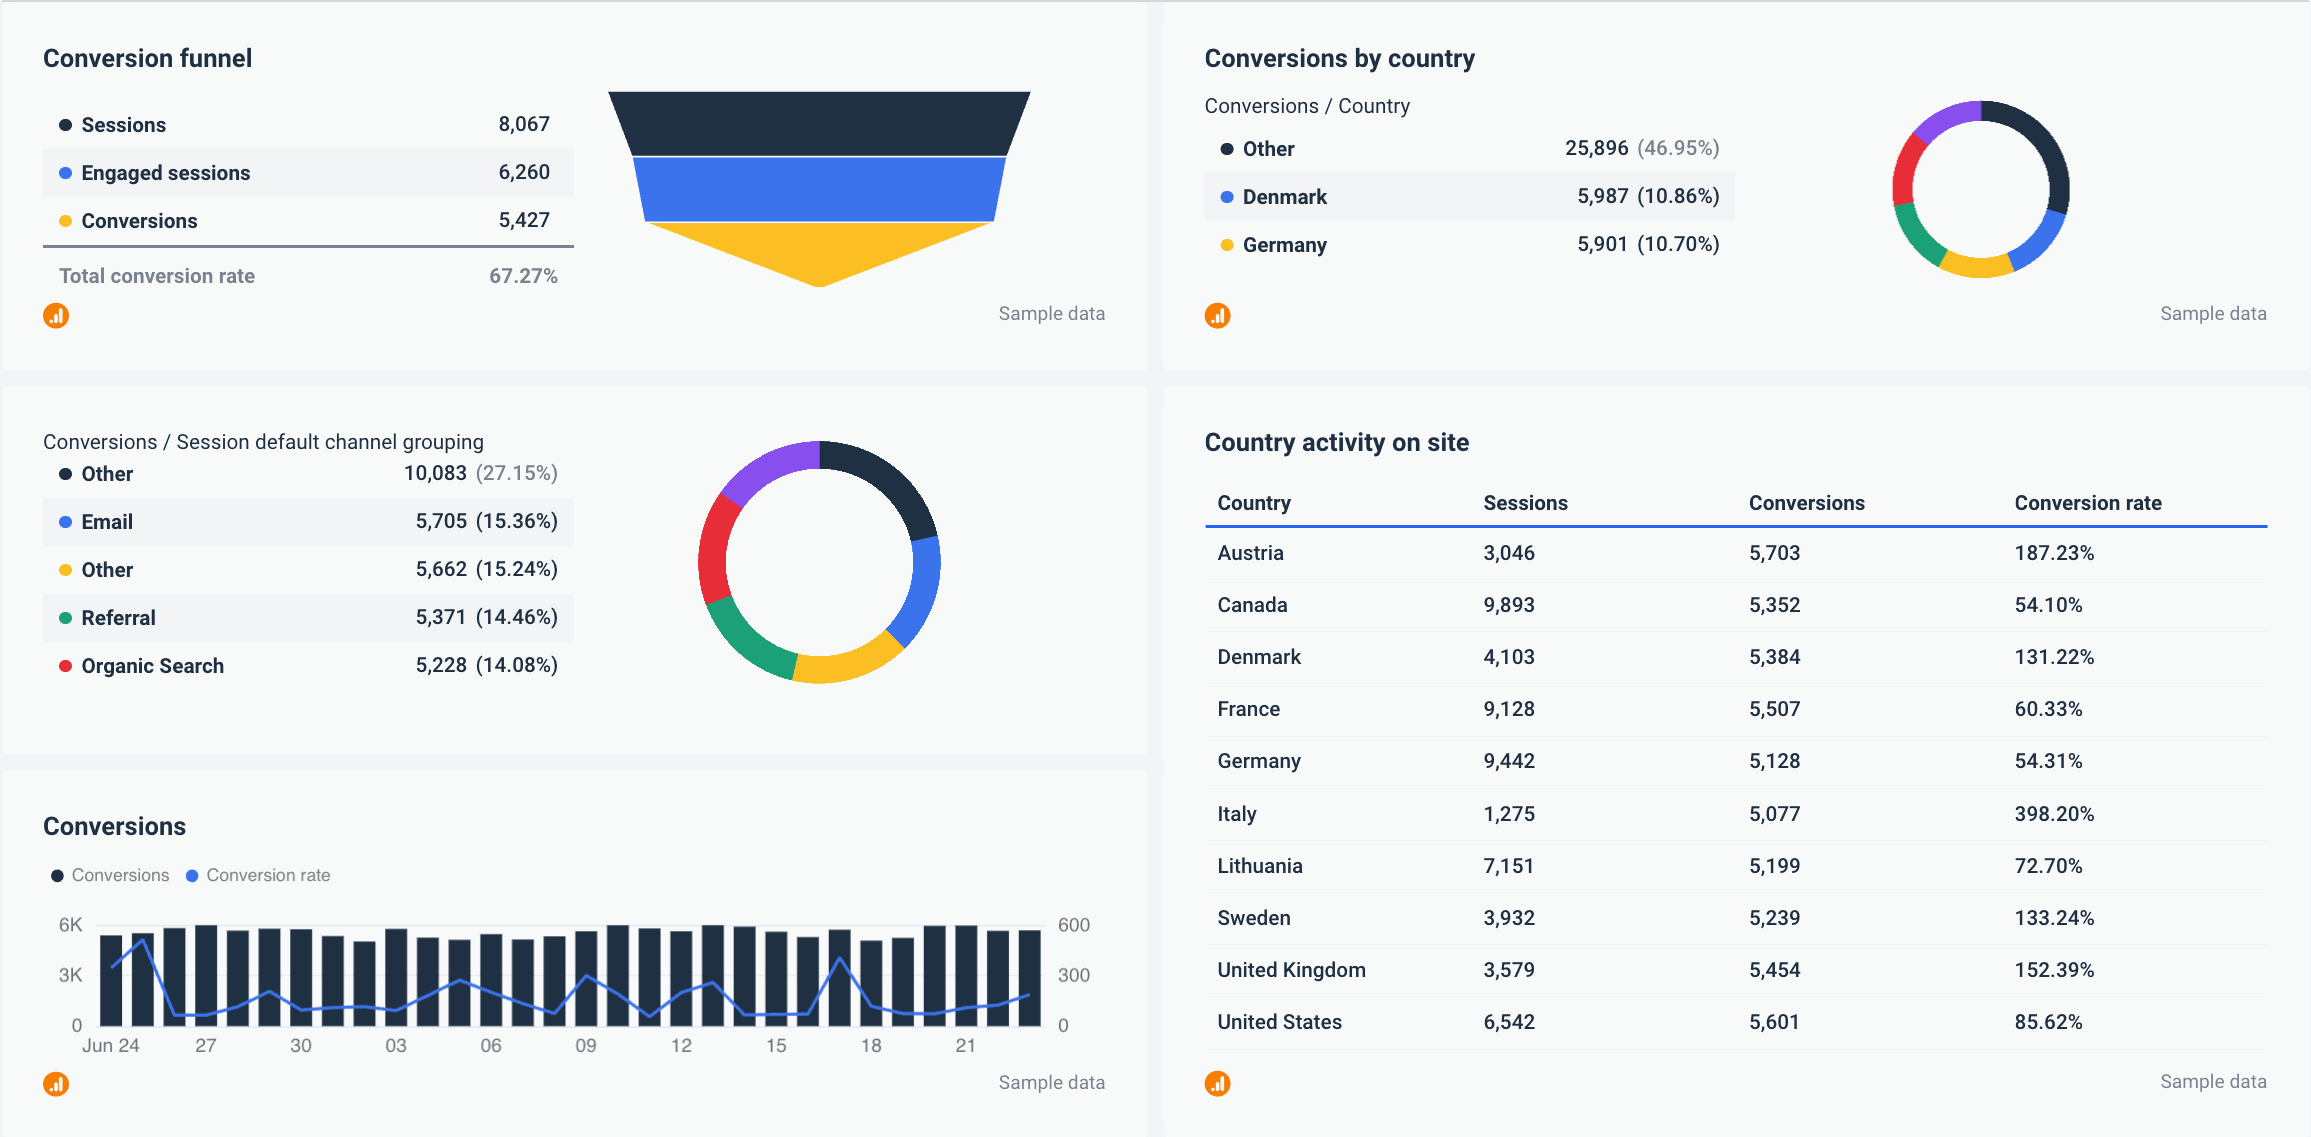
4. Conversion Rate
What it is - The conversion rate indicates whether or not a user completed the action you or your client desired on a website. It is typically measured in percentages, with the higher the percentage indicating a successful campaign.
How it is calculated - Take the number of goals achieved in a specific time, divide it by the total number of users to your client’s website and multiply it by 100%.
Why it matters - Marketing agencies track conversion rates because:
- It shows how well they are driving the right actions on their clients’ websites;
- It lets them accurately predict the new flow of sales and revenue;
- It gives insights into your clients’ campaign messaging.
Britani Losoya, marketing assistant at Dallas SEO Dogs, says that to her marketing team, tracking their conversion rate is beneficial because:
‘This data is relevant to user experience (quality of your pages, content, calls to action, site speed, ease of navigation, etc.). It may also provide insight into the quality of your inbound traffic from various sources’.
Try our Google Analytics 4 report to avoid becoming overwhelmed by all of this complex data. All of the reports in Whatagraph can be customized and adjusted. So, if you see any irrelevant KPIs, simply delete them with a single click.
5. Average Time on Page
What it is - Average time on page is a KPI that shows the average time that visitors spend on a single page.
How it is calculated - Divide the total time spent on a single page by the total number of pageviews, minus the number of exits.
Why it matters - Average time on a page can tell a lot to marketing agencies:
- A high average time can tell that the content provided on the website is engaging and relevant to visitors;
- On the other hand, if the average time on checkout pages is high, it can indicate that there are some errors that need to be fixed;
- Because time on a page affects SEO performance, marketing agencies might consider improving the website content to get a higher average time spent.
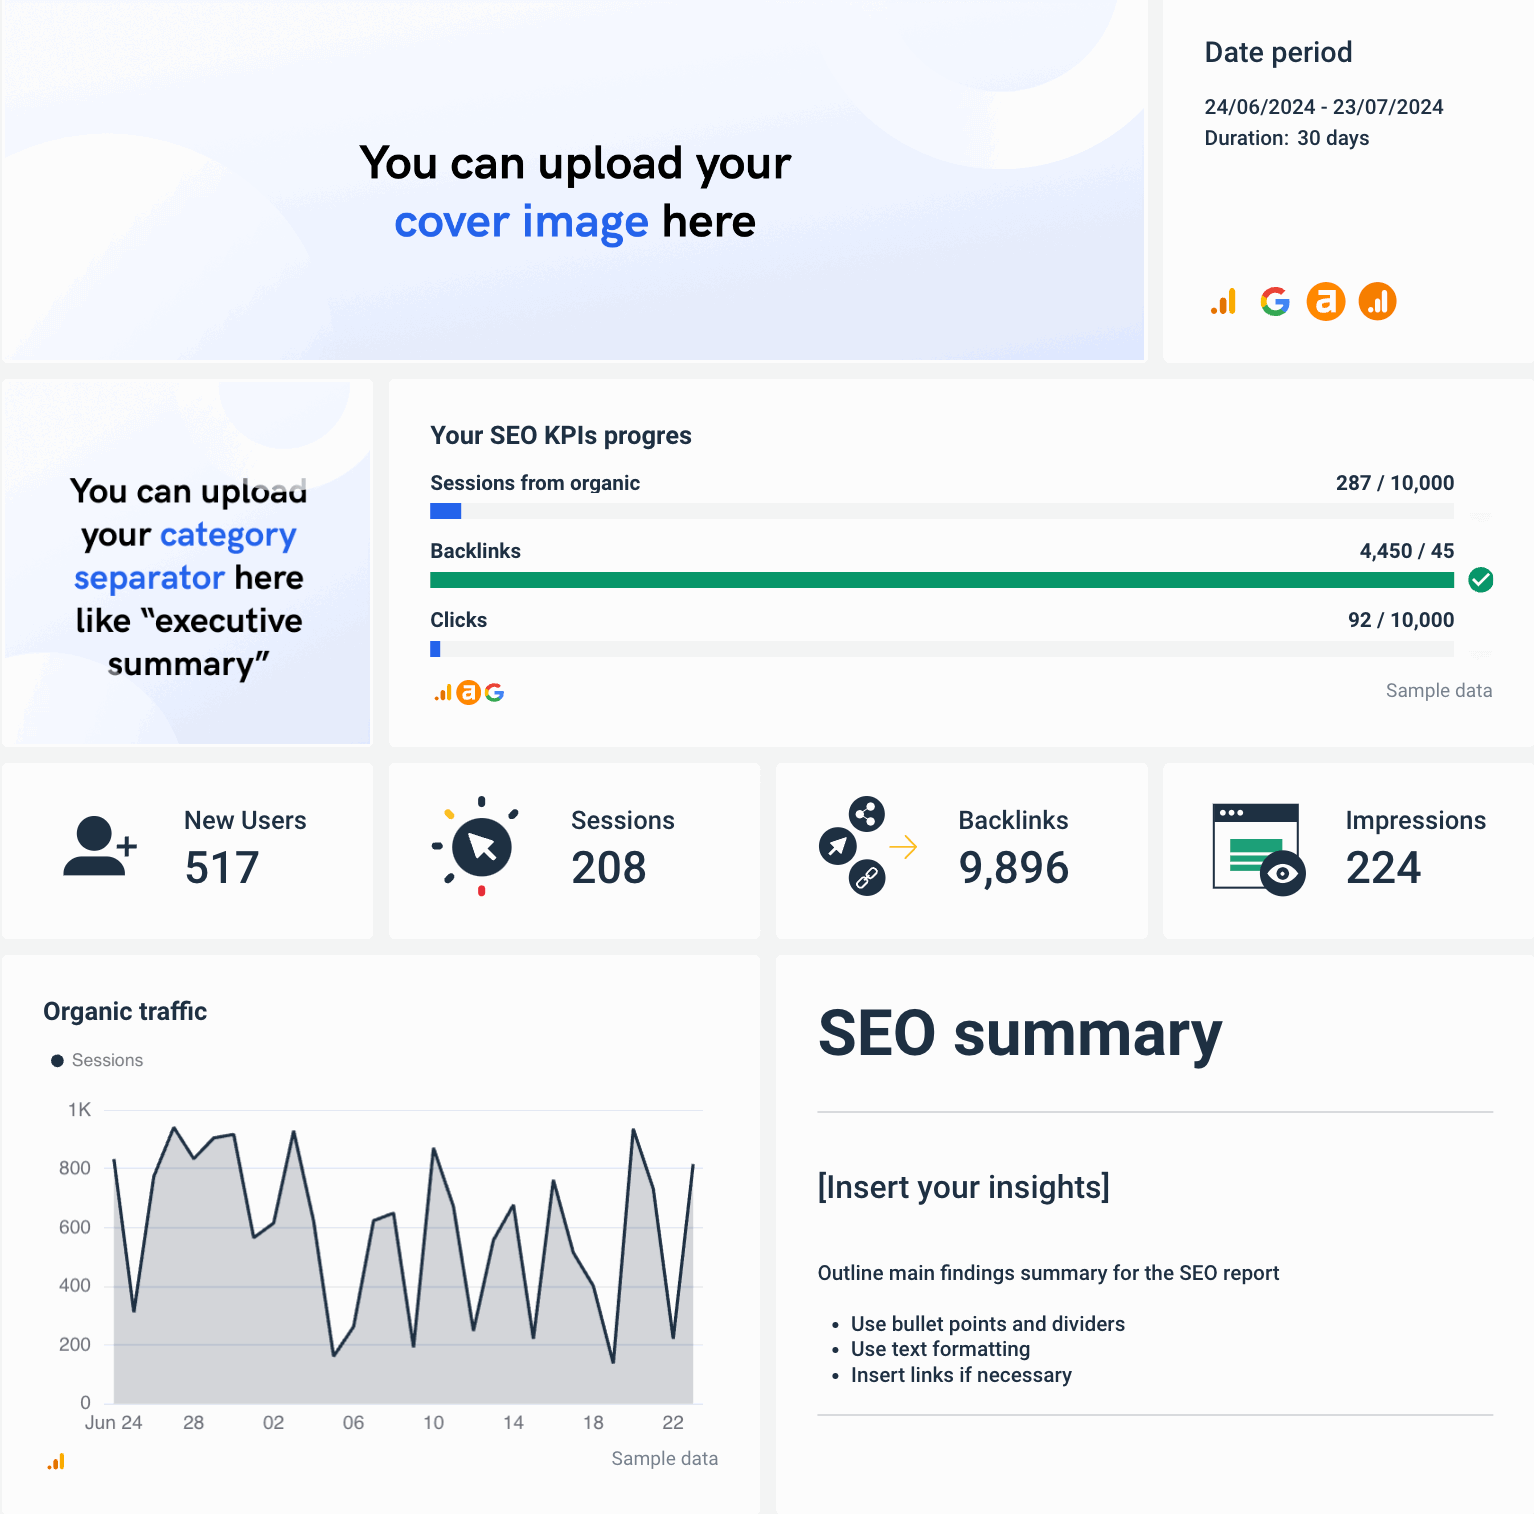
Here is the best SEO reporting tool for all your SEO agency reporting needs.
6. Bounce Rate
What it is - The percentage of visitors who leave a website without taking any action is called a bounce rate.
How it is calculated - Take a total number of bounces, divide by the total visitors to the website/landing page and multiply by 100%.
Why it matters - Tracking bounce rates can help you learn how users interact with specific pages on your client's website. This allows you to base optimization and marketing decisions on how visitors interact with the page. Bounce rate is one of the most important marketing key performance indicators because it can show you if your funnel has serious flaws that need to be addressed.
7. Goal Completions
What it is - The goal completion KPI counts the number of client users who fulfill a specified objective or series of goals on your client's website.
Goals and conversion events serve the same purpose: they both track when users perform actions that are crucial to your client's company.
The difference between the goal completion and conversion rate:
Conversion rate - The desired actions completed by site visitors.
Goal completions - The total number of visitors who have completed all elements defined for this particular goal.
The distinction between the two is that the second definition is clearly for the accomplishment of a single goal. The other is for all of the objectives combined.
How it is calculated - Take the number of visitors who have fulfilled all components of a goal and divide it by the total number of visitors.
Why it matters:
- A lofty goal completion rate demonstrates that your campaign motivates your target audience to take action.
- A high lead-to-win rate indicates that your campaign produces high-quality leads for your sales team.
- You can measure the success of your sales funnel.
- It provides insight into the quality of your marketing materials.
Using software or an online service that tracks your website analytics for you is the simplest way to calculate your goal completion rate. A tool such as Whatagraph can consolidate your metrics and track your progress.
Grab a complete Google Analytics 4 dashboard template created specifically for agencies and learn about the goal completions.
8. Top Landing Pages
What it is - Top landing pages are the first pages that visitors see when they visit your website. This could be your client's site's home page, an optimized blog article, a pricing page, or another page.
How it is calculated - It is advised to use the Google Analytics reporting tool to get this information as you can’t measure it manually.
Why it matters:
- Provides an ability to review top landing pages;
- Allows to examine the way visitors move through a conversion funnel;
- It can be used to increase sales and overall ROI by optimizing top landing pages.
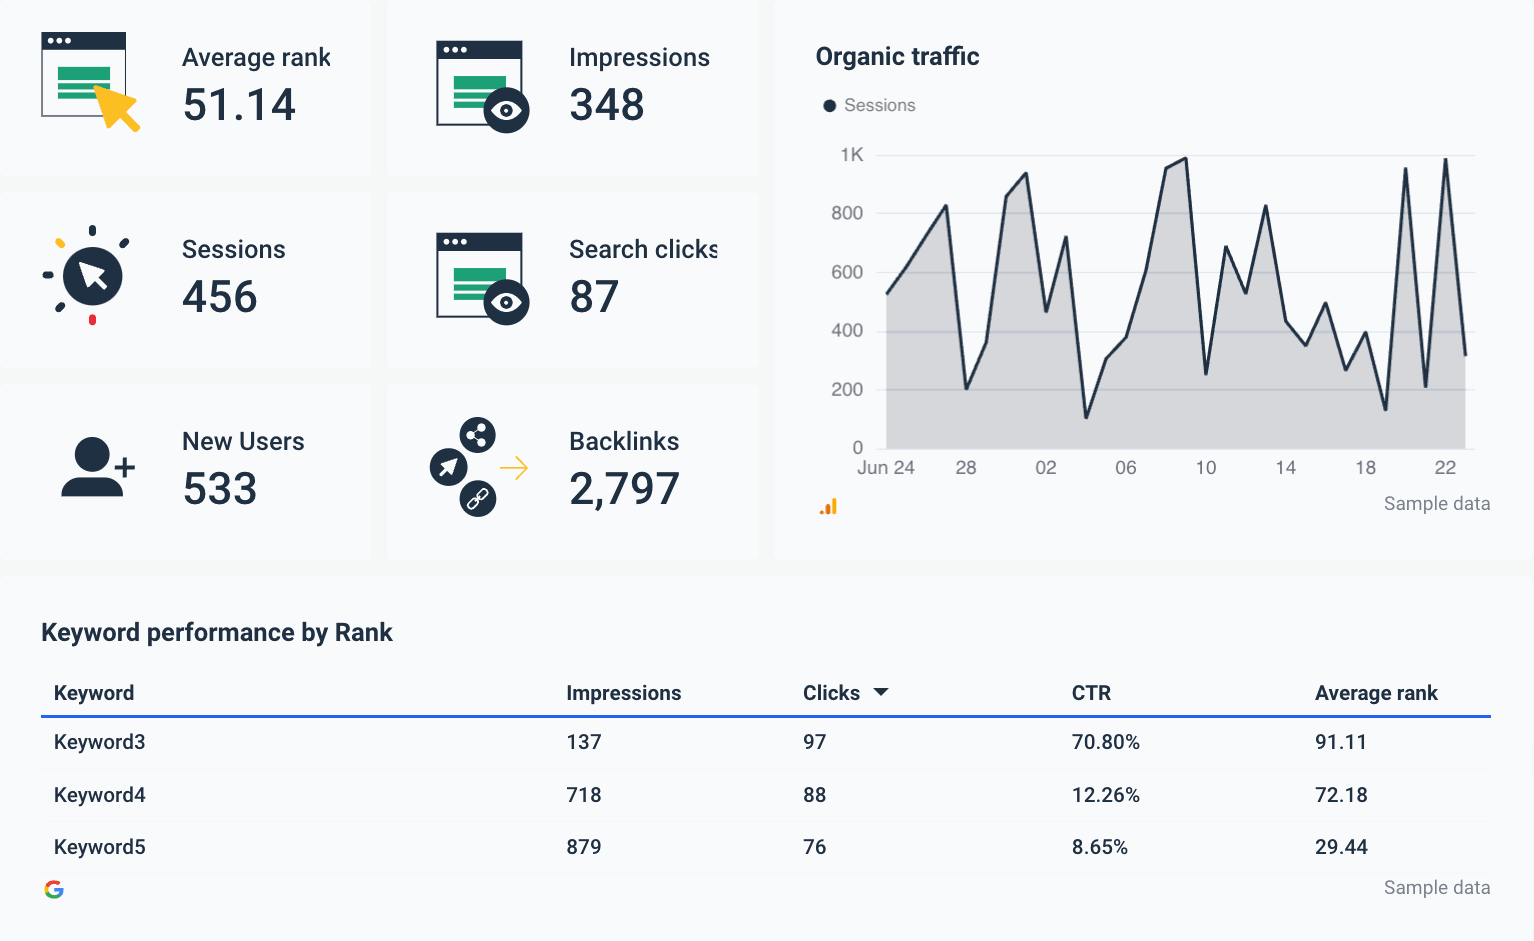
9. Organic Traffic
What it is - Organic traffic is generated when a user clicks on a link to your website or lands on any of your landing pages from an unpaid source.
How it is calculated - If you're using Google Analytics, navigate to Acquisition → All Traffic → Source/Medium → Organic Traffic.
You could also have the option to skip all of these steps. Create a Whatagraph account to get all this data with a single click.
Why it matters - Organic traffic monitoring will show you how well you target specific audiences and use keywords. The more traffic you have, the better you will be able to answer their questions and solve their problems. The more organic traffic your website receives, the more benefits it will receive, such as more conversions, increased brand awareness, and new customers.
This one is difficult to acquire, but by tracking this, we can determine if our website has any weaknesses in terms of digital strategy. It can also help us identify our site's bounce rate. If we have a lower bounce rate, search engine algorithms can determine that our site is credible.
10. Page Load Time
What it is - Page load time is the average amount of time it takes for a page to appear on your client’s screen. To measure page load time, you should be testing website speed using available tools.
How it is calculated - Page load time KPI is best displayed with a reporting tool, as it is nearly impossible to calculate manually.
Create a Google Analytics account → navigate to your view → reports → behavior → site speed.
Why it matters:
- Provides useful insights for specific web pages;
- Assists marketing agencies in determining which web pages take too long to load;
- Helps to identify if the website needs to be optimized for a specific browser;
- A slow loading page impacts user experience, bounce rate and revenue.
Bottom Line
Website KPIs are the key to developing and improving client sites and increasing traffic. However, deciding which KPIs to use may be challenging due to the many KPIs you can choose from.
This list provided only the most important KPIs your marketing agency should consider.
If you want to track your Website KPIs (for yourself or your clients) in an easy and modern way, you'll need a dependable website reporting tool. Try Whatagraph for free today!
Published on Aug 03 2022
WRITTEN BY
Dominyka VaičiūnaitėDominyka is a copywriter at Whatagraph with a background in product marketing and customer success. Her degree in Mass Communications/Media Studies helps her to use simple words to explain complex ideas. In addition to adding value to our landing pages, you can find her name behind numerous product releases, in-app notifications, and guides in our help center.