What Is KPI Tracking? How to Optimize It to Get More Insights From Your Data
KPI tracking is the secret tool behind the success of millions of data-driven leaders and organizations. If you’d like to know what methods and tools are best for measuring your key performance indicators, you’ve come to the right place.

Jul 31 2023●7 min read


You can track KPIs in many ways — using Google or Excel sheets, Google Analytics, or by building a cross-channel KPI dashboard using a dedicated data platform.
Let’s start by explaining KPI tracking and why it is essential for agencies and businesses.
What is KPI tracking?
KPI tracking is the process of monitoring the changes in KPI trends over a time period to understand how your or your client’s business is performing.
It includes capturing data and converting it into useful metrics to measure the progress against specific goals and objectives over time.
By using visual innovations like KPI reports and KPI dashboards, managers can uncover more significant insights than ever possible, giving your organization an edge over the competition. These reports often include different graphs and charts, which make it easier to understand how your improvements affect the KPIs.
Yet, there’s no specific rule for what KPIs you should track and for how long. These decisions depend on your company’s objectives and goals.
For example, KPIs that reflect your company’s long-term growth, such as annual revenue, net profit, or employee tenure, should be tracked yearly. This way, they can compare the current with historical data and predict future trends more quickly.
On the other hand, some KPIs like conversion rate, customer retention rate, or churn provide better insights when compared every month, so you can adjust your strategies in real-time without impacting the long-term goals.
But in what ways can KPI tracking make your decision-making more efficient?
6 benefits of tracking the right KPIs?
Now that we explored the practical definition of KPI tracking let’s dive into performance-boosting benefits.
When you use KPI tracking dashboard software and choose metrics relevant to your business goals, you make more informed decisions, translating into better customer satisfaction and a higher profit margin.
So what are the benefits of tracking the important KPIs?
- Business intelligence: Making data-driven decisions all the time is the key element of winning on today’s digital battlefield. Measuring the important metrics empowers you to develop your business strategy to save time and money while launching innovations that make your company stand out.
- Innovation: Choosing the right KPI tracking software allows you to identify trends and patterns that would otherwise remain hidden. When you achieve this, you can unlock creative thinking that fosters innovation throughout the business. And when a company can innovate, it becomes a thought leader in the field, boosting brand awareness and building trust.
- Communication: KPI reports and dashboards are usually very visual and engaging, which makes them easy to review and understand. This significantly improves the communication between departments, which can use the reports as a single source of truth.
- Benchmarking: Another powerful benefit of KPI tracking is the ability to benchmark. Tracking KPIs allows you to set goals and benchmarks based on real-time data. When you can set intelligent goals for your organization, you can evolve, scale, refine your core processes, and become more flexible to change.
- Consistency: With the right indicators to guide you to your strategic goals, you can keep moving forward at a steady pace. Accurate benchmarks pave the way to continual improvement, and when supported by a capable KPI monitoring software, your pace can even speed up.
- Motivation: By presenting your team members and stakeholders with a KPI dashboard to set attainable goals, you can motivate them to streamline their processes, increasing their productivity and motivation.
How to track KPIs?
We’ve just outlined the essential benefits of KPI tracking, so let’s see how to do it. Here are our tips and tricks for best KPI tracking practices.
1. Set your business goals
The first thing to do is to define the goals for your business. Because, what works for another company, needn’t necessarily work for you. You need realistic business objectives to help you monitor whether your company is growing according to plan.
And once you have the high-level goals in place, you should define specific goals for each team. This way, you’ll be able to choose the right KPIs to measure the progress of each department.
2. Identify your audience
With your business goals in place, you’re closer to comprehensive KPI monitoring, and the next thing to consider is — Who will be looking into your KPI dashboard? To answer this, you can ask yourself:
- What data is important for these people?
- How often do they need to check it?
- Are the KPIs you chose providing enough context?
3. Get SMARTER
With clear business goals and audience in check, you must choose the KPIs you want to track to achieve those goals. The business intelligence industry recommends following the SMARTER practice when setting KPIs for your goals:
- Specific – e.g. Increase organic traffic.
- Measurable – e.g. Increase unique site visits by 25%
- Attainable – e.g. Is a 25% increase realistic?
- Relevant –e.g. Organic traffic is a relevant key driver of new opportunities.
- Timely – e.g. We will measure the process over three months.
- Evaluate – e.g. Is organic traffic increasing as we go through the process?
- Readjust – e.g. Is the number of blogs achievable for the content team?
Setting SMARTER goals means clarifying your thoughts and ideas, focusing your efforts, using your resources and time productively, and raising your chances of achieving your goals.
4. Combine real-time and historical data
The right mix of real-time and historical data will help you get a whole picture from your KPIs. You can spot trends and compare performance over time through historical insights to see if it’s improving. On the other hand, real-time insights will give you insight into your current situation, helping you spot any issues before they become problems.
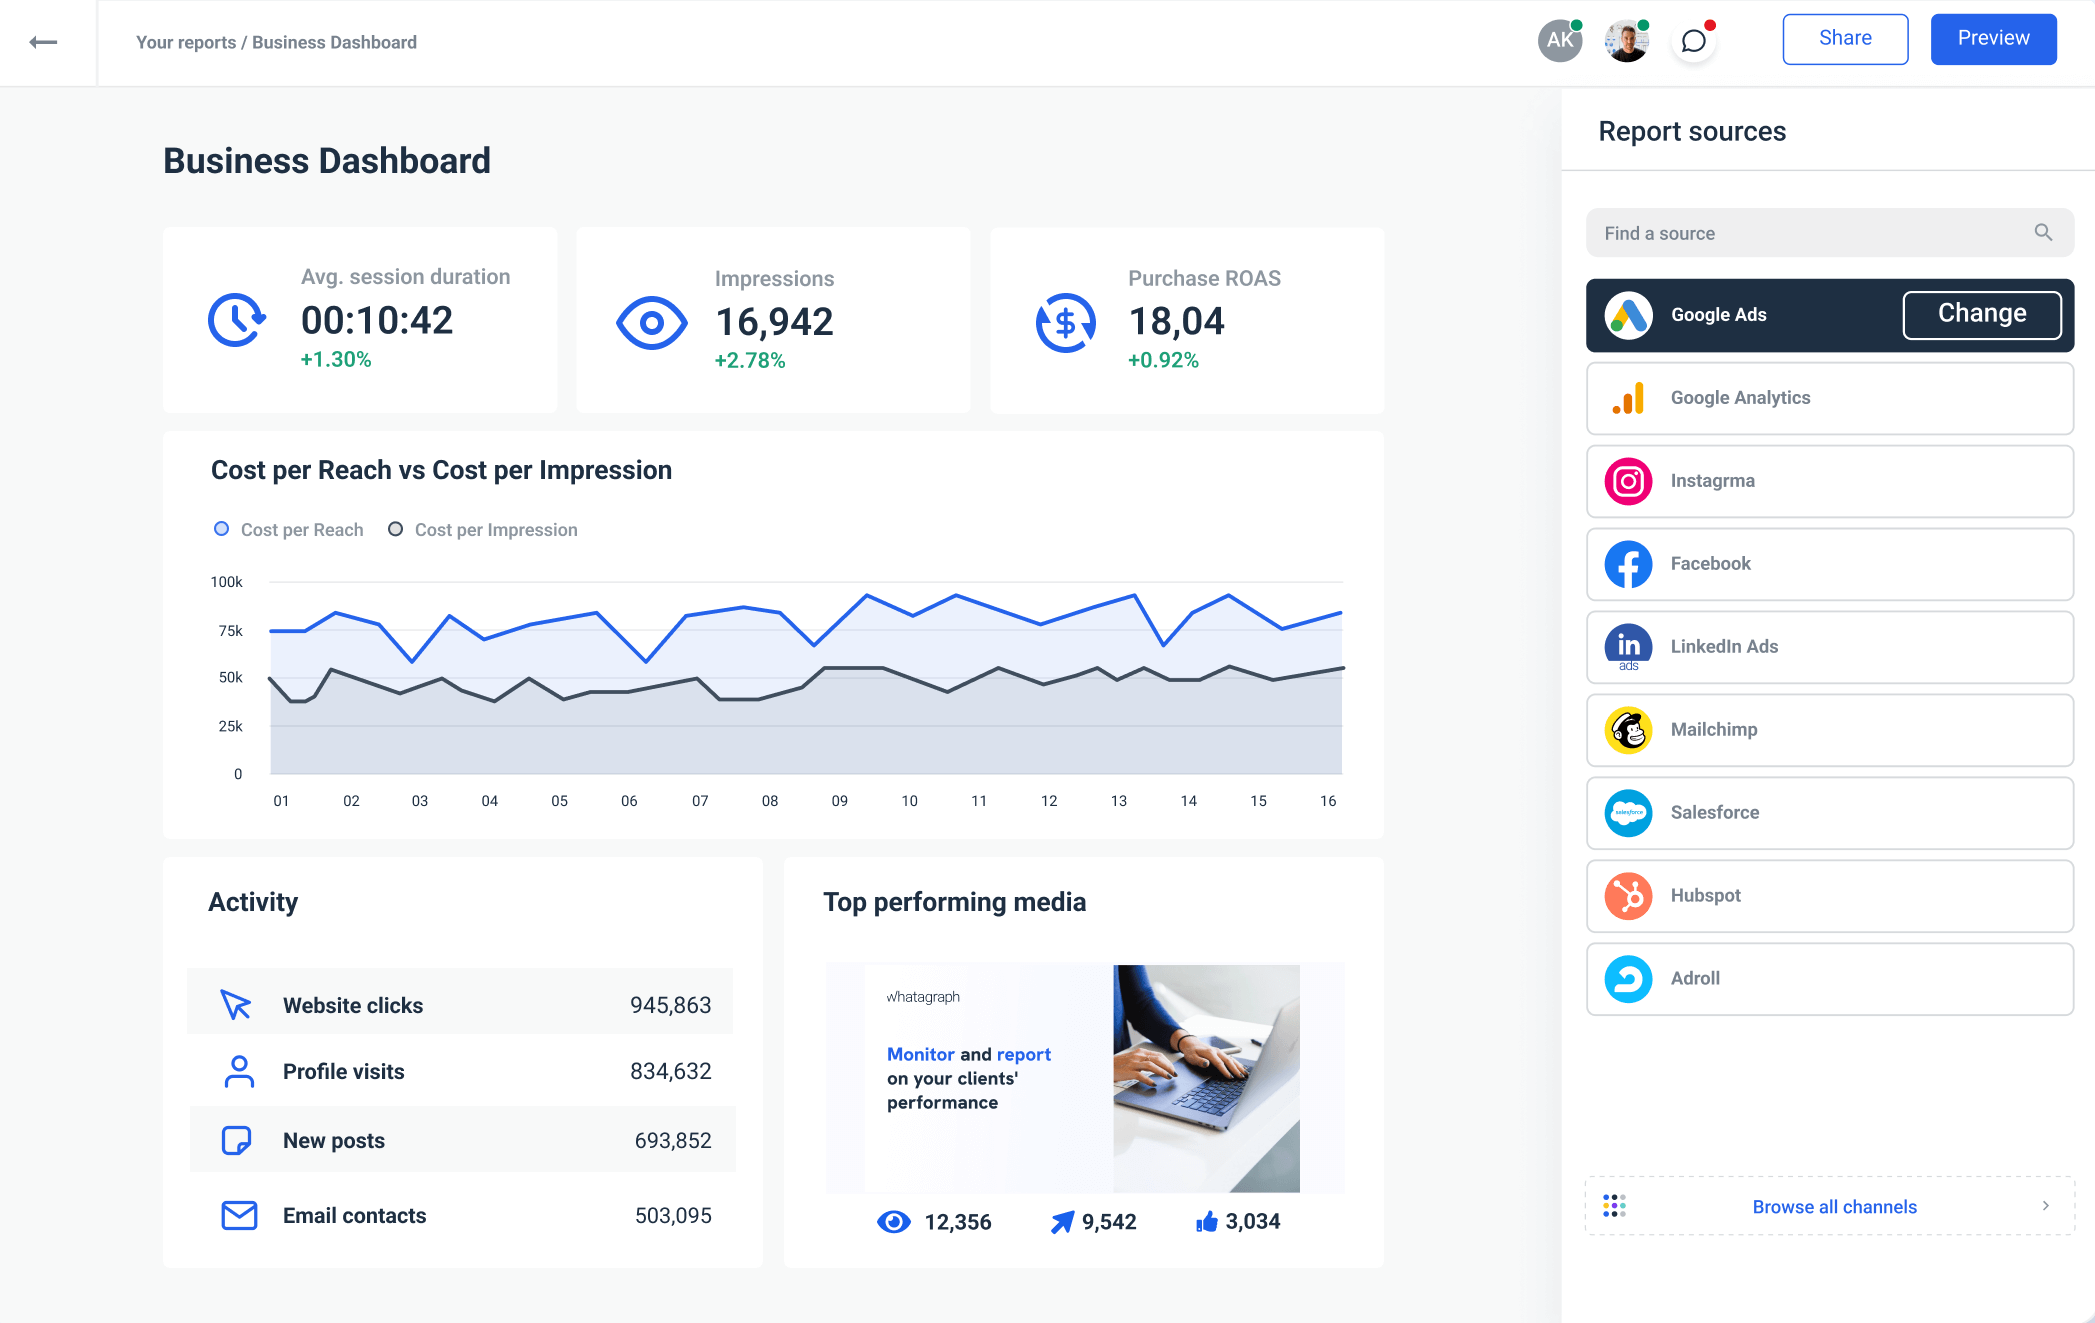
As an all-in-one platform to connect, visualize and share marketing data, Whatagraph can quickly become your tool of choice for combining KPIs from all your data sources.
Whatagraph has a user-friendly cross-channel marketing data visualization, which means you can connect data from multiple platforms into one KPI dashboard for consolidated insights. What is more, Whatagraph offers easy transfers to a data warehouse, which secures historical insights from your data, even if the platform you used to collect it gets discontinued or changes its policy. Yes, Universal Analytics, it’s you I’m talking about.
5. Use the right visualizations
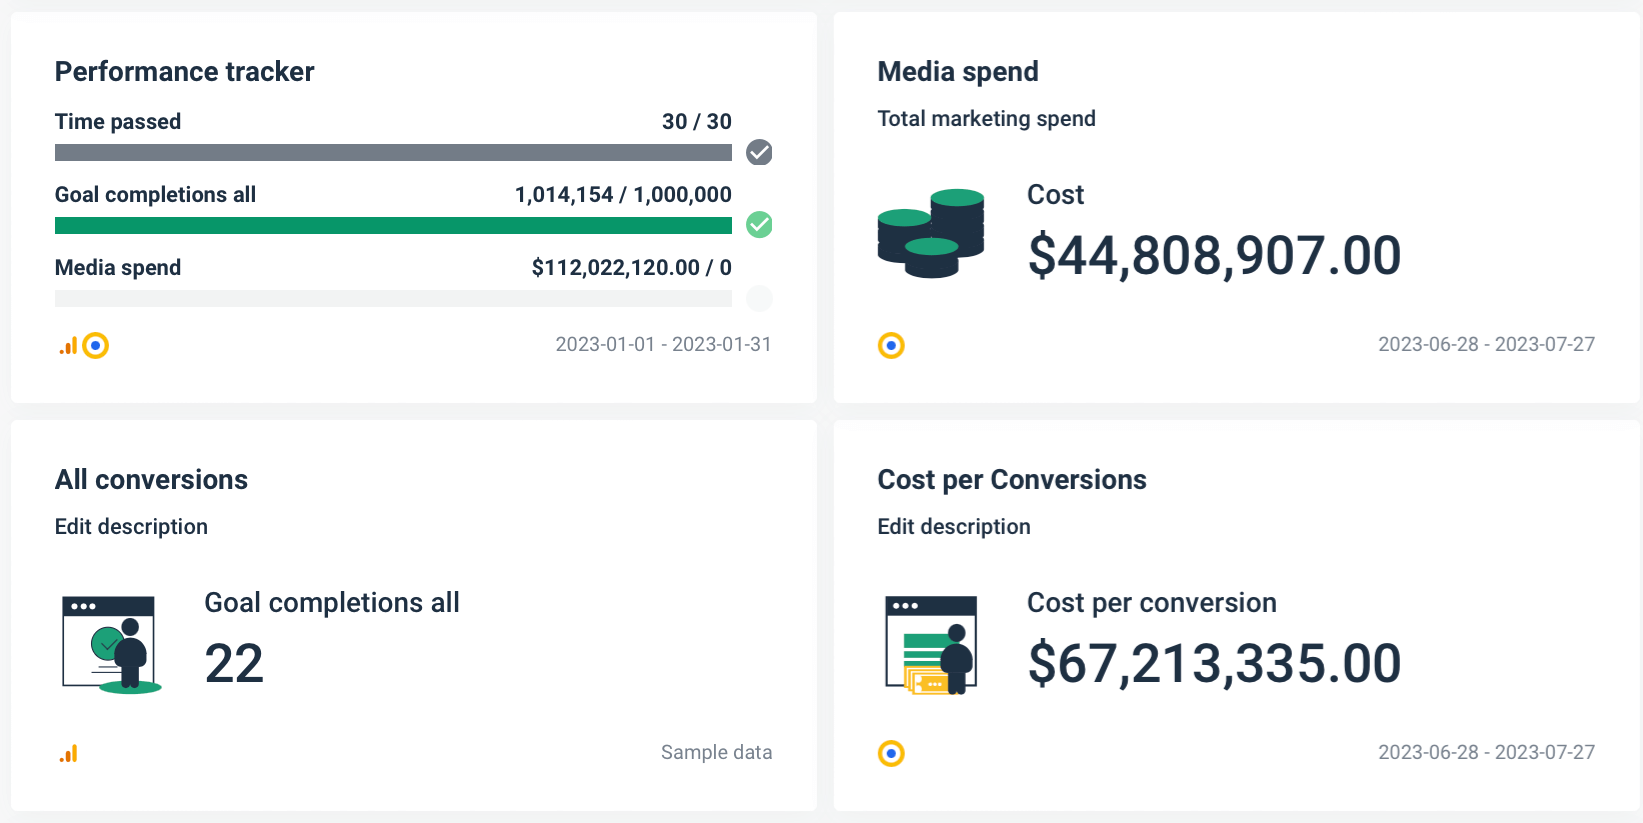
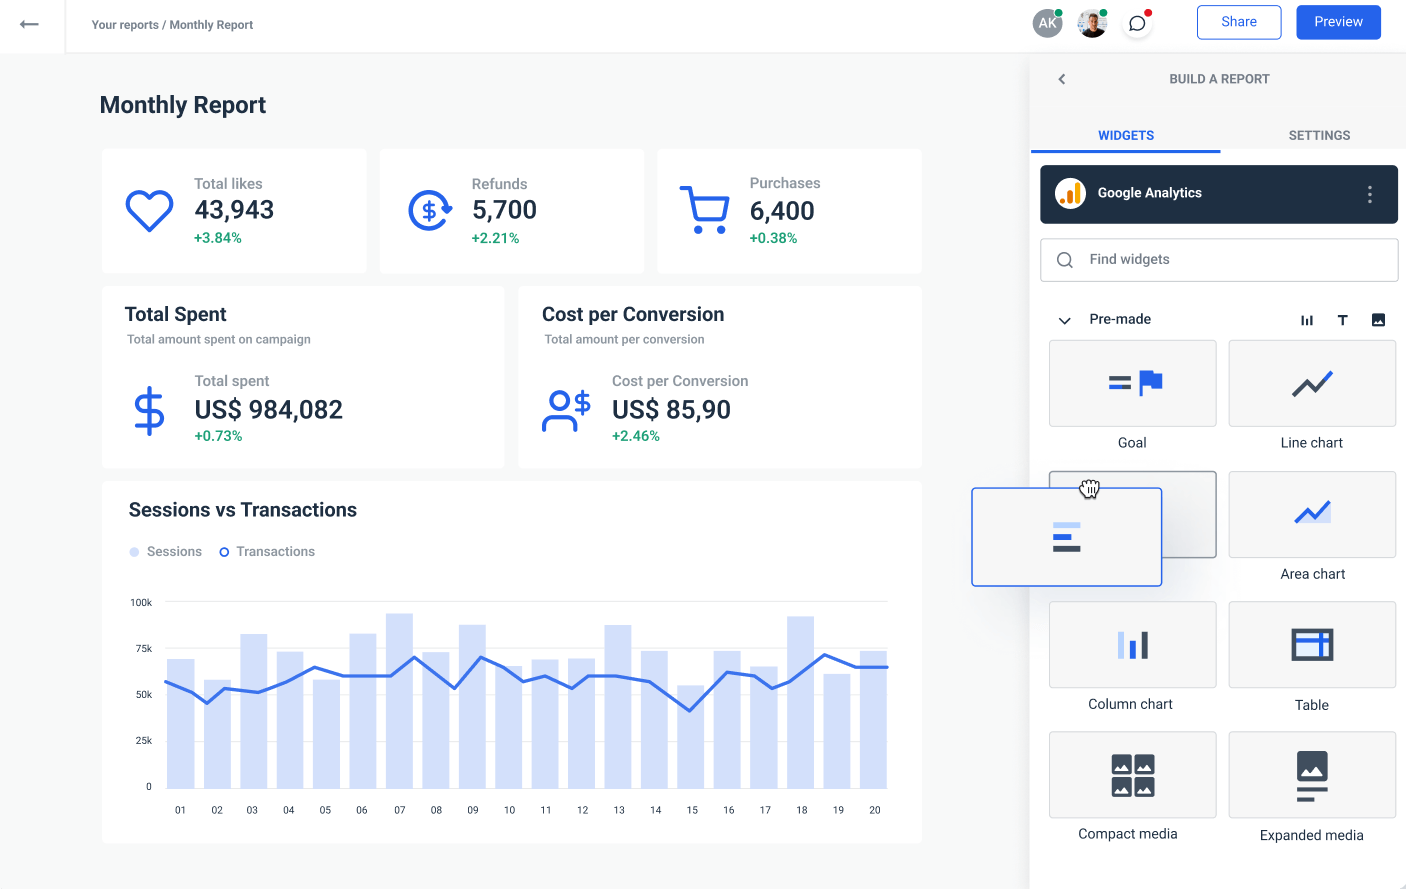
Now, you need to select the correct type of visualization. There are different types of performance tracking reports and dashboards to visualize your data, so you should pick one that makes the analysis process more interactive and easy to perform by non-technical users.
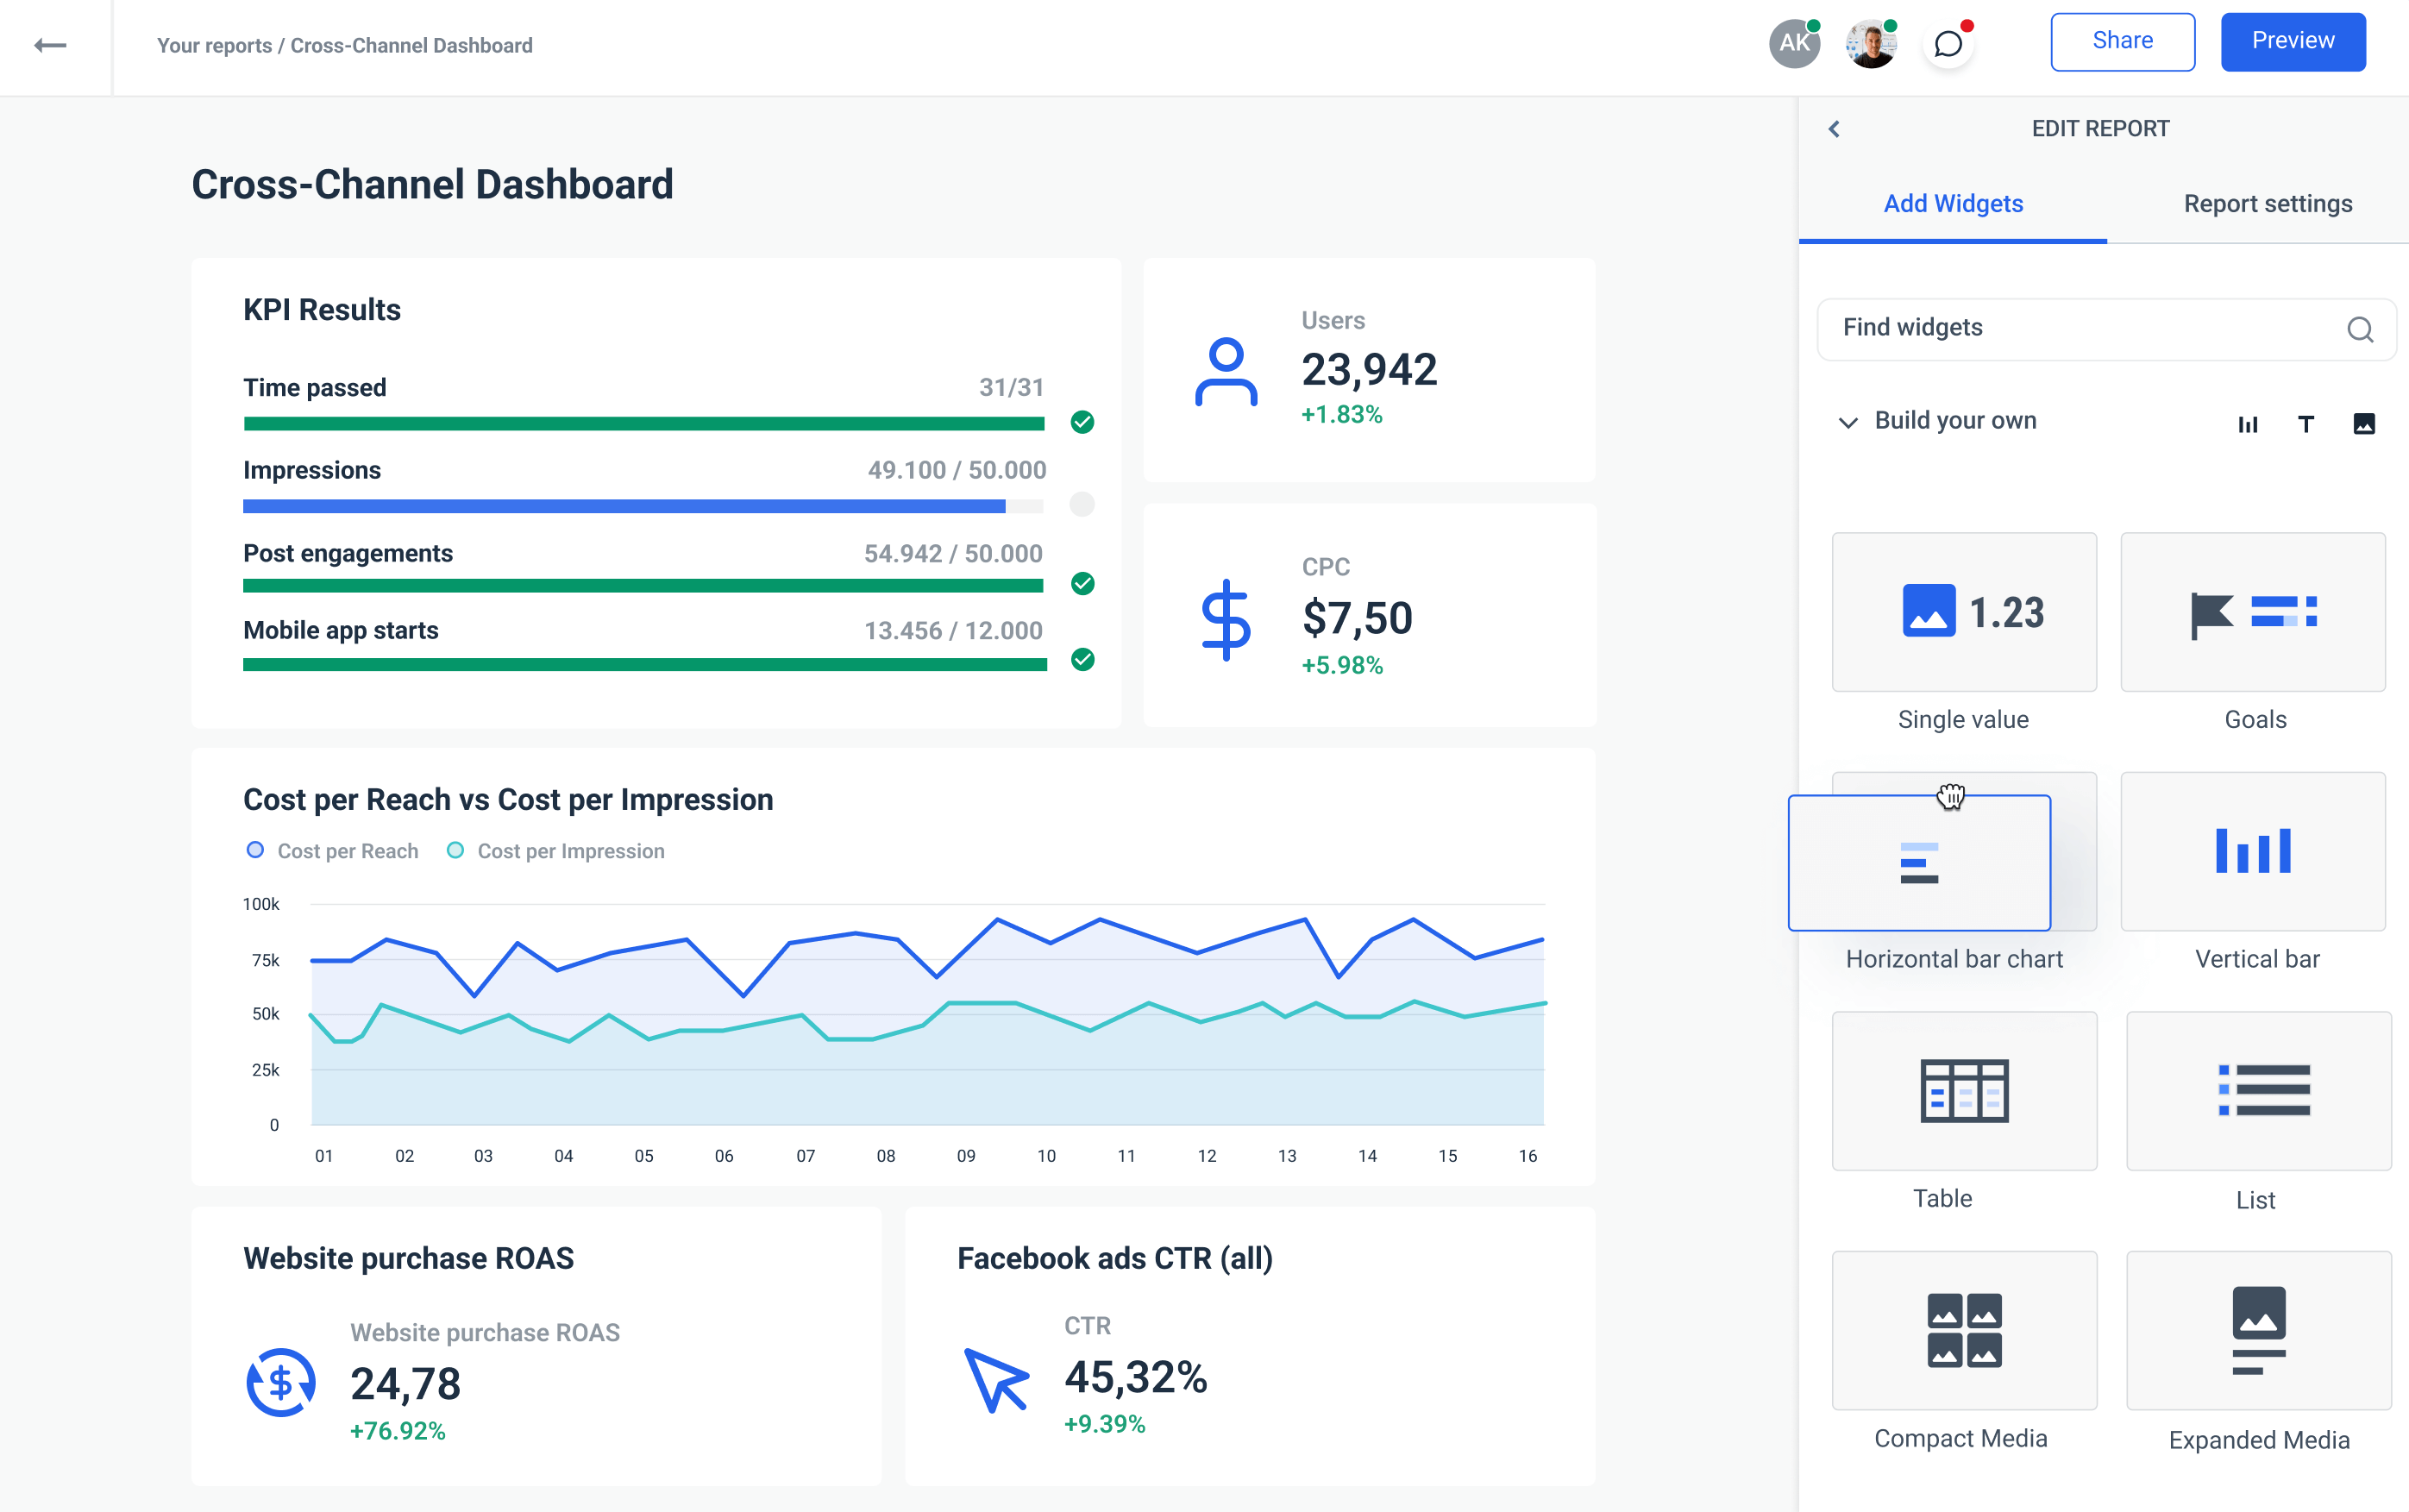
Whatagraph offers a selection of engaging visual reports that you can use to track the performance of your business, but we recommend you start with our cross-channel KPI report. 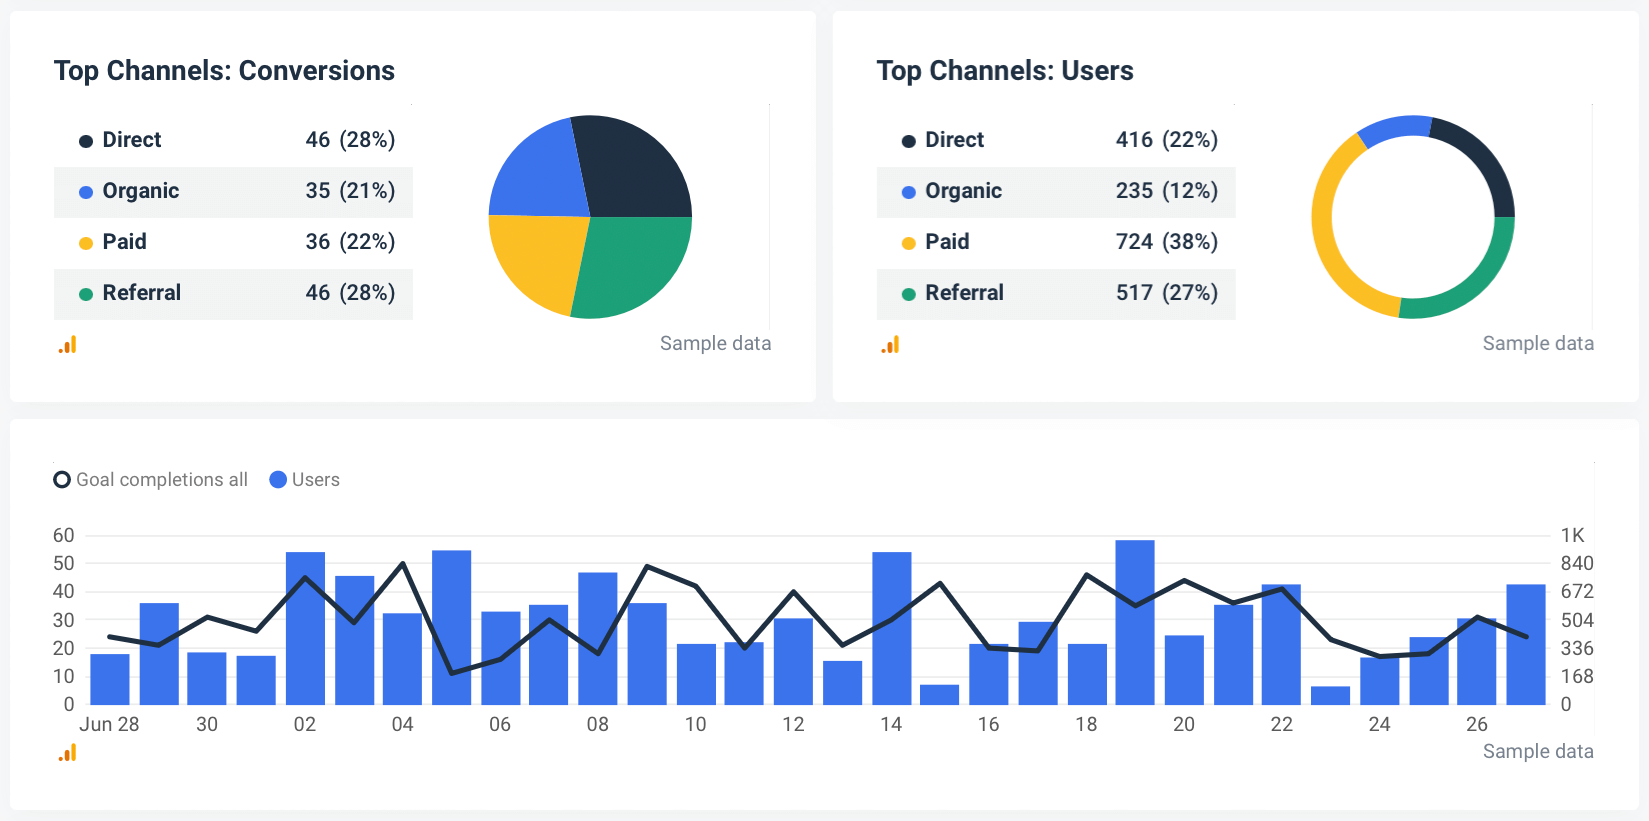
This report lets you track all your performance KPIs in one location. Simply connect the sources and deliver accurate insights and KPIs in just a few clicks. Whatagraph effectively automates your KPI tracking and increases the effectiveness of your business decisions.
6. Make a difference between KPIs and metrics
Key performance indicators and metrics are terms used when talking about progress and performance in data analytics, but we must make a distinction between the two.
KPIs measure performance or progress based on specific business goals and objectives. The word “key” here means they only track what’s necessary for the company’s strategic initiatives.
A good KPI helps you understand whether you’re making the right decisions. They are a map to business goals and indicate whether your company is moving forward. Some KPI examples are sales growth, revenue growth, customer lifetime value, and retention.
Metrics are numeric measurements used to quantify the performance of specific business processes at an operational level. They provide more context to the performance of essential business goals but are not as critical to success as KPIs are.
Although not the most important indicators for monitoring strategic actions, metrics are used to inform marketing teams or business leaders about the overall performance of different areas. Examples include the lead-to-conversion ratio, return rate, cash flow, and acquisition cost by marketing channel.
KPIs | Metrics | |
| Measure: | key business goals | specific business processes |
| Perspective: | high-level | low-level |
| Relevance: | all departments | specific departments |
| Use: | strategic decision-making | operational decision-making |
Understanding the differences between these two will help you get the maximum value from your KPI monitoring dashboard.
7. Set KPI targets
Setting the right goals and targets is essential for the success of effective KPI tracking. Assess your current situation in all relevant areas. You can also look into your competitors’ performance and run market research to help you set realistic benchmarks that can lead you to continual progress. When setting up the KPI targets, include both short-term and long-term goals.
8. Choose cohesive groups of KPIs
You might have noticed that different KPI tracking dashboards are already preloaded with KPIs that work as one to measure progress in specific business areas. Also, your visualizations should complement one another. For example, you may include KPIs like customer acquisition cost (CAC), click-through rates, and cost-per-click in one dashboard to track marketing KPIs.
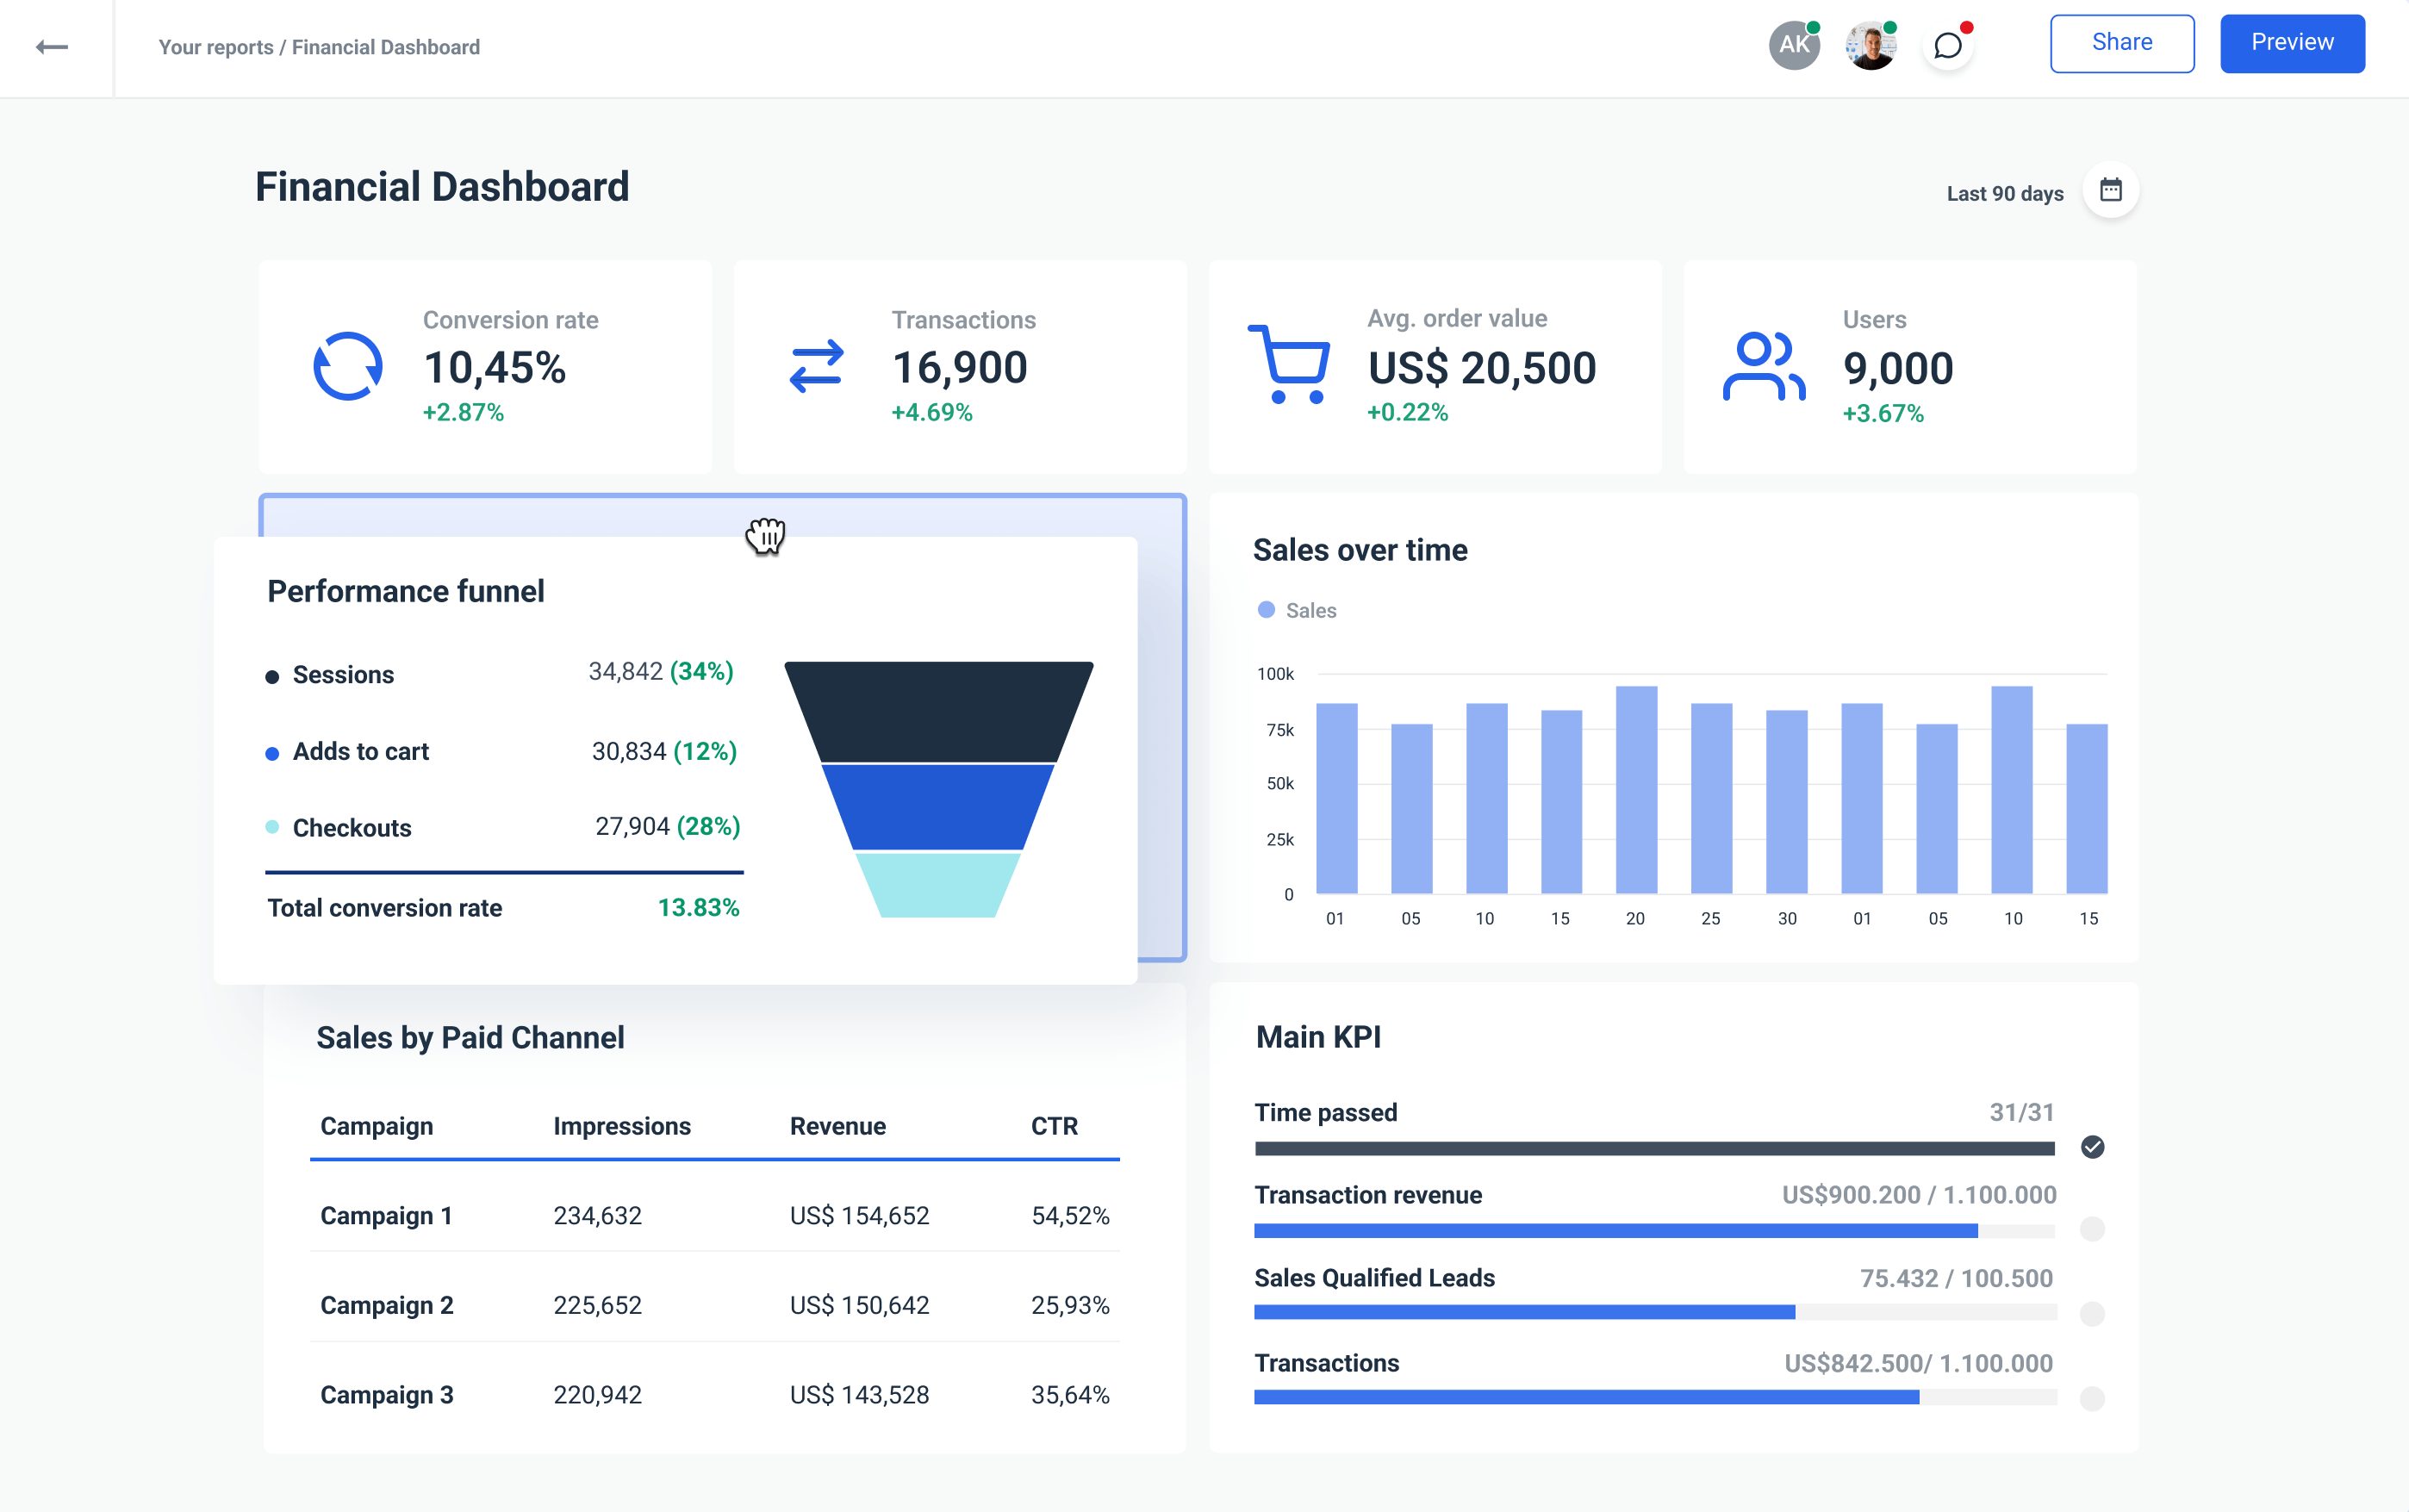
On the other hand, if you’re building a financial KPI dashboard, you should include the cash conversion cycle, sale-qualified leads, and transactions.
9. Re-evaluate the KPI choice
As you’re reaching your benchmarks and scaling your business, you need to check in occasionally and assess your choice of KPIs to track. Leave time to evaluate your choices quarterly as you gather internal feedback. Key performance indicators that no longer align with your organization’s needs take up unnecessary space on your dashboard. You need to replace them with one that offers more value in growth and success. This periodical KPI reassessment is perhaps the most crucial process in KPI tracking.
How to choose a top KPI tracking software?
Let’s now explain what to look for in a great KPI tracking tool.
Data connectors
The first feature you should be looking for is the software’s ability to connect all your internal and external sources to one dashboard. These sources include historical databases, sheets, social media, or CRM tool data. This will allow you to perform cross-channel analysis between different departments or platforms.
However, the problem with 3rd party connectors is that they tend to break off and cost extra for every data source you add.
Whatagraph, on the other hand, has native integrations to more than 45 marketing platforms, which provides secure and automated connections. Select the account you want to include, and the KPI dashboard automatically populates with the latest data.
User-friendly interface
Thanks to powerful data analytics platforms, data analysis is no longer reserved for data analysts or scientists. An agency or business that wants to successfully leverage the power of data needs KPI tracking software accessible to anyone in the company.
As a platform that connects, visualizes, and shares marketing data, Whatagraph has a user-friendly interface allowing technical and non-technical users to take advantage of the latest insights for more learned decision-making.
Advanced KPI analytics
If technical users want to go one extra mile with the data, KPI software should also include advanced analytics features. This includes analyzing databases such as MySQL, PostgreSQL, Oracle, and MS SQL. Cross queries, custom fields and expressions, data forecasting, and trend analysis can lead to deeper insights and help fine-tune your strategy.
Interactive KPI dashboards
An interactive KPI dashboard can take your analytics and benchmarking efforts to the next level. When you pick a KPI monitoring tool, ensure it comes with a powerful dashboard builder with basic and advanced features to interact with your information and monitor the KPIs from different angles to deliver the best results.
Whether you create one from scratch or pick one from Whatagraph’s template library, our dashboards allow you to change the date ranges and explore different dimensions and metrics for more granularity in your reports.
Sharing options
Apart from accessibility and ease of use, another point you should consider when choosing a KPI tracking tool is how easy it is to share the insights with clients, team members, or stakeholders. With advanced data platforms like Whatagraph, easy sharing is part of the package.
Share every Whatagraph report you create through scheduled emails or by sharing a live link, in case of dashboards. This way, you only need to set up sharing once, and the recipients get the right report in their inbox on time every time.
You can export data as CSV or Excel files to further analyze the KPI insights in another business intelligence tool such as Tableau.
Real-time access to KPI data
Another benefit of modern KPI tracking software is that it gives you constant access to dynamic real-time data. Whatagraph dashboards, for example, provide interactive visualizations that display key patterns, trends, and information as it updates. With real-time insights in your hand, you can tackle any issues before they get out of control and, at the same time, make better-informed decisions. Easy access to real-time data also improves communication and collaboration with colleagues from other teams, as you all can be on the same page.
KPI tracking with Whatagraph
Whatagraph is an all-inclusive platform for connecting, visualizing, and sharing marketing data. It can natively pull data from 45+ sources and present the desired KPIs in interactive dashboards and reports that are easy to understand and share.
As an all-in-one KPI tracking solution, Whatagraph is an excellent choice for businesses and agencies whose staff may not have the technical skills to connect sources and stitch data from different platforms manually.
- For businesses
Business users can benefit from Whatagraph to provide automated data tracking and reporting across the teams and departments, as well as key performance indicators related to their business goals.
- For marketing agencies
Whatagraph is an ideal match for agencies that serve multiple clients, each with diverse channels and different sets of KPIs to track. Using our dashboard and report builder, teams can easily set up a performance tracking dashboard for each client and set up client sharing with just a few clicks.
Whatagraph also offers no-code data transfers to Google BigQuery. Moving your data to a self-managed data warehouse allows you to:
- Compare recent insights with historical data – no date range limits.
- Keep your data safe from the discontinuation of individual platforms.
- Overcome querying limits and different policies of individual platforms.
In other words, warehousing allows you to become a true owner of your data — and the KPIs you can extract from it.
Improve your KPI tracking today
Using an interactive cross-channel KPI dashboard is a great way to quickly see if your business or client’s marketing campaign is meeting its strategic objectives, as well as identify areas where the performance can improve.
If you don’t know where to start, I suggest you take advantage of Whatagraph’s free 7-day trial.
Thanks to the quick setup and the intuitive drag-and-drop report builder, Whatagraph is incredibly easy to learn. Connect your sources once, and the dashboard automatically updates with fresh data.
No time to build a KPI tracking dashboard from scratch?
Pick one from our library of professionally-built dashboards and customize it to your needs.
Book a call today. Watch our product demo, create your KPI dashboard, and start picking the low-hanging fruits.
Published on Feb 11 2020
WRITTEN BY
Nikola GemesNikola is a content marketer at Whatagraph with extensive writing experience in SaaS and tech niches. With a background in content management apps and composable architectures, it's his job to educate readers about the latest developments in the world of marketing data, data warehousing, headless architectures, and federated content platforms.