KPIs vs. Metrics: The Ultimate Guide [+Examples]
KPIs and metrics are often misunderstood to have similar objectives. However, they’re not the same, and continuing to use them on equal terms will hamper your business goals. In this blog, we’ll help you differentiate both and also how to use them for more revenue and devise better strategies to reach your goals.

Aug 03 2020●8 min read


If I had to explain the difference between KPIs and metrics in a line, then it would be— all KPIs are metrics, but not all metrics are KPIs. KPIs are the foundation for a metric to track any results.
So while you think it is alright with exchanging these two terms synonymously, it's not. It will significantly affect your business's performance. Because there are high chances, you're focused on the wrong measurement.
What is a metric?
Metrics are the values that give you insights into how your efforts generate revenue. It is a quantifiable measure to track performances and a crucial way to measure data. When you understand the effectiveness of campaigns, it shapes your current and future marketing strategies.
But businesses have an endless list of different metrics to monitor, measure, or track. From web traffic to conversion rates, Facebook likes and shares, and purchases.
Theoretically, this sounds great. But as the data increases, the load to track the metric increases too. In most cases, the overwhelming amount of data becomes a distraction.
When you try to improve the various metrics, there is a high probability that you will even forget to ask yourself whether these improvements will positively affect your bottom line, which is mainly fulfilling your business objectives.
Does getting more likes on social media is directly proportional to ROI? Not really. This is why you must identify which of your metrics are key performance indicators.
With that, you'll be able to prioritize them while you optimize them to improve your business. But to do that, you need to know the difference between KPIs and metrics.
What is a key performance indicator (KPI)?
A Key Performance Indicator (KPI) is a business metric that directly contributes to a specific business goal, ultimately enhancing your overall business success.
The key performance indicators can include bookings, backlog, utilization, effective billable rate, revenue leakage, and many more for professional services tracked with the KPI reporting tool. There are many KPIs for every department and industry, which is why a sample KPI library can be useful as a starting point in performance management.
In a SaaS company, the most common KPIs include monthly and annual recurring revenue, cost per click, cost per acquisition, average revenue per retainer, lifetime value, churn, and many more.
Similarly, in a retail setting, the key performance indicators range from customer acquisition, stock turnover, average customer spending, and customer satisfaction, among others.
Key performance indicators can also provide you with means to quantify your performance in comparison to your competitors or industry benchmarks.
As seen in the earlier instances, KPIs are often dependent on the industry and the business model. This is because these metrics directly impact the particular business objectives.
Metrics vs KPIs: the difference
The main difference between a metric and KPI is that KPIs are attached to a specific time frame such as a month or a quarter but a metric isn’t to one because you need to track them every day for various purposes.
| Basis | KPI | Metrics |
| Connection with goals | Tied to a specific goal | Various data points when collected together form a KPI |
| Timeframe | KPIs are goals attached to a timeframe | Metrics aren’t tied to a timeframe because it's an everyday necessity. |
| Revenue | A KPI drills down to your revenue | Metrics help you diagnose the cause of why or why not you’ve achieved your business goals. |
| Importance | KPIs help you decide the right metric for your business goals. | Without KPIs you cannot decide on any handful of metrics. |
Specific goals and data points
KPI is a business metric tied to a specific goal by a specific team. Whereas metrics are different data points in your funnels that, when collected together, create a KPI.
For example, you want 5000 people to register for your webinar. But to track that one goal, you need to measure the number of sign-ups, the number of website visitors, clicks on the ads, and the conversion rate of the webinar landing page.
The goal of 5000 registrants for the webinar is your key performance indicator, and the number of sign-ups, website visitors, click-through ads, and conversion rate are your metrics. And certainly, your KPI can have multiple metrics, but a group of metrics can only have one KPI.
A timeframe
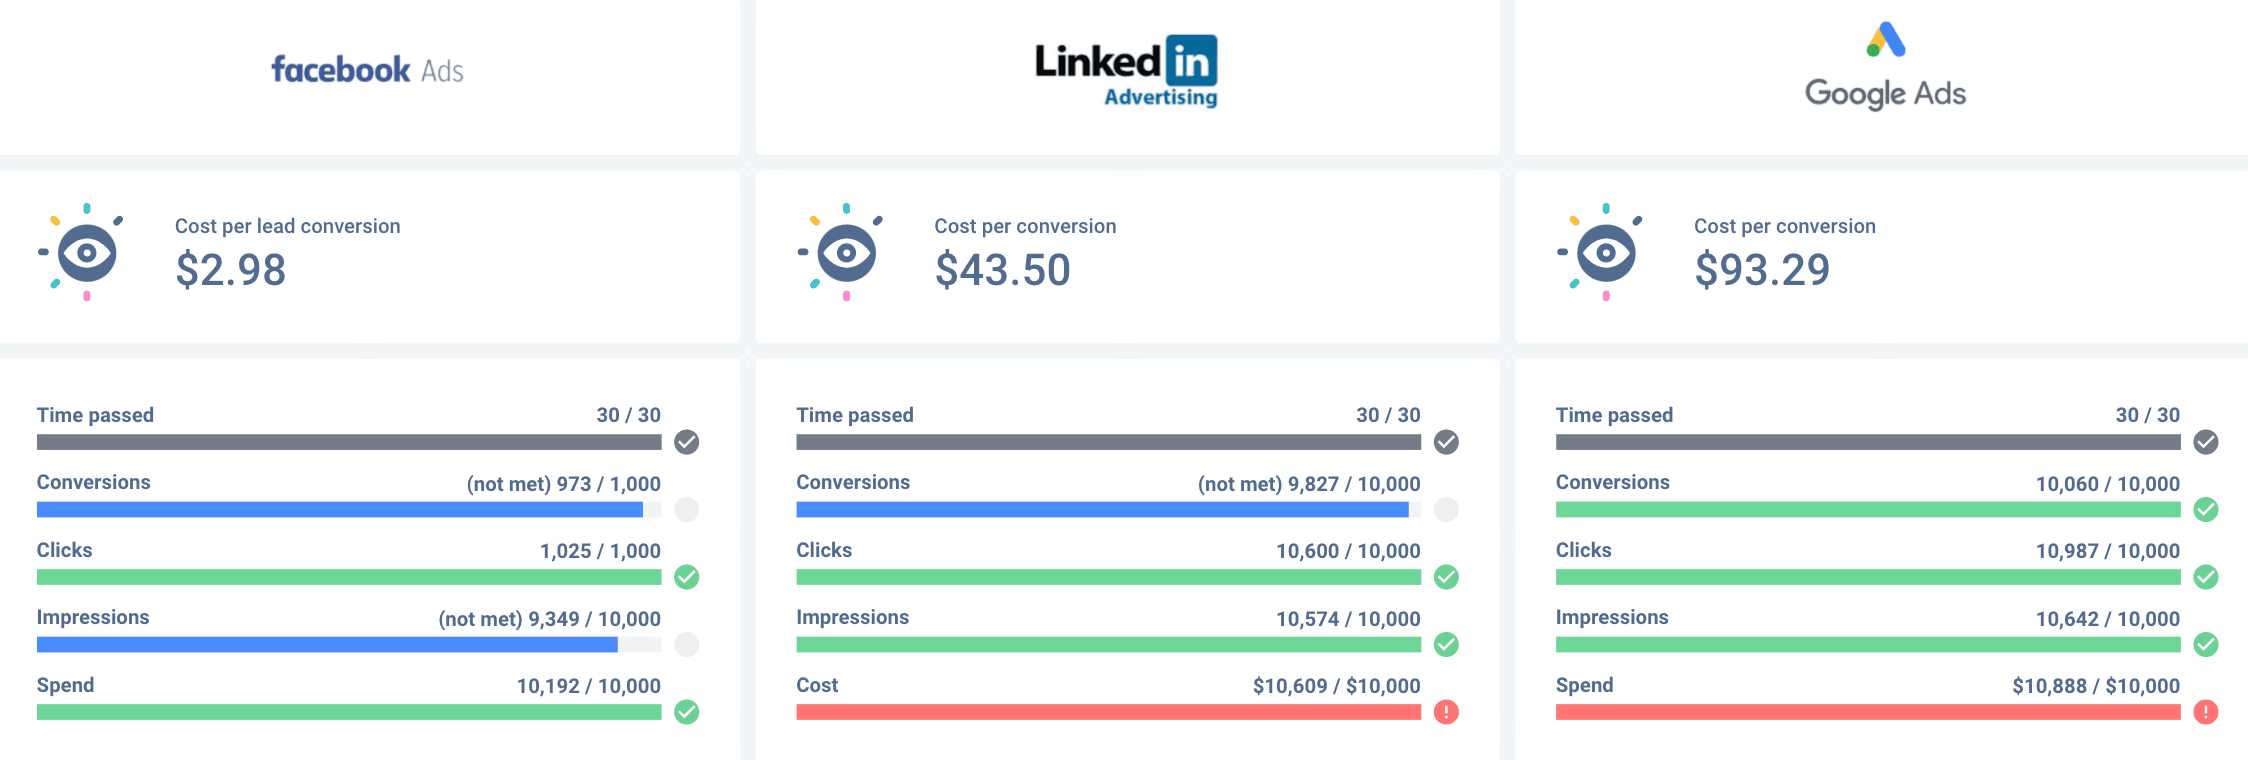
Key performance indicators are goals you need to achieve in a certain period of time. And metrics aren't tied to a timeframe because you need them every time.
![]()
Key performance indicators are goals you need to achieve in a certain period of time. And metrics aren't tied to a timeframe because you need them every time.
The KPIs have a timeframe, but metrics are general and crucial growth marketing numbers like conversion rate, traffic rate, bounce rate, pages per visit, and number of website visitors, among others.
For example, you want to generate X number of traffic within 90 days. And to track progress, you'll monitor returning visitors, website traffic, total churn rate, retention time, and shares on social media.
But it's not like you're especially targeting these metrics for one KPI; you're already tracking them since the day you've taken your business in the digital paradigm. Whereas you target KPI for a specific business objective.
Revenue
The official definition of KPI is really broad, but a true KPI always goes back to how your company can improve revenue growth. For example, sales leads, ROI (return on investment), cost per lead, etc.
Whereas metrics help you diagnose why your KPIs are going in any right or wrong directions.
Main lead
Let's say you're watching a play, and you see some of the characters that only appear during a few scenes, some in almost every scene, and there are main characters, and without them, you cannot finish a drama successfully.
These main characters are your KPIs, and others are your metrics. There are various metrics to choose from, but some are more essential than others when you think of the business.
And these business goals are your KPIs. Without KPIs, you cannot go haywire and choose any handful of metrics you think are best for your business objectives.
Example of KPIs and metrics
There are countless KPIs and metrics to choose from, and it’s easy to get lost rather than hitting the bull’s eye. Here’s a list of KPIs and metrics examples for better understanding.
- Sales KPIs
- Inbound leads
- Lead response time
- Upsell percentage
- Cross-sell percentage
- Sales target by the percentage
- Sales metrics
- Sales growth
- Average profit margin
- Average purchase value
- Product performance
- Marketing KPIs
- Marketing Qualified Leads (MQLs)
- Sales Qualified Leads(SQLs)
- X number of new customers
- Upsell and cross-sell rates
- Marketing metrics
- Web traffic sources
- Incremental sales
- Social sentiment
- End action rate
- SEO keyword ranking
How to measure metrics performance in business
Here are four crucial business metrics you should track to measure performance in business:
Sales revenue
Keeping a tab on sales revenue allows you to measure your financial performance. These are the sales you make by selling your products and deducting the cost of returned items and products that never got delivered.
By tracking this important metric, you can learn about:
- The interest of people in purchasing your products.
- If your marketing strategies are going in the right direction.
- Your numbers vs. your competitors' numbers
While measuring sales revenue and setting strategic goals, consider external factors that might affect the key results. It can be fluctuation in the market, competitor activity, or any new government policy. This will help you decide if your sales team needs to tweak their strategy to increase your net profit.
Customer churn rate
Customer churn rate depicts the number of users who stop using your product after some time. And you don't want this metric to increase. Here is how you can calculate customer churn rate:
Number of cancellations in that time/ total number of customers over that same period *100
Reducing churn should be one of your marketing team’s priorities because you cannot go on and let users leave your platform while you spend five times more to acquire a new customer.
Customer satisfaction rate
Business is not only about selling to more people every time but also keeping your existing customer satisfied simultaneously. And to measure customer satisfaction, you need to understand how your customers are feeling.
CSAT (customer satisfaction rate) is an important metric that helps you to measure customer happiness. So you need to create a scale in the 1-5 range and ask customers to rate their experience with your product or business.
You can use numbers, stars, and smiley faces to create a CSAT scale. Make sure you keep your CSAT questions limited to one experience and not bombard them with tons of different questions tied to different scenarios.
This way, you can generate maximum responses. To calculate the ultimate CSAT score, add the sum of all scores and then divide it by the number of respondents.
Customer acquisition costs
CAC (customer acquisition costs) tells you about the expenses of acquiring new customers. By keeping a tab on this important metric, you get to know about the real growth of your business.
For example, you witness significant growth in your customer base, but you don't see much of a profit. This could be because you're spending too much on marketing.
And you'll need to work on a tighter marketing budget for a while to see if that affects your profits and customer growth.
How to use KPIs in your business
Now that you know the difference between metrics and KPIs, you would probably be concerned about identifying which KPIs contribute to your business growth. How do you determine the specific KPIs to measure for your business? Here are the three simple steps to follow:
Step one: Choose a specific business goal for the year
Discussions regarding KPIs often lead to strategic business plans and business goals. Regardless of your specific business goals, you need to have a clear vision of what you're trying to achieve.
Instead of creating a seemingly unproductive list of business goals, you should consider choosing a specific business goal for the year. This serves as a guide to help you choose the specific KPI to focus on.
And the right way to determine your business goals depends upon your situation and the various factors surrounding it. But you need to ensure that you set SMART goals, where
- S stands for specific
- M stands for measurable
- A stands for achievable
- R stands for relevant
- T stands for time focused
Here are a few questions you need to ask yourself to get a clearer idea about your goals.
- Is your business currently heading toward profitability? Set a revenue goal.
- Does your business find it difficult to break even? Set a goal to increase profitability.
- Do you currently run a venture-funded startup threading towards a unicorn ($1B valuation)? Set a goal to increase the growth rate.
Step two: Identify the specific metrics that directly impacts your chosen business goal
identifying your business goal, the next is to examine the important metrics you are already tracking for your business.
All these metrics are relevant to your business performance, but not all of them are directly related to your business goals. While you need to keep your eyes on them, they do not qualify as key performance indicators.
In this phase, you’ll have to determine the specific metrics that directly contribute to achieving your overarching business goal. And, the most important KPI is the same metric to use for your business goals.
Because they seem to be the clearest and closest indicator of your business performance, for instance, if you have set out a business goal relating to your customer satisfaction, the most valuable KPIs will be the CSAT score and net promoter score.
Although there is a lot of debate around how many KPIs are enough, you should focus on 2-3 KPIs because, let's be honest, you don't have 5-10 metrics that are key performance indicators.
You can also use a marketing KPI dashboard to make the tracking process easier for KPIs and metrics. Creating a KPI dashboard helps you organize data and visualize countless metrics and data that you might overlook while reviewing it from traditional spreadsheets.
Step three: Create a schedule to review the KPIs
Once you have been able to identify the three key performance indicators to concentrate on, you need to review them regularly. Individually, you can consider reviewing these KPIs in the following intervals:
- Weekly
- Monthly
- Bi-Monthly
- Quarterly
So if you get off track, you'll notice it quickly and take appropriate measures to contribute to your business success.
Wrapping up
You cannot grow a business with confusion around goals. Setting clearer business goals will make it easier for you to communicate the same with everyone in the company, along with identifying the data you need to set good KPIs and performance metrics.
And one of the greatest advantages of knowing the difference between KPIs and metrics is to turn the overwhelming amount of data into actionable insights that help you achieve your goals and measure them.
Published on Aug 03 2020
WRITTEN BY
Mile ZivkovicMile is the ex-Head of Content at Whatagraph. A marketing heavy with almost a decade of SaaS industry experience, Mile has managed multiple content marketing teams without losing an ounce of his writing passion.