Google Analytics MCP: How to Connect GA4 & Cross-Channel Data to Claude
A Google Analytics MCP lets you talk to your GA4 data in plain language on Claude or ChatGPT without having to download and upload spreadsheets.
But the real challenge comes when you want to connect multiple GA4 properties or blend data from GA4 with other channels like Google Ads.
In this article we'll cover not just how to connect GA4 data to Claude, but also how to do a cross-channel analysis across all your marketing channels and GA4 properties.

Jun 26 2026●10 min read


If you only ran one GA4 property, you wouldn't need much of a guide. Connect it, ask Claude a question, move on.
But if you’re running ten or twenty properties or client accounts, each with its own naming, its own conversions, its own quirks. Connecting that to Claude is a different problem entirely.
A Google Analytics MCP lets you query your GA4 data in plain language without having to download and upload spreadsheets. You can ask Claude about traffic, conversions, and audiences and get an answer back in seconds.
But the trouble starts when you point it at a dozen client properties at once.
Ask “which clients grew traffic last month” and Claude has to make sense of twelve different setups on the fly.
If your channel groupings don't match, your conversions are defined differently across clients, or your campaign names never lined up, you get a confident answer built on a mess. Garbage in, garbage out.
It's usually not Claude getting it wrong. It's the data underneath.
As Whatagraph's CEO Justas puts it, "outputs are only as good as what feeds them." Skip the foundation and you end up, in his words, with "beautiful garbage."
In this article, we’ll cover:
- how to connect Google Analytics to Claude across all your properties
- how to set the data up so the answers hold across every client
What is a Google Analytics MCP server?
A Google Analytics MCP server is a connector that gives an LLM like Claude direct access to your GA4 properties so you can query GA4 data without exporting to Google Sheets.
You ask a question in plain language, and it pulls the answer back: traffic, conversions, audiences, whatever you'd usually go digging through a report for. You don’t need to wrangle with CSV exports.
Arturas Lazejevas, Whatagraph's CTPO, explains it without the jargon:
Think of MCP as a door that LLMs like Claude or ChatGPT can use to access any of your systems that you connect (through the MCP).
In practice that means an MCP can add new tools and update old ones, and Claude adjusts on its own, as long as the server was built with the right tool descriptions behind it.
For GA4 specifically, that opens up a lot. You can pull realtime reports, build funnel reports, query custom dimensions and metrics, and compare time periods, all by asking. The model context protocol for Google Analytics turns GA4 from a place you go to extract data into something you just talk to.
So far, so good. The catch is that not all of these connectors are built the same way, and the differences are exactly what decide whether you can trust what comes back.
Three types of Google Analytics MCP (and why only one gives you answers you can trust)
Before you pick a GA4 MCP server, it's worth asking a few questions about it:
- Where does it actually pull data from: the raw GA4 API, or a unified data layer?
- Can it answer a question that spans GA4 and another channel, like paid?
- Who decides what a "conversion" or "engaged session" means, you or the model, every single time you ask?
The answers depend on which of three types you're dealing with. Arturas breaks them down like this.
| Single-platform MCP | Stitched connector MCPs | MCP over a governed data layer (Whatagraph) | |
|---|---|---|---|
| What it is | A wrapper over one platform's API | Several platform wrappers side by side, with nothing shared between them | A protocol over a unified data model; metrics, currency, and attribution reconciled before the model sees them |
| Cross-channel answer | Not its job. One platform by definition | The LLM stitches it together at query time, and the math drifts | Already blended in the data model |
| Same question, same answer? | Yes, within that one platform | No. Depends on the prompt and the run | Yes. Metrics are defined once |
| Across many client properties | One property at a time | Each one connected, nothing normalized between them | Normalized once, queried together |
| Best for | Single-property GA4 questions | Quick answers when one source is enough | Daily multi-channel reporting and client work |
Whatagraph’s MCP is the third one - MCP over a governed data layer.
You set up your business logic on Whatagraph once - like what a conversion means to you, how campaign names should be, or which currency you speak, and this logic applies across every client report, internal dashboard, and AI answers.
Claude isn't doing data engineering inside the chat; it's reading numbers that were already settled. As Arturas puts it:
We don't query separate connectors like Facebook, Google Analytics, and Google Ads on the fly and have Claude reason about it. We unify all of that data as it comes in. The MCP is just the query layer on top.
This means you can ask the same question on Monday and on Friday and get the same answer - across dozens of client accounts and properties.
That consistency isn't a feature of the MCP itself. It's a feature of what's been built underneath it.
Or as Arturas summed it up: “the connection isn't what's hard. Everything that has to be true after the connection is what's hard.”
How to connect Google Analytics to Claude
Google has an official, open-source GA4 MCP server. It runs locally on your machine, talks to the Google Analytics Admin API and Data API, and gives Claude a handful of tools: listing your properties, running standard reports, funnel reports, realtime reports, and pulling custom dimensions and metrics.
It's free, and if you're comfortable in a terminal, it works. Here's the rough path:
- Set up your environment. Install Python 3.10 or newer, then install pipx to run the server.
- Create a Google Cloud project. In the Google Cloud Console, enable both the Google Analytics Admin API and the Google Analytics Data API. Skip this and the server connects but returns nothing.
- Configure credentials. Set up Application Default Credentials by running
gcloud auth application-default loginwith theanalytics.readonlyscope. You'll do this through an OAuth client, or by impersonating a service account that has access to your GA4 properties. - Add the server to Claude. In Claude Code you can run
claude mcp add analytics-mcp ... -- pipx run analytics-mcpwith your credentials path and project ID. For Claude Desktop, you add the same command and environment variables to theclaude_desktop_config.jsonfile. - Restart and test. Reopen Claude, confirm the server is listed, and ask it to list your GA4 properties to check the connection.
Worth knowing: the server was built primarily with Gemini CLI in mind, so most of the official walkthroughs assume that setup. It works with Claude, but you're adapting instructions as you go.
Where this falls short. A few things pile up fast, and faster the more clients you add.
- It's technical. Python, the gcloud CLI, OAuth clients, JSON config files. Fine for a developer, a real wall for most marketers.
- It runs on one person's laptop, and you authenticate per property. Every new client is another credentials setup, and when that one person is out, the whole thing is out with them.
- And it hands Claude raw GA4 output, one property at a time. Nothing reconciles naming or conversion definitions across clients, so any portfolio-level answer is yours to assemble by hand, every time you ask.
The third point is the most dangeorus. Laurynas Arminas, Whatagraph's Product Manager, has watched teams go down this road:
It's easy to get something 80% done and think you're there. Then you realize how hard that last 20% is.
And it gets harder the more you grow:
Once you're working with seven different channels and seven different places pulling data, things start getting confusing. Every time you add a client or a channel, you have to update everything, and things slip through the cracks.
At two clients and one property, the official server does the job. At ten clients across a dozen properties, maintaining it becomes a job of its own.
How to set up Google Analytics MCP for cross-property and cross-channel reporting
If you want to set up and manage multiple GA4 properties or combine GA4 with Google Ads (or any other channel), Whatagraph is the best Google Analytics MCP for you. Here’s how to set it up.
Before you start, you'll need three things:
- A Whatagraph account with your GA4 properties connected (sign up for free here)
- A Claude account
- Owner or Full Admin access to your Claude workspace
One trick that saves a headache: log into Whatagraph in the same browser you're using for Claude. It turns the authorization step into one click instead of a separate login.
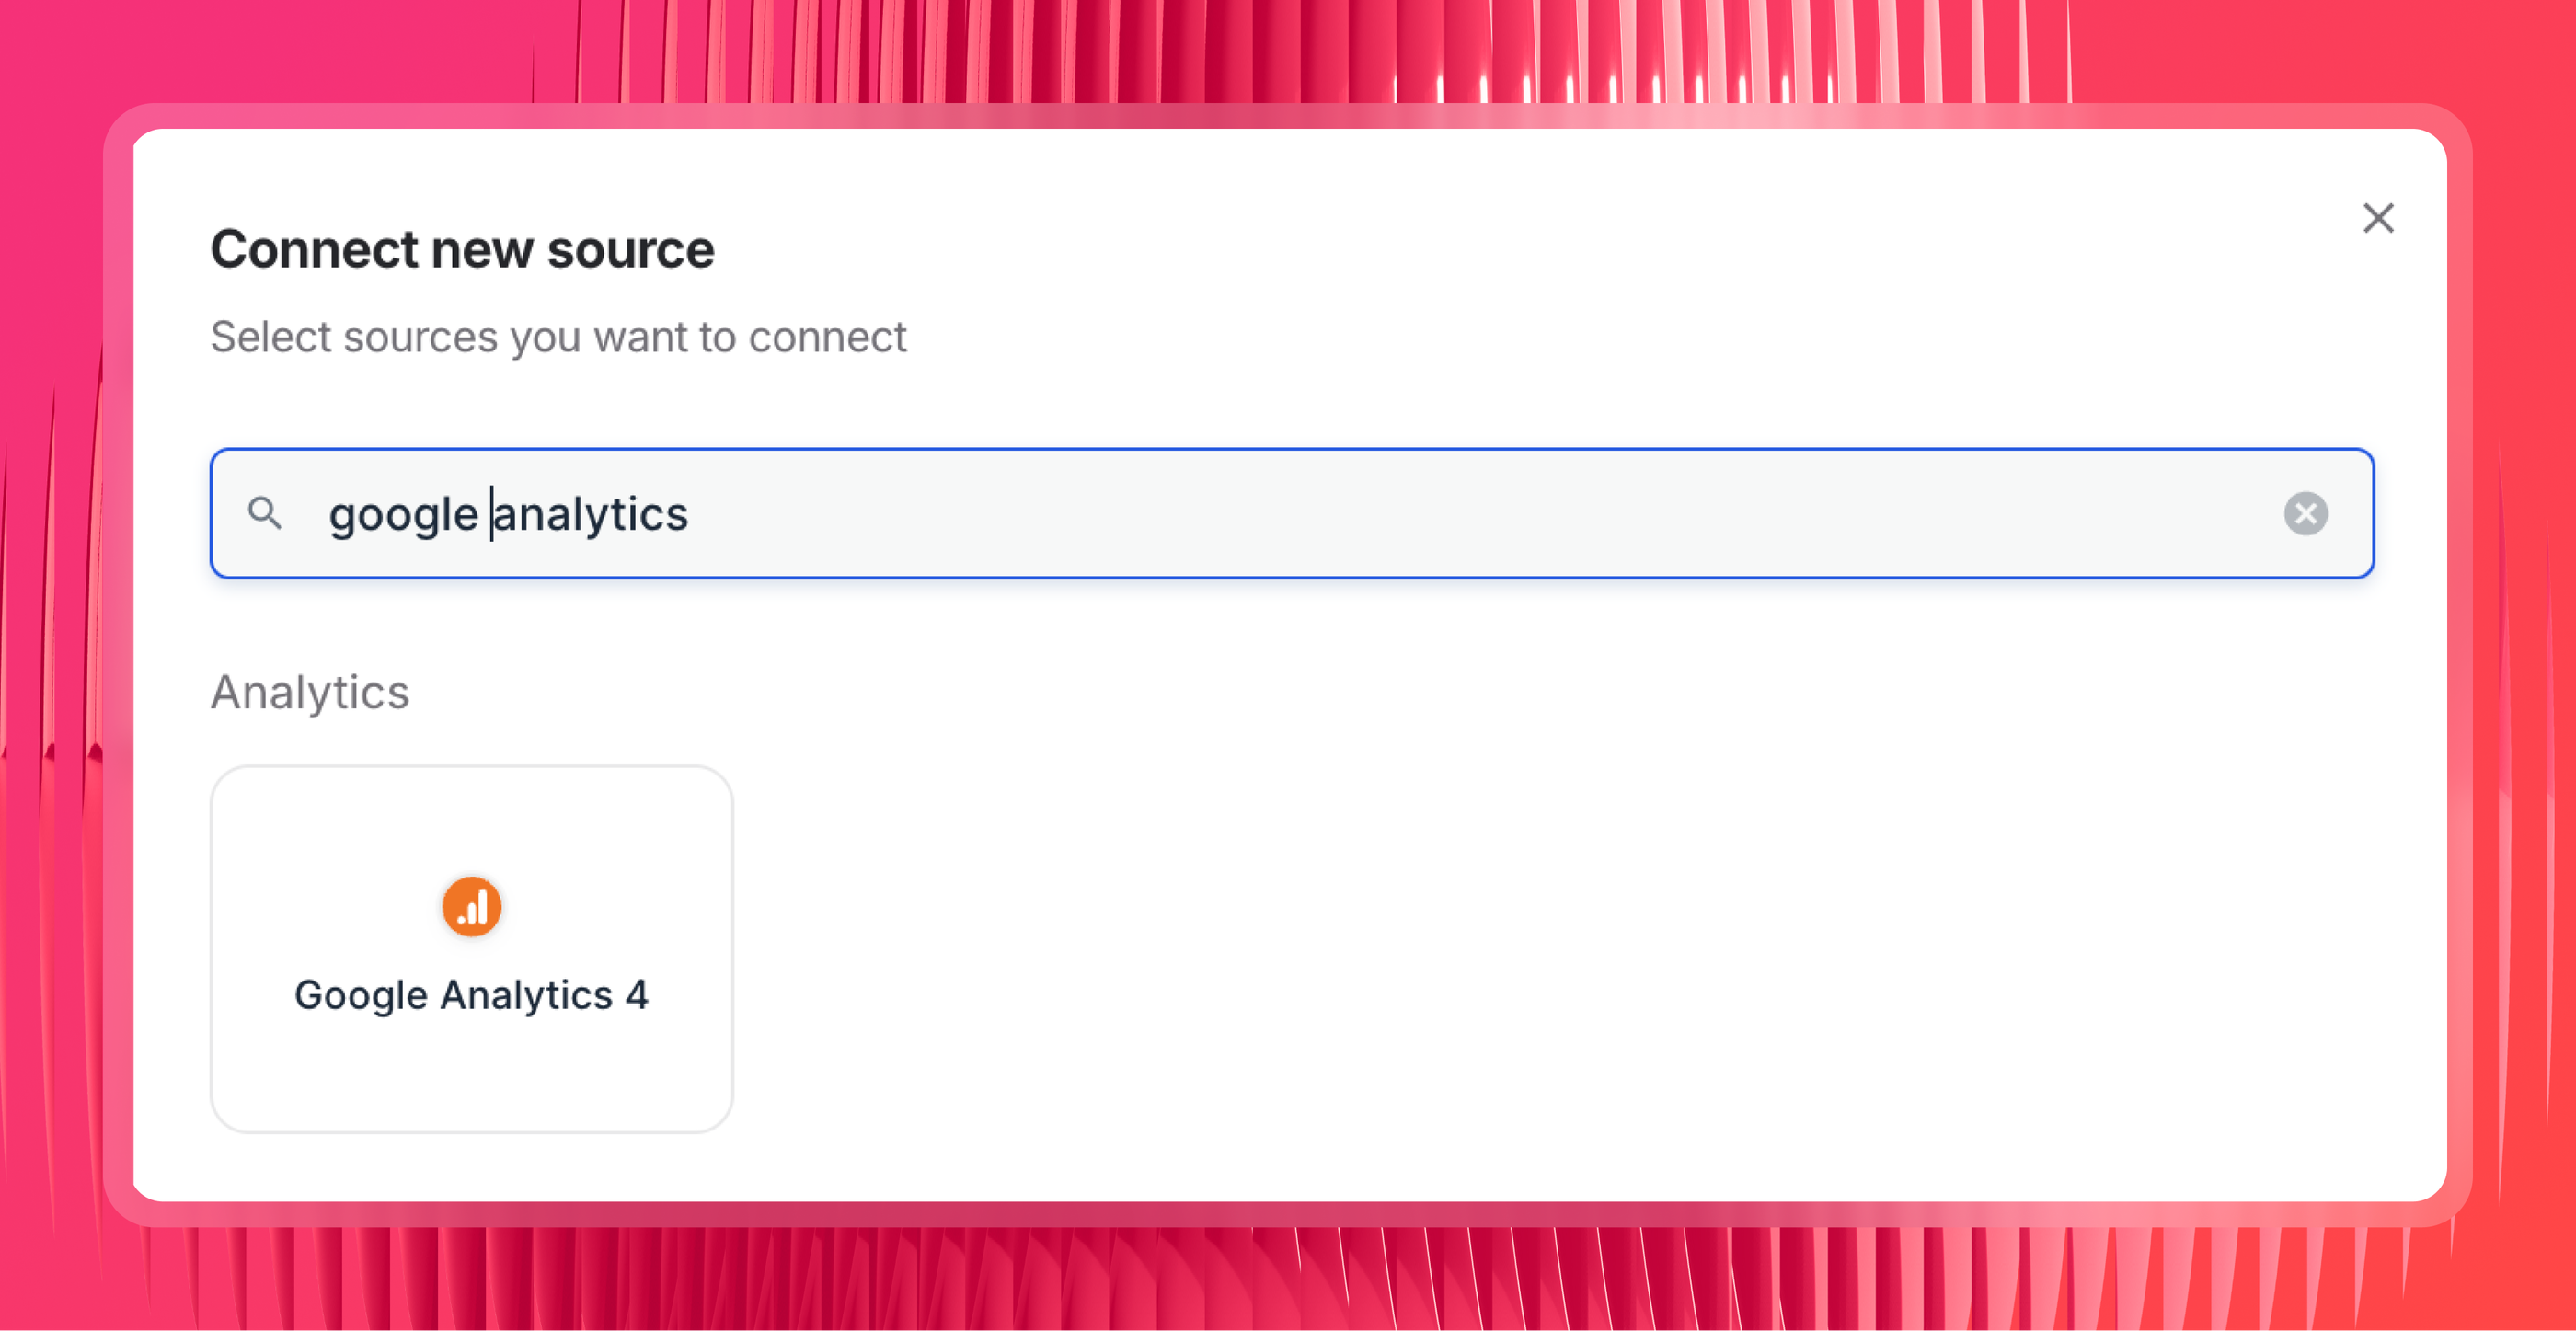
Step 1: Connect your data sources in Whatagraph
If you haven't already, add your GA4 properties as data sources inside Whatagraph. This is where the data actually lives; the MCP just gives Claude a way to query it.
Whatagraph isn't only a GA4 connector, though. It pulls from 60+ marketing platforms, so the same account can hold your Google Ads, Meta, LinkedIn, and Search Console data alongside GA4, all governed the same way.
That matters if you're an agency working upmarket, because a lot of the questions you care about cross platforms.
Say you want to know whether the conversions GA4 recorded last month actually came from your Google Ads campaigns. That's a GA4 and Google Ads question.
To answer it without Claude guessing, both sources need to live in the same place and share the same definitions. So connect them now, and the cross-channel setup in the next step will work.
If you run SEO, connect Google Search Console too. Same setup, and Claude can then answer organic questions across GA4 and GSC from one connection, with no second Google Search Console MCP server to manage.
Step 2: Set up your governed data layer across properties and channels
This is the step that decides whether you can trust the answers across all those properties and channels.
What a governed data layer does is make sure that once the data is in, Claude isn't piling a second layer of mess on top: mismatched naming, guessed currencies, and math it reinvents on every prompt.
As Arturas Lazejevas, Whatagraph's CTPO, puts it:
My suggestion would be to really embed your business logic into Whatagraph first, so that Claude doesn't need to reason about it every time.
Here's what to set up before you ask a single question:
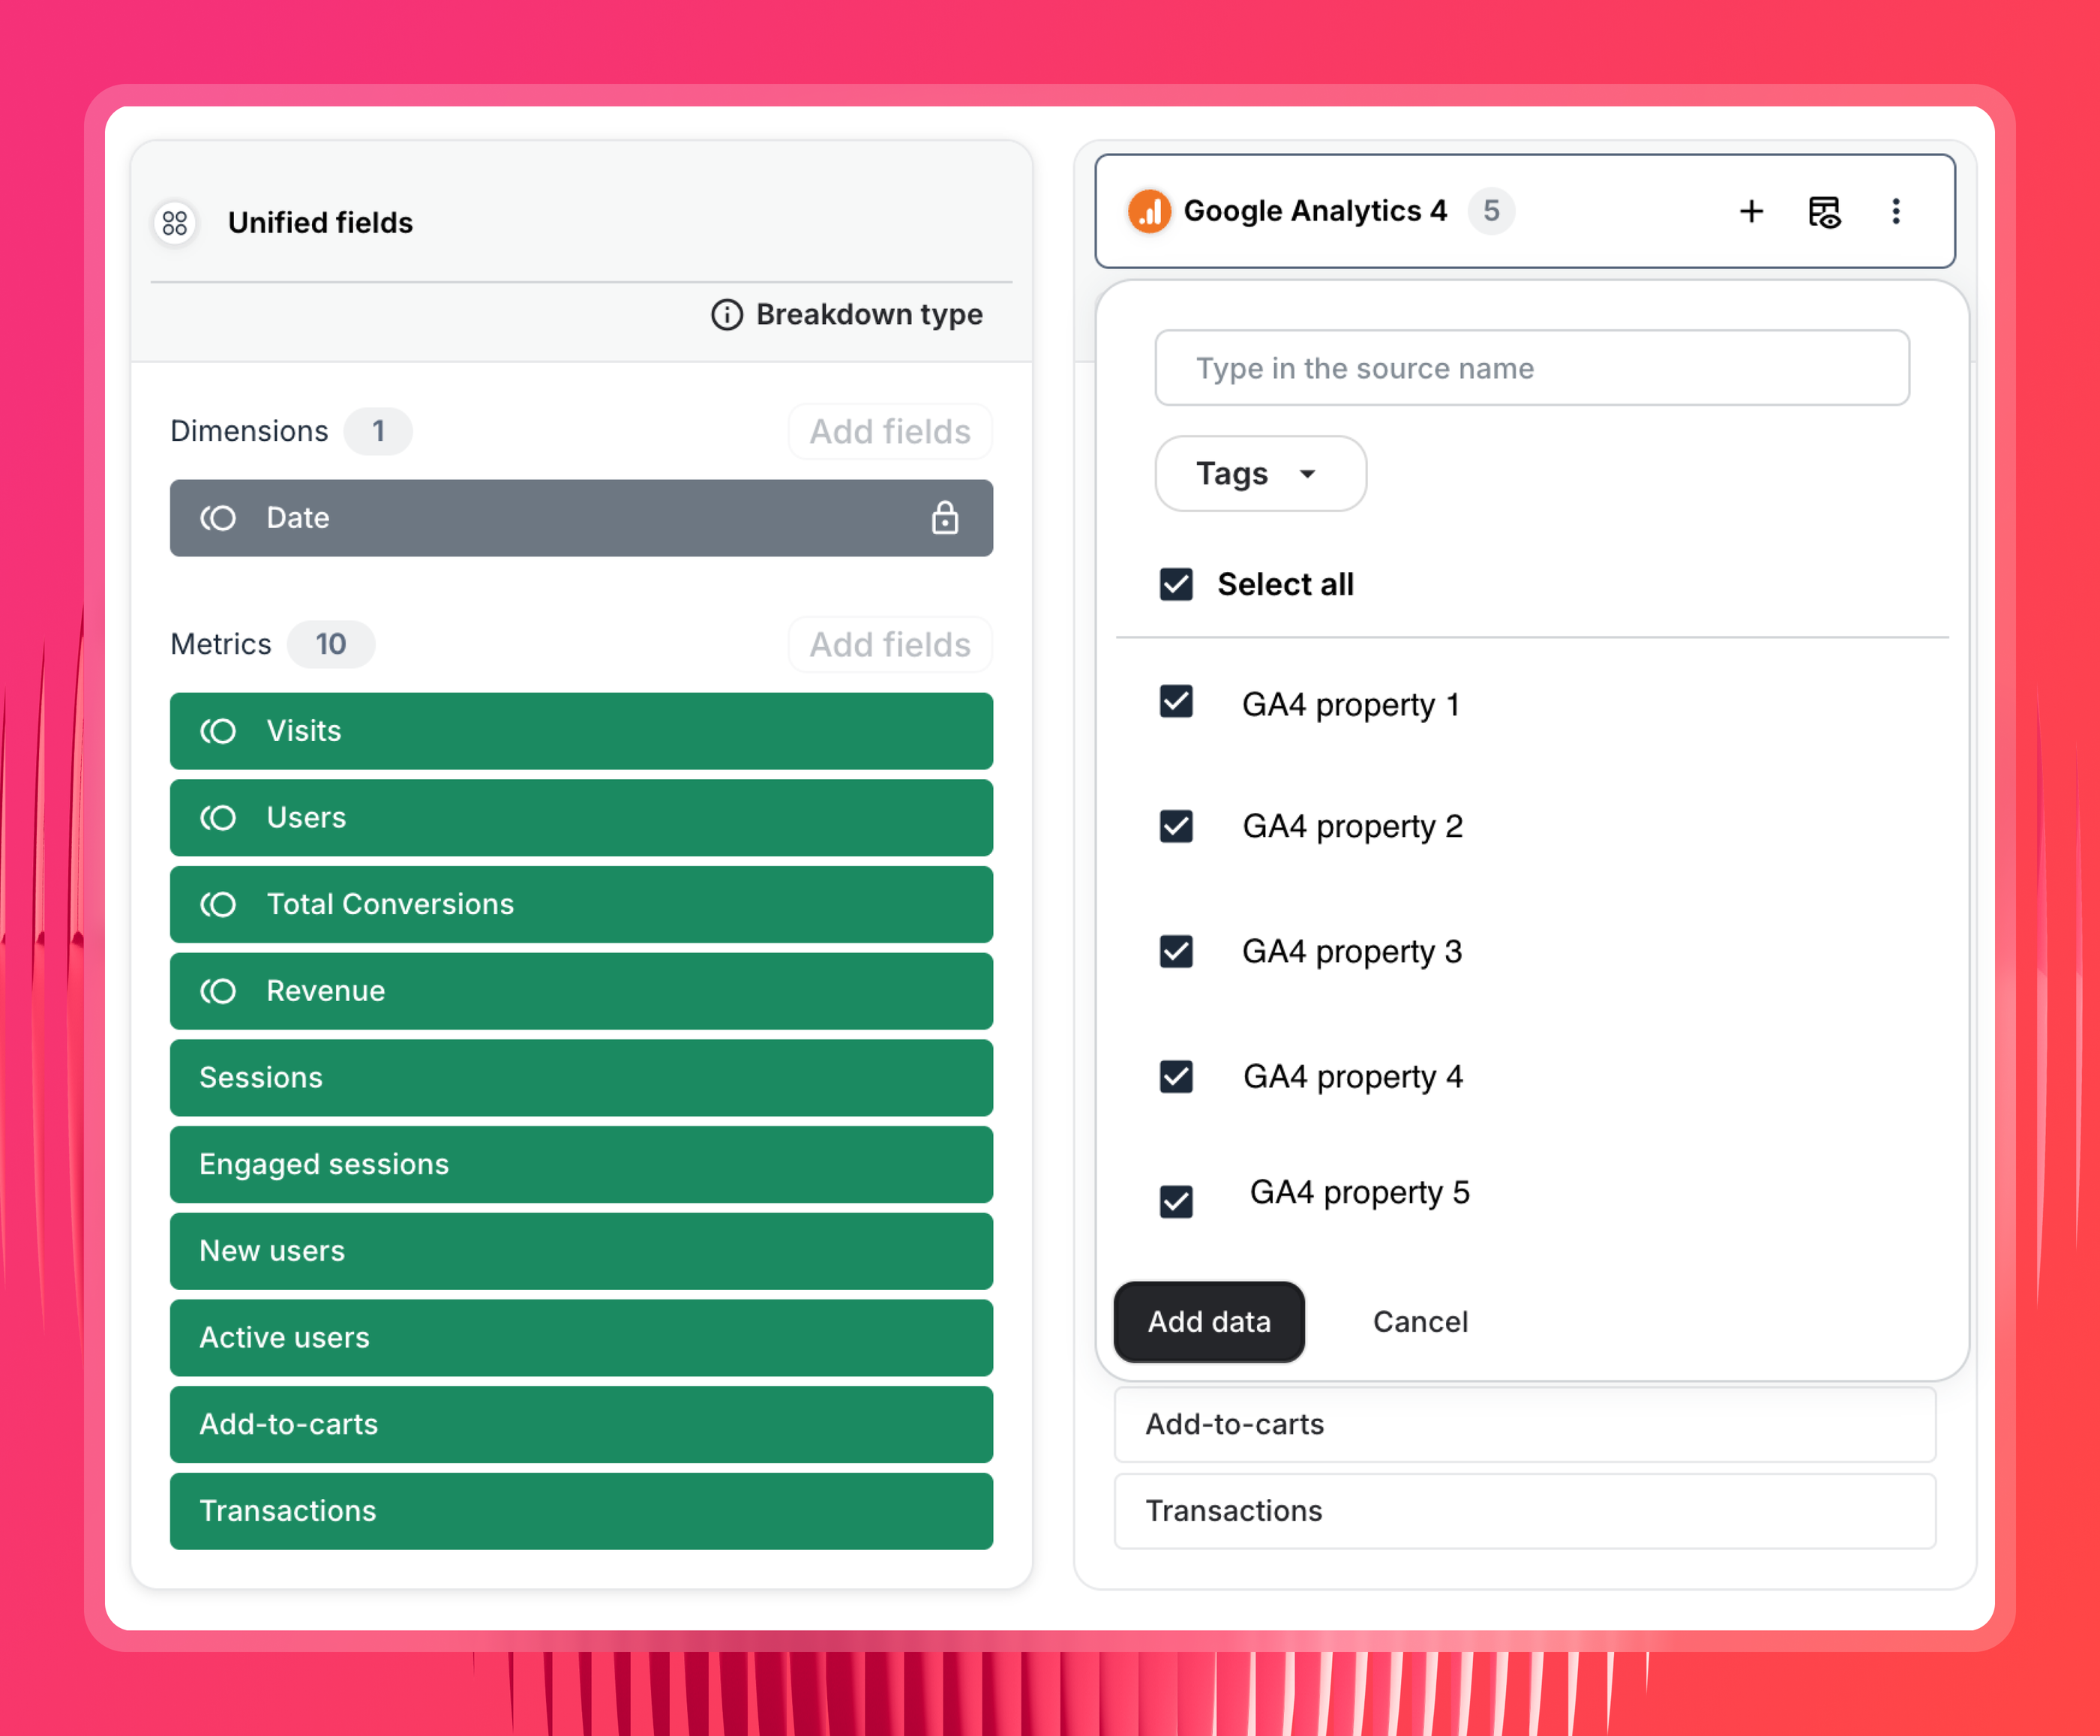
Create Source Groups to combine properties. If a client runs separate GA4 properties per region or brand, roll them into one Source Group so Claude reads them as a single source. This is also how you build a portfolio view: group the properties you want to compare so Claude can answer across all of them in one go.
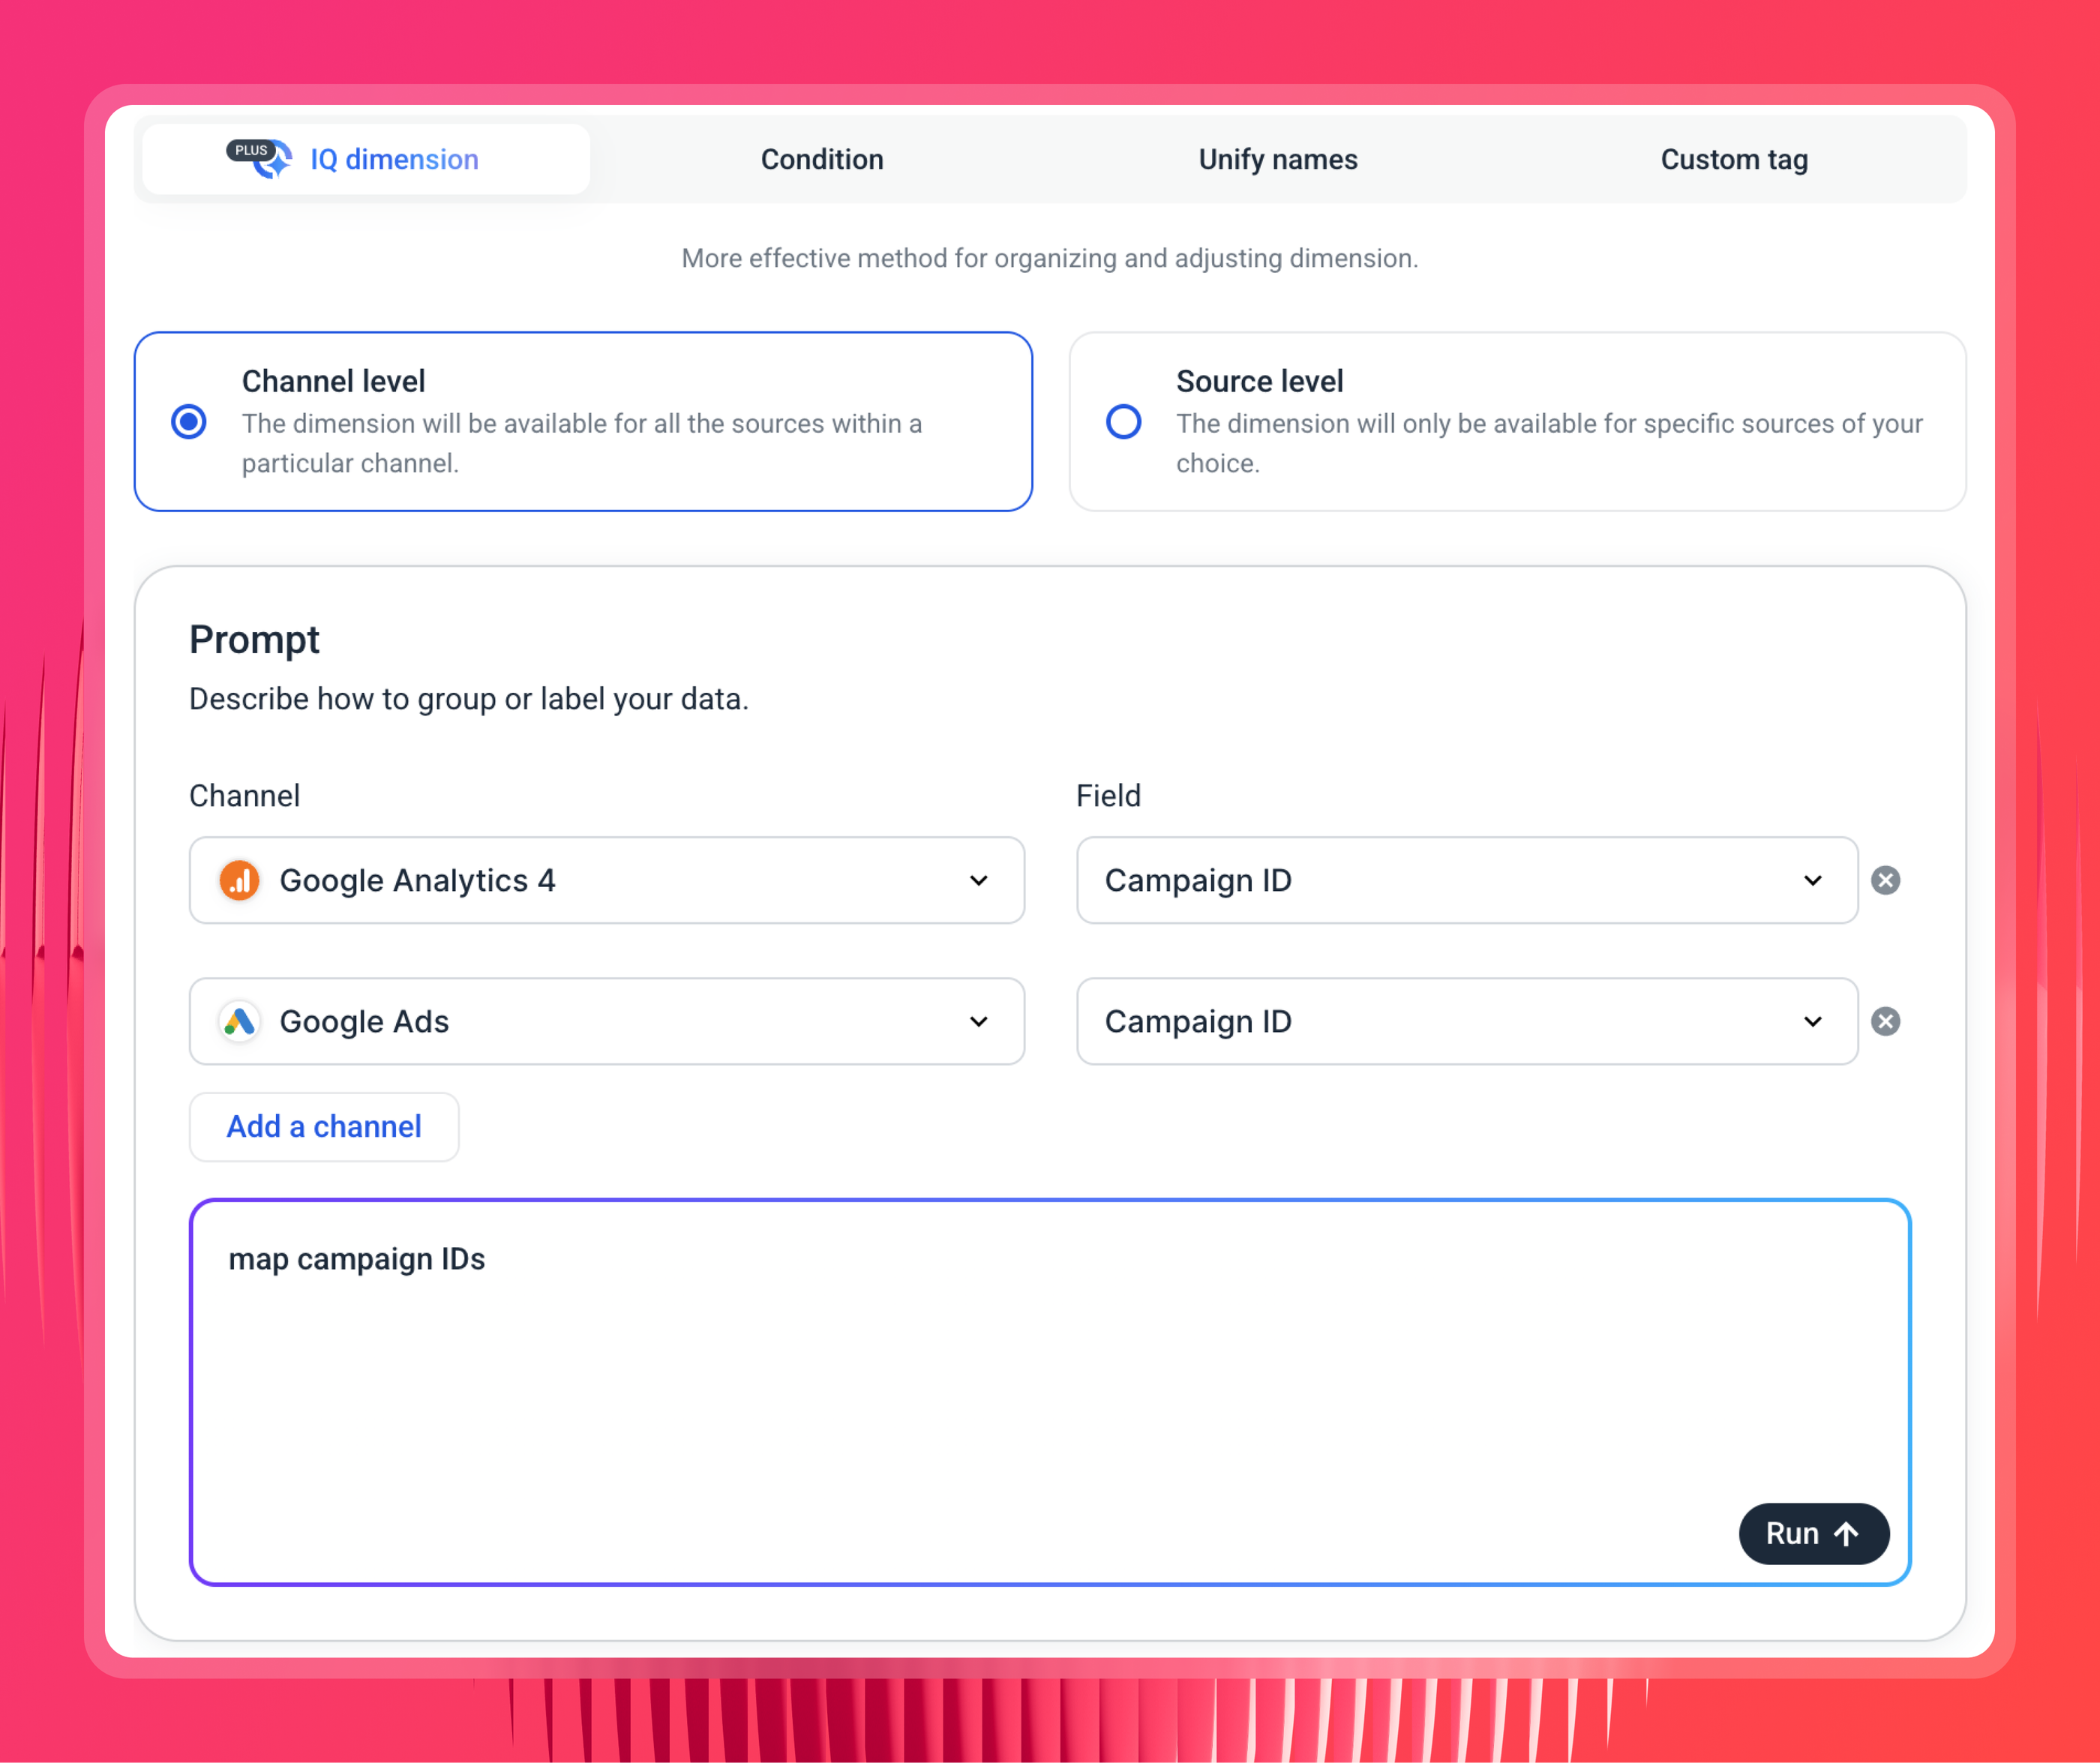
Normalize naming with custom dimensions. This is the one that makes cross-property reporting actually work. Client A calls it "Paid Search," Client B logs "google / cpc," Client C uses "01_PaidSearch." Map them to one taxonomy with a custom dimension, and "which clients grew paid traffic" finally compares like with like.
Write the rules by hand, or describe what you want and let IQ Dimensions build the logic. Without this step, querying across properties just surfaces the inconsistency.
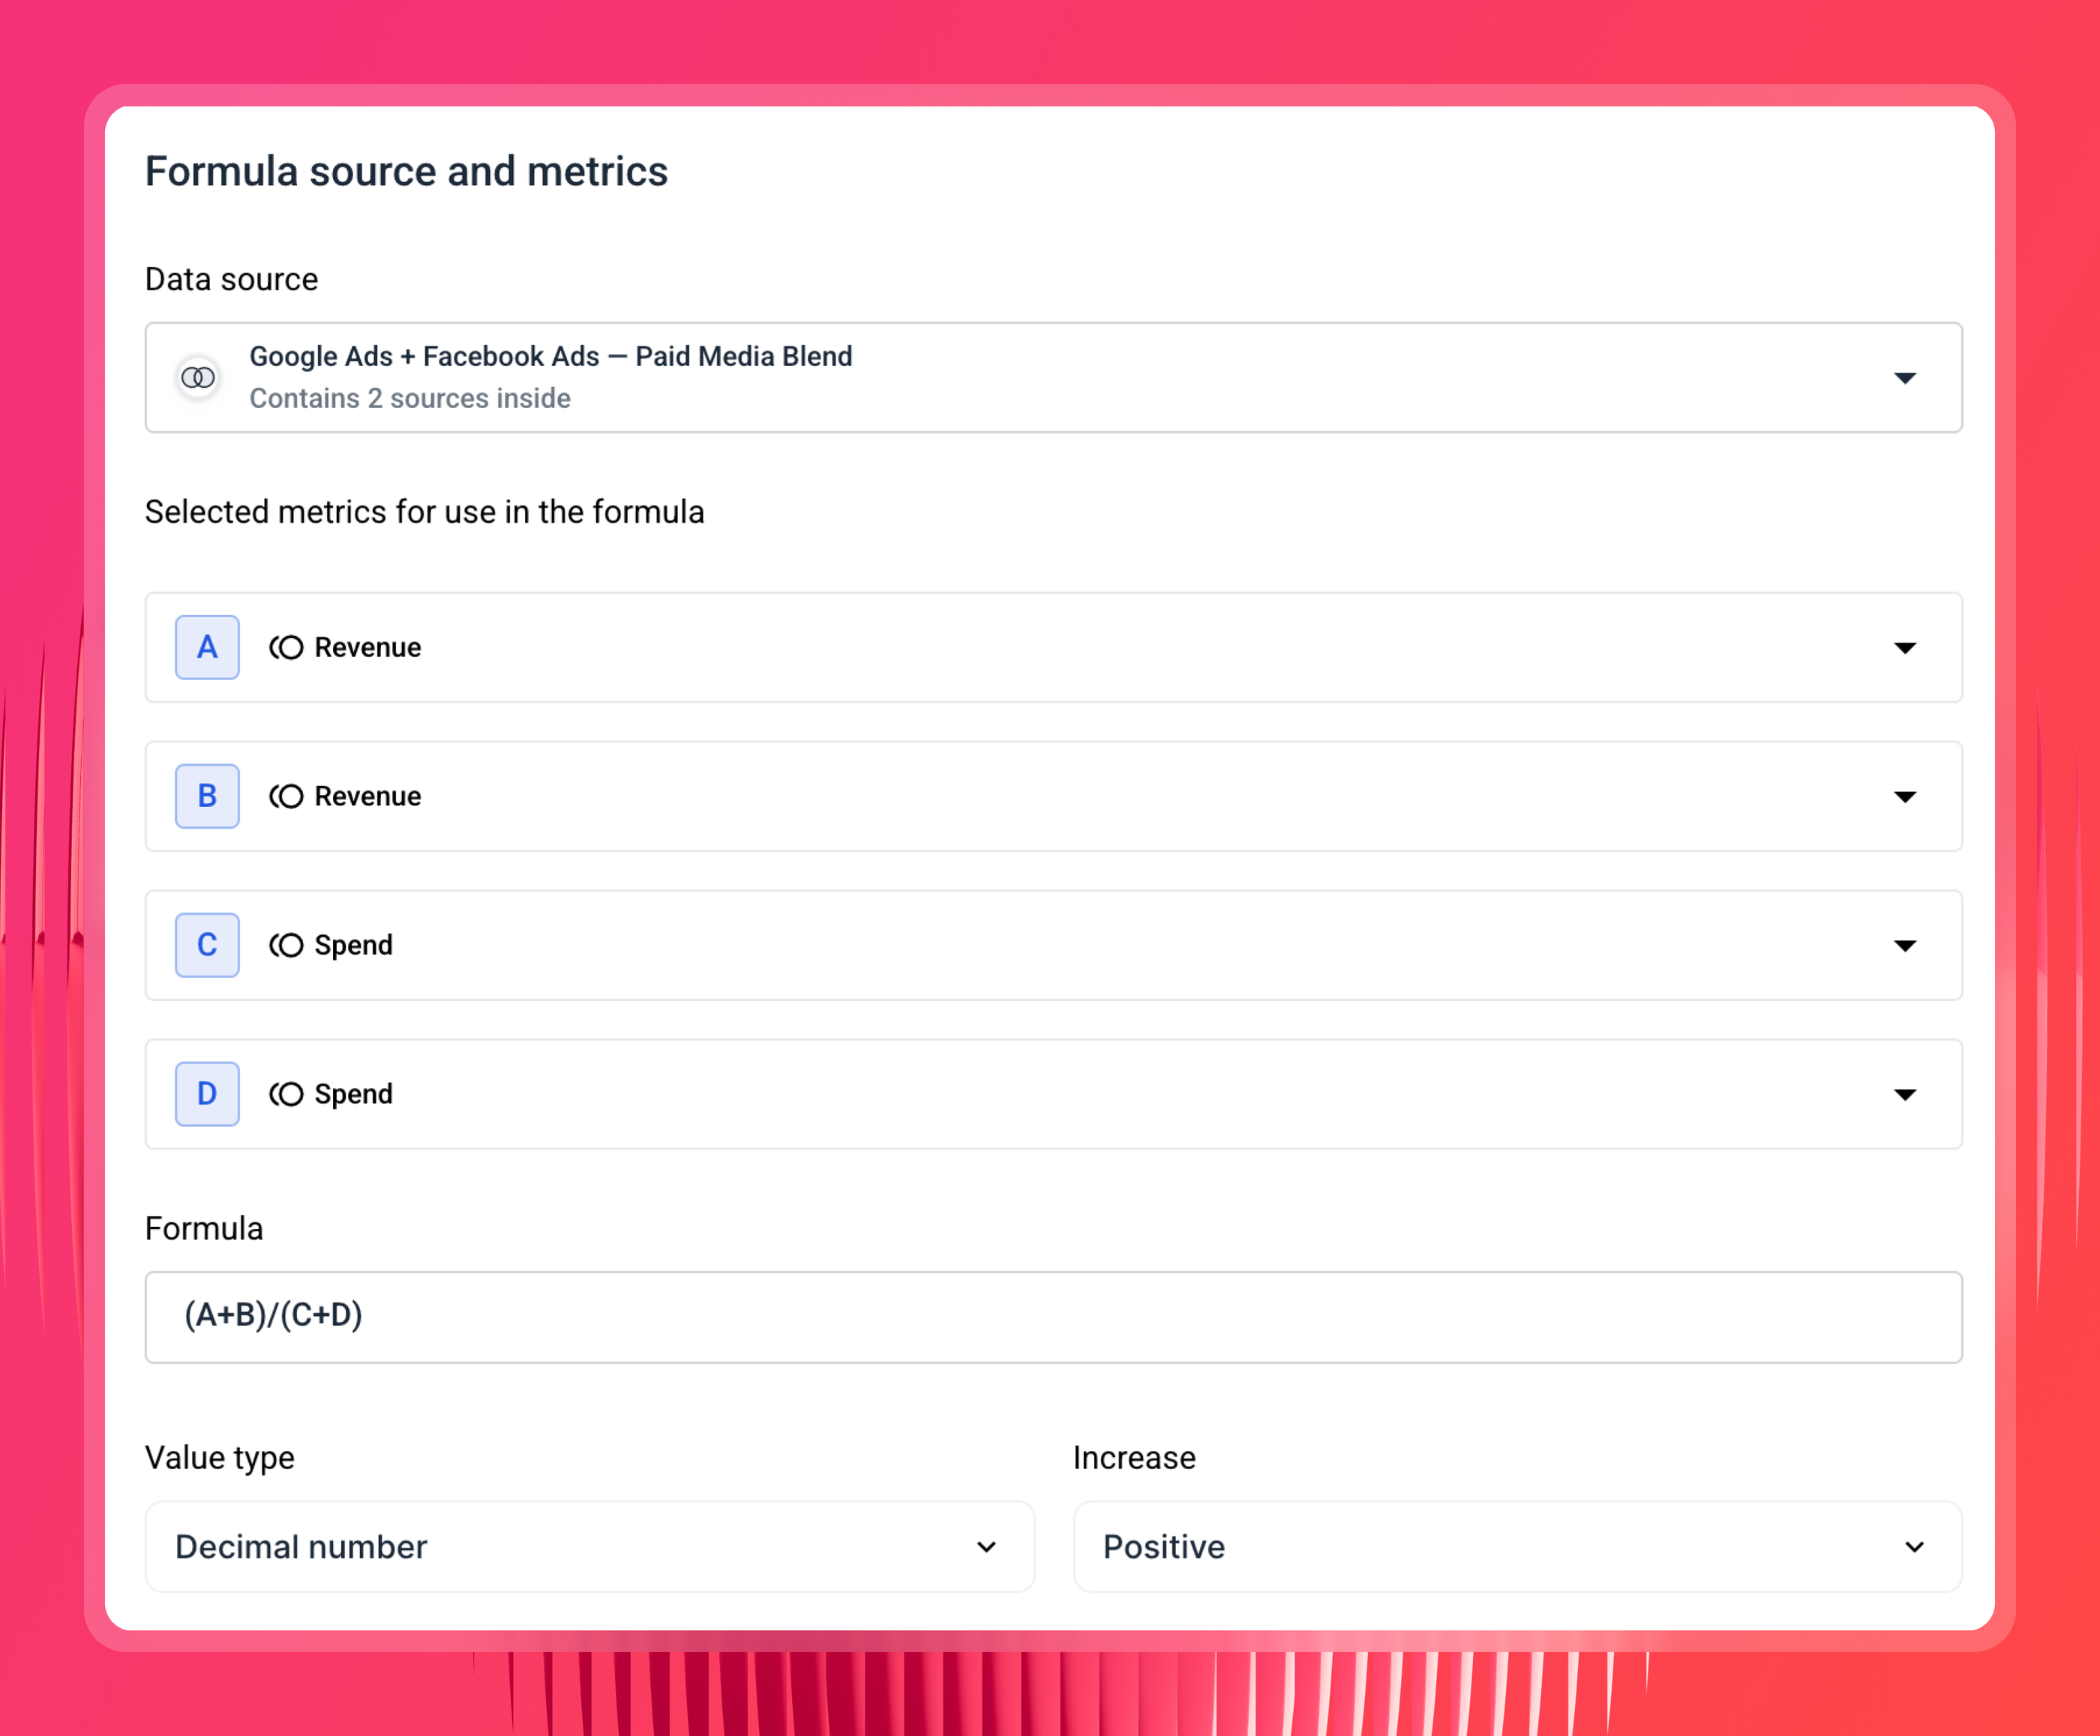
Build Blends to combine GA4 with Google Ads. Blend your GA4 source with your Google Ads source on a shared key like date or campaign, and now sessions and conversions from GA4 sit next to spend and clicks from Google Ads in one model. Ask Claude "which Google Ads campaigns drove the most GA4 conversions last month" and the answer is pre-joined, not stitched together live in the chat.
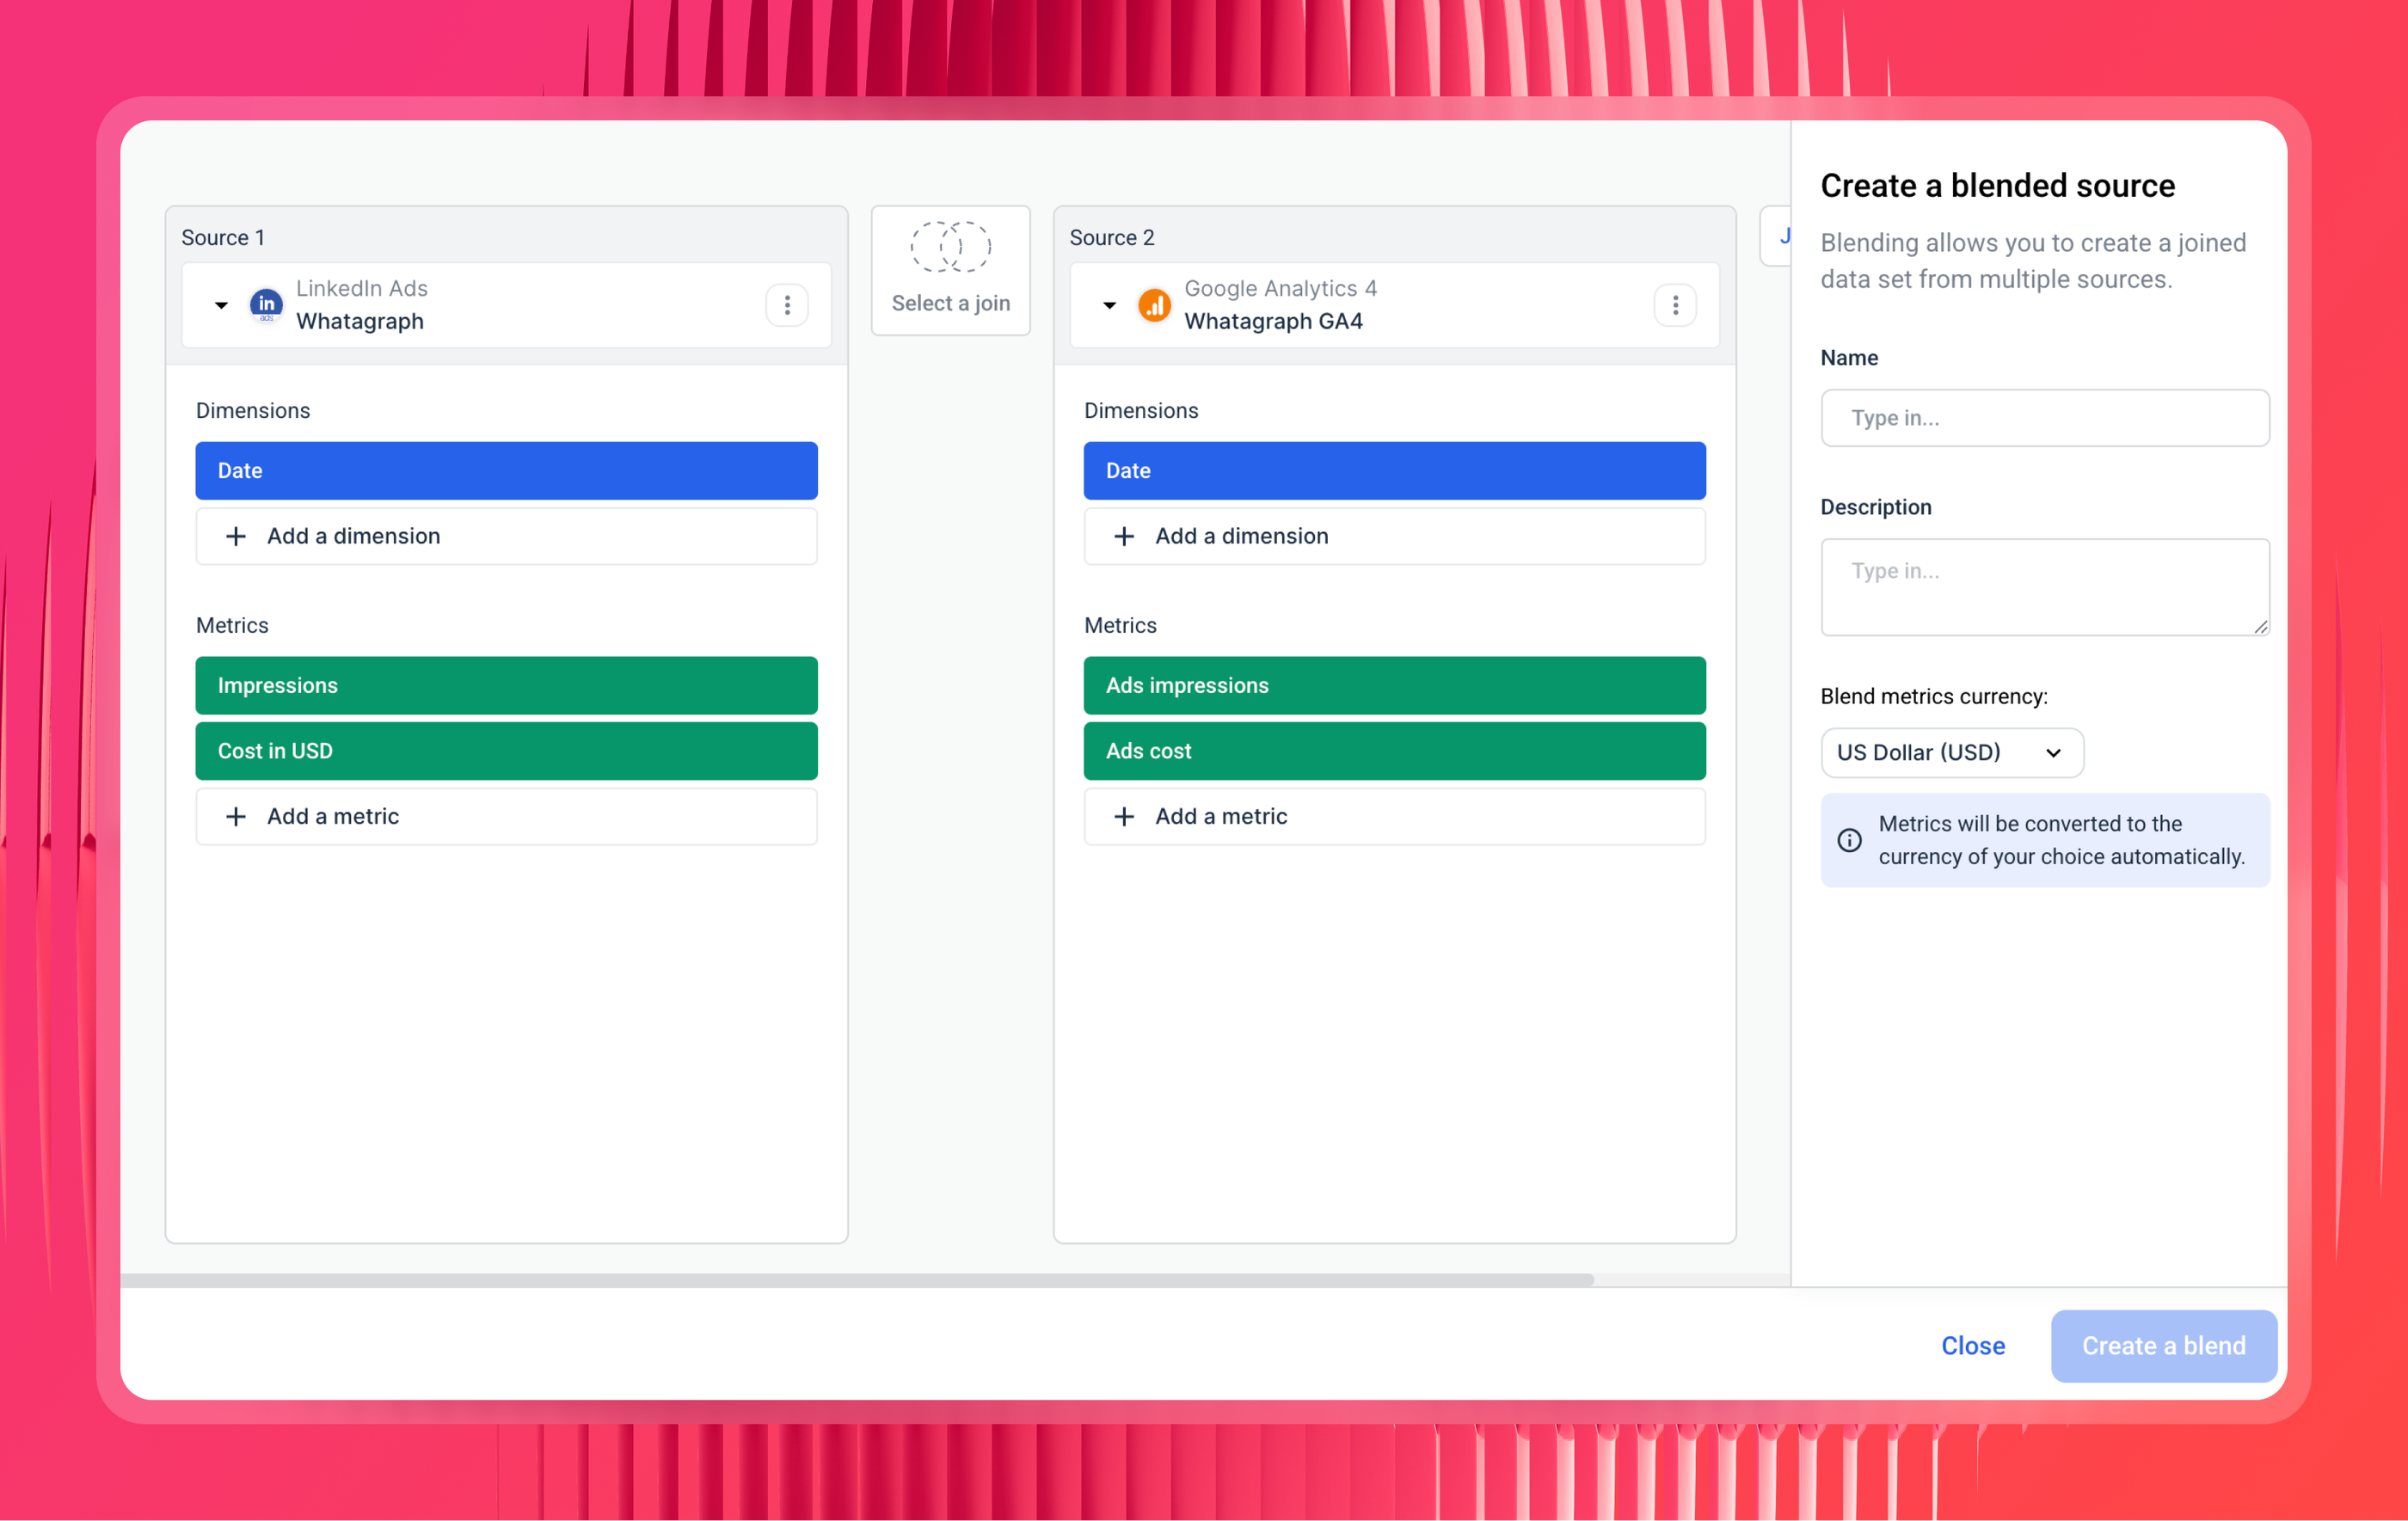
Define custom metrics across those sources. Once GA4 and Google Ads are blended, you can define a metric that spans both, like blended ROAS using Google Ads spend against GA4 revenue, or true cost per conversion using Google Ads cost over GA4 key events. Define it once and Claude uses that exact formula every time, instead of guessing at the math.
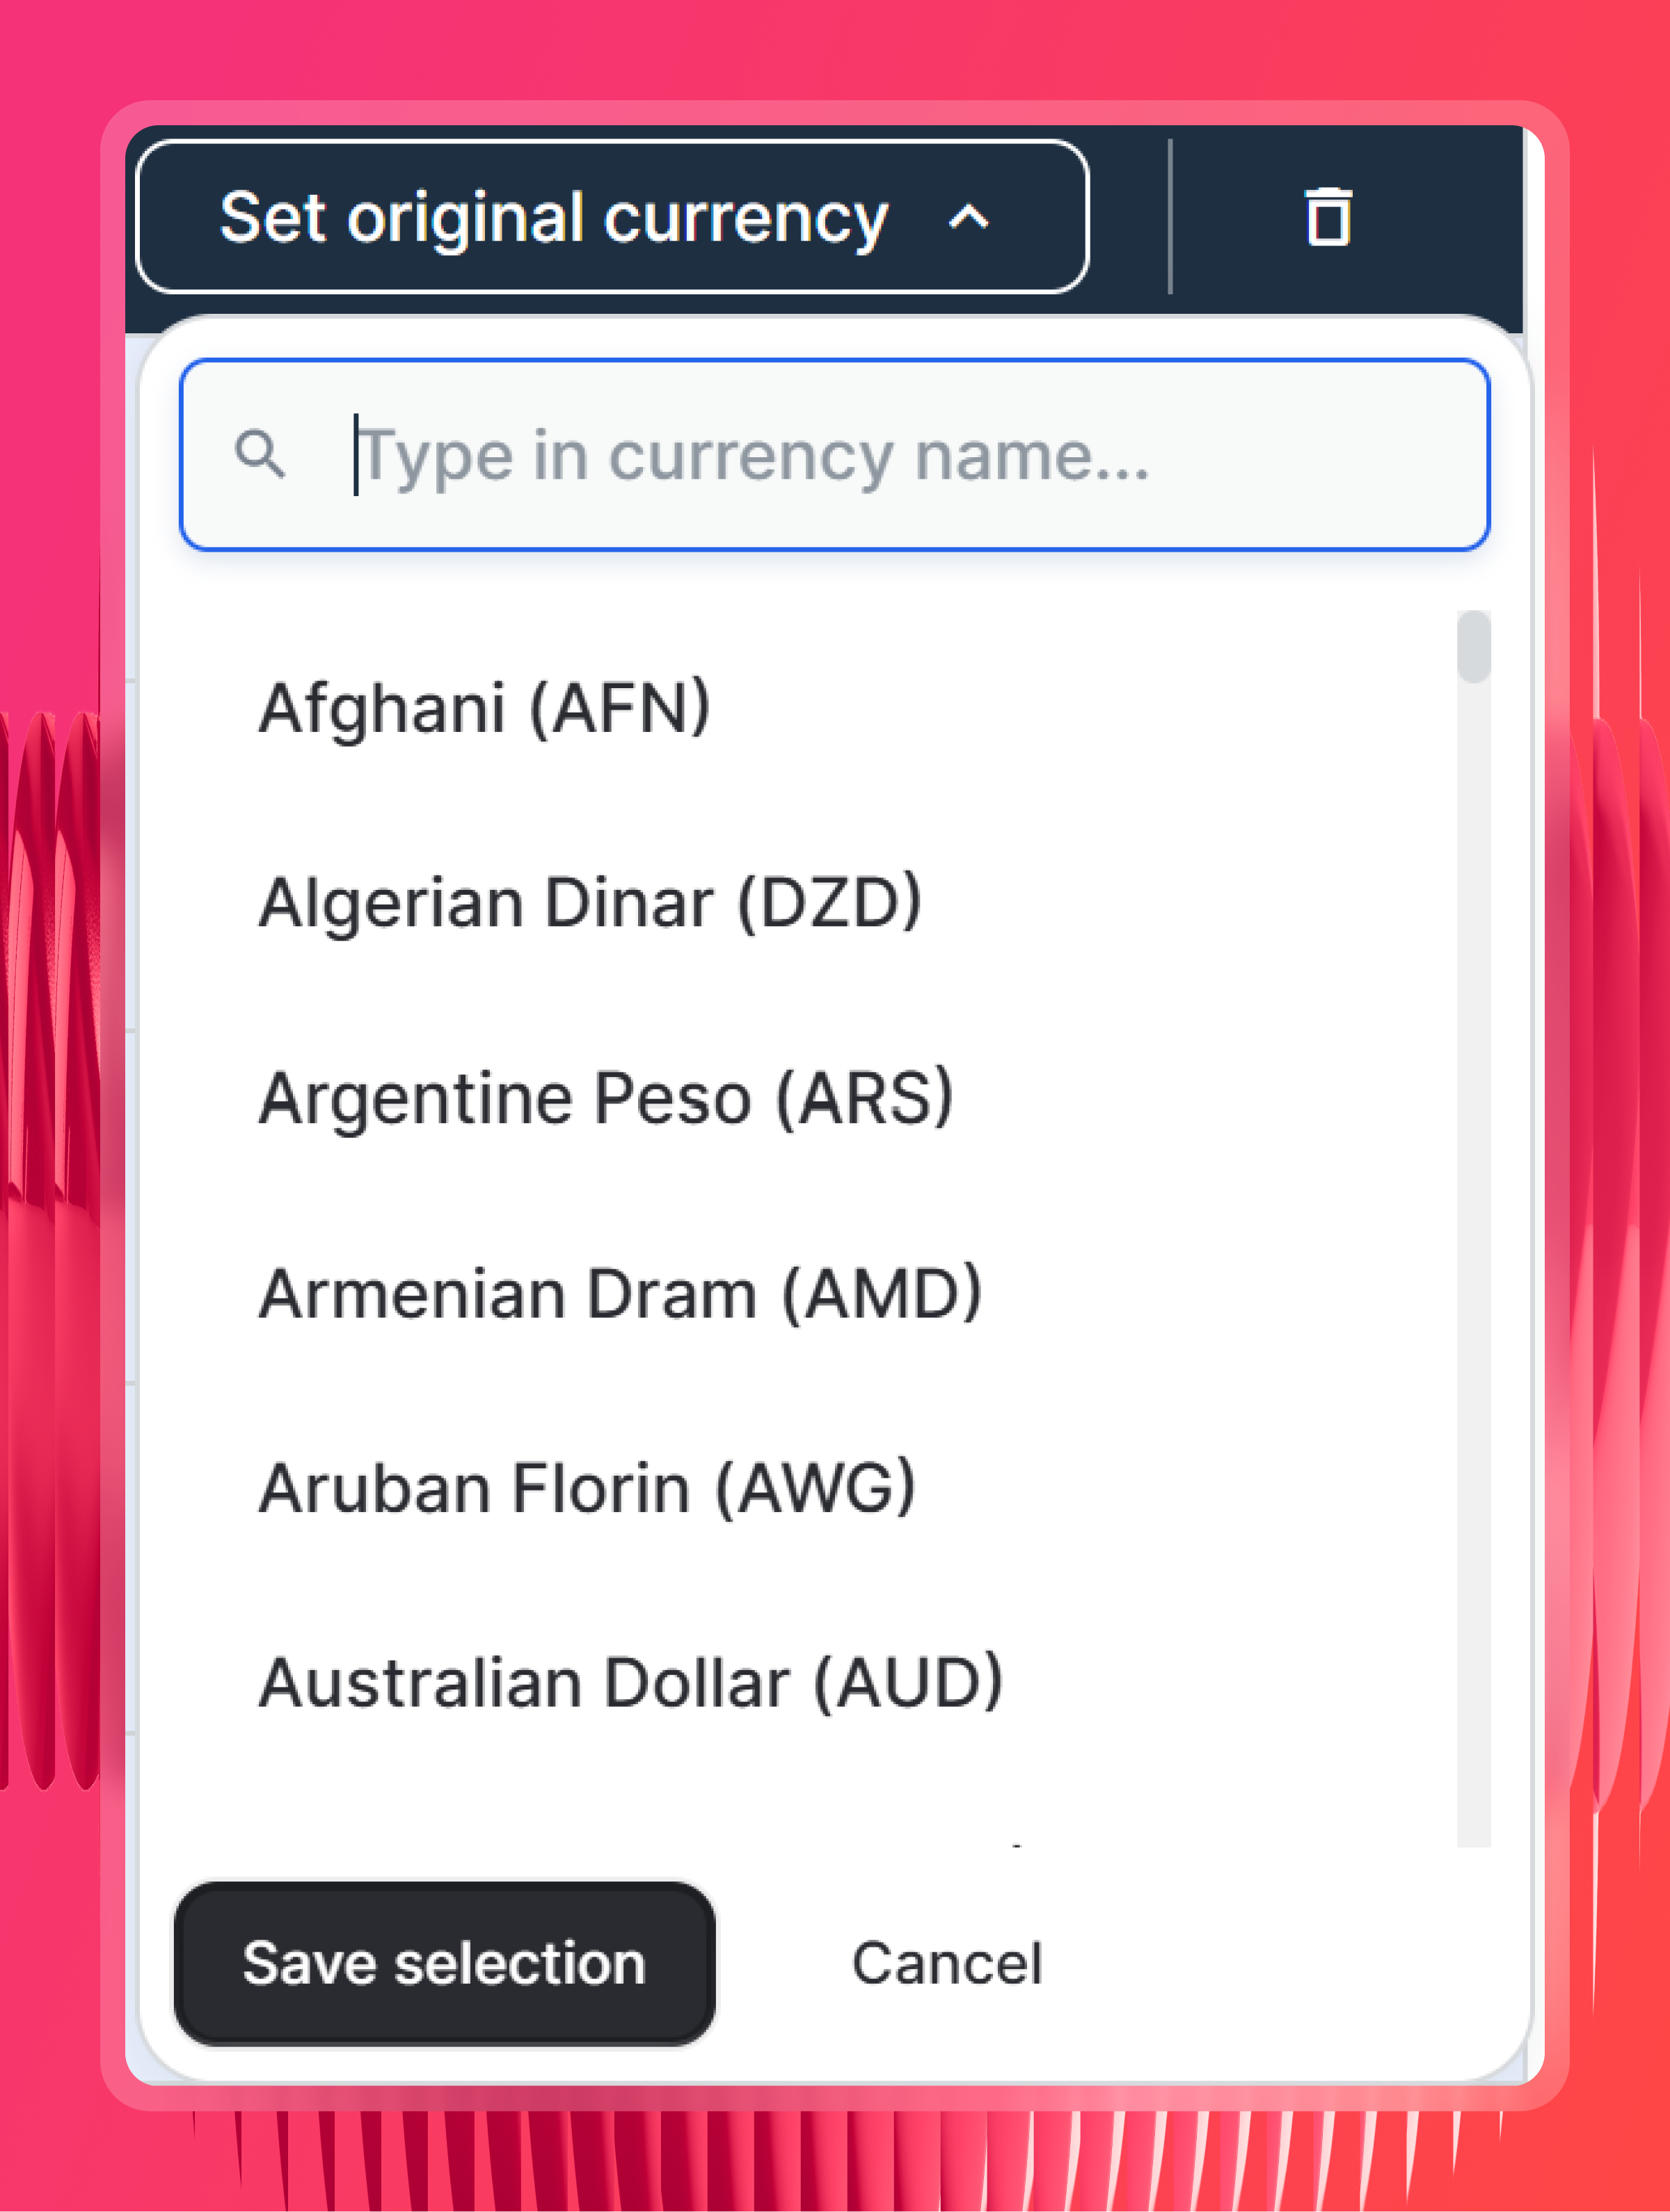
Check your currency settings. Whatagraph detects each source's original currency automatically, so cross-market traffic and revenue line up on their own. In the rare case it can't, you set it manually.
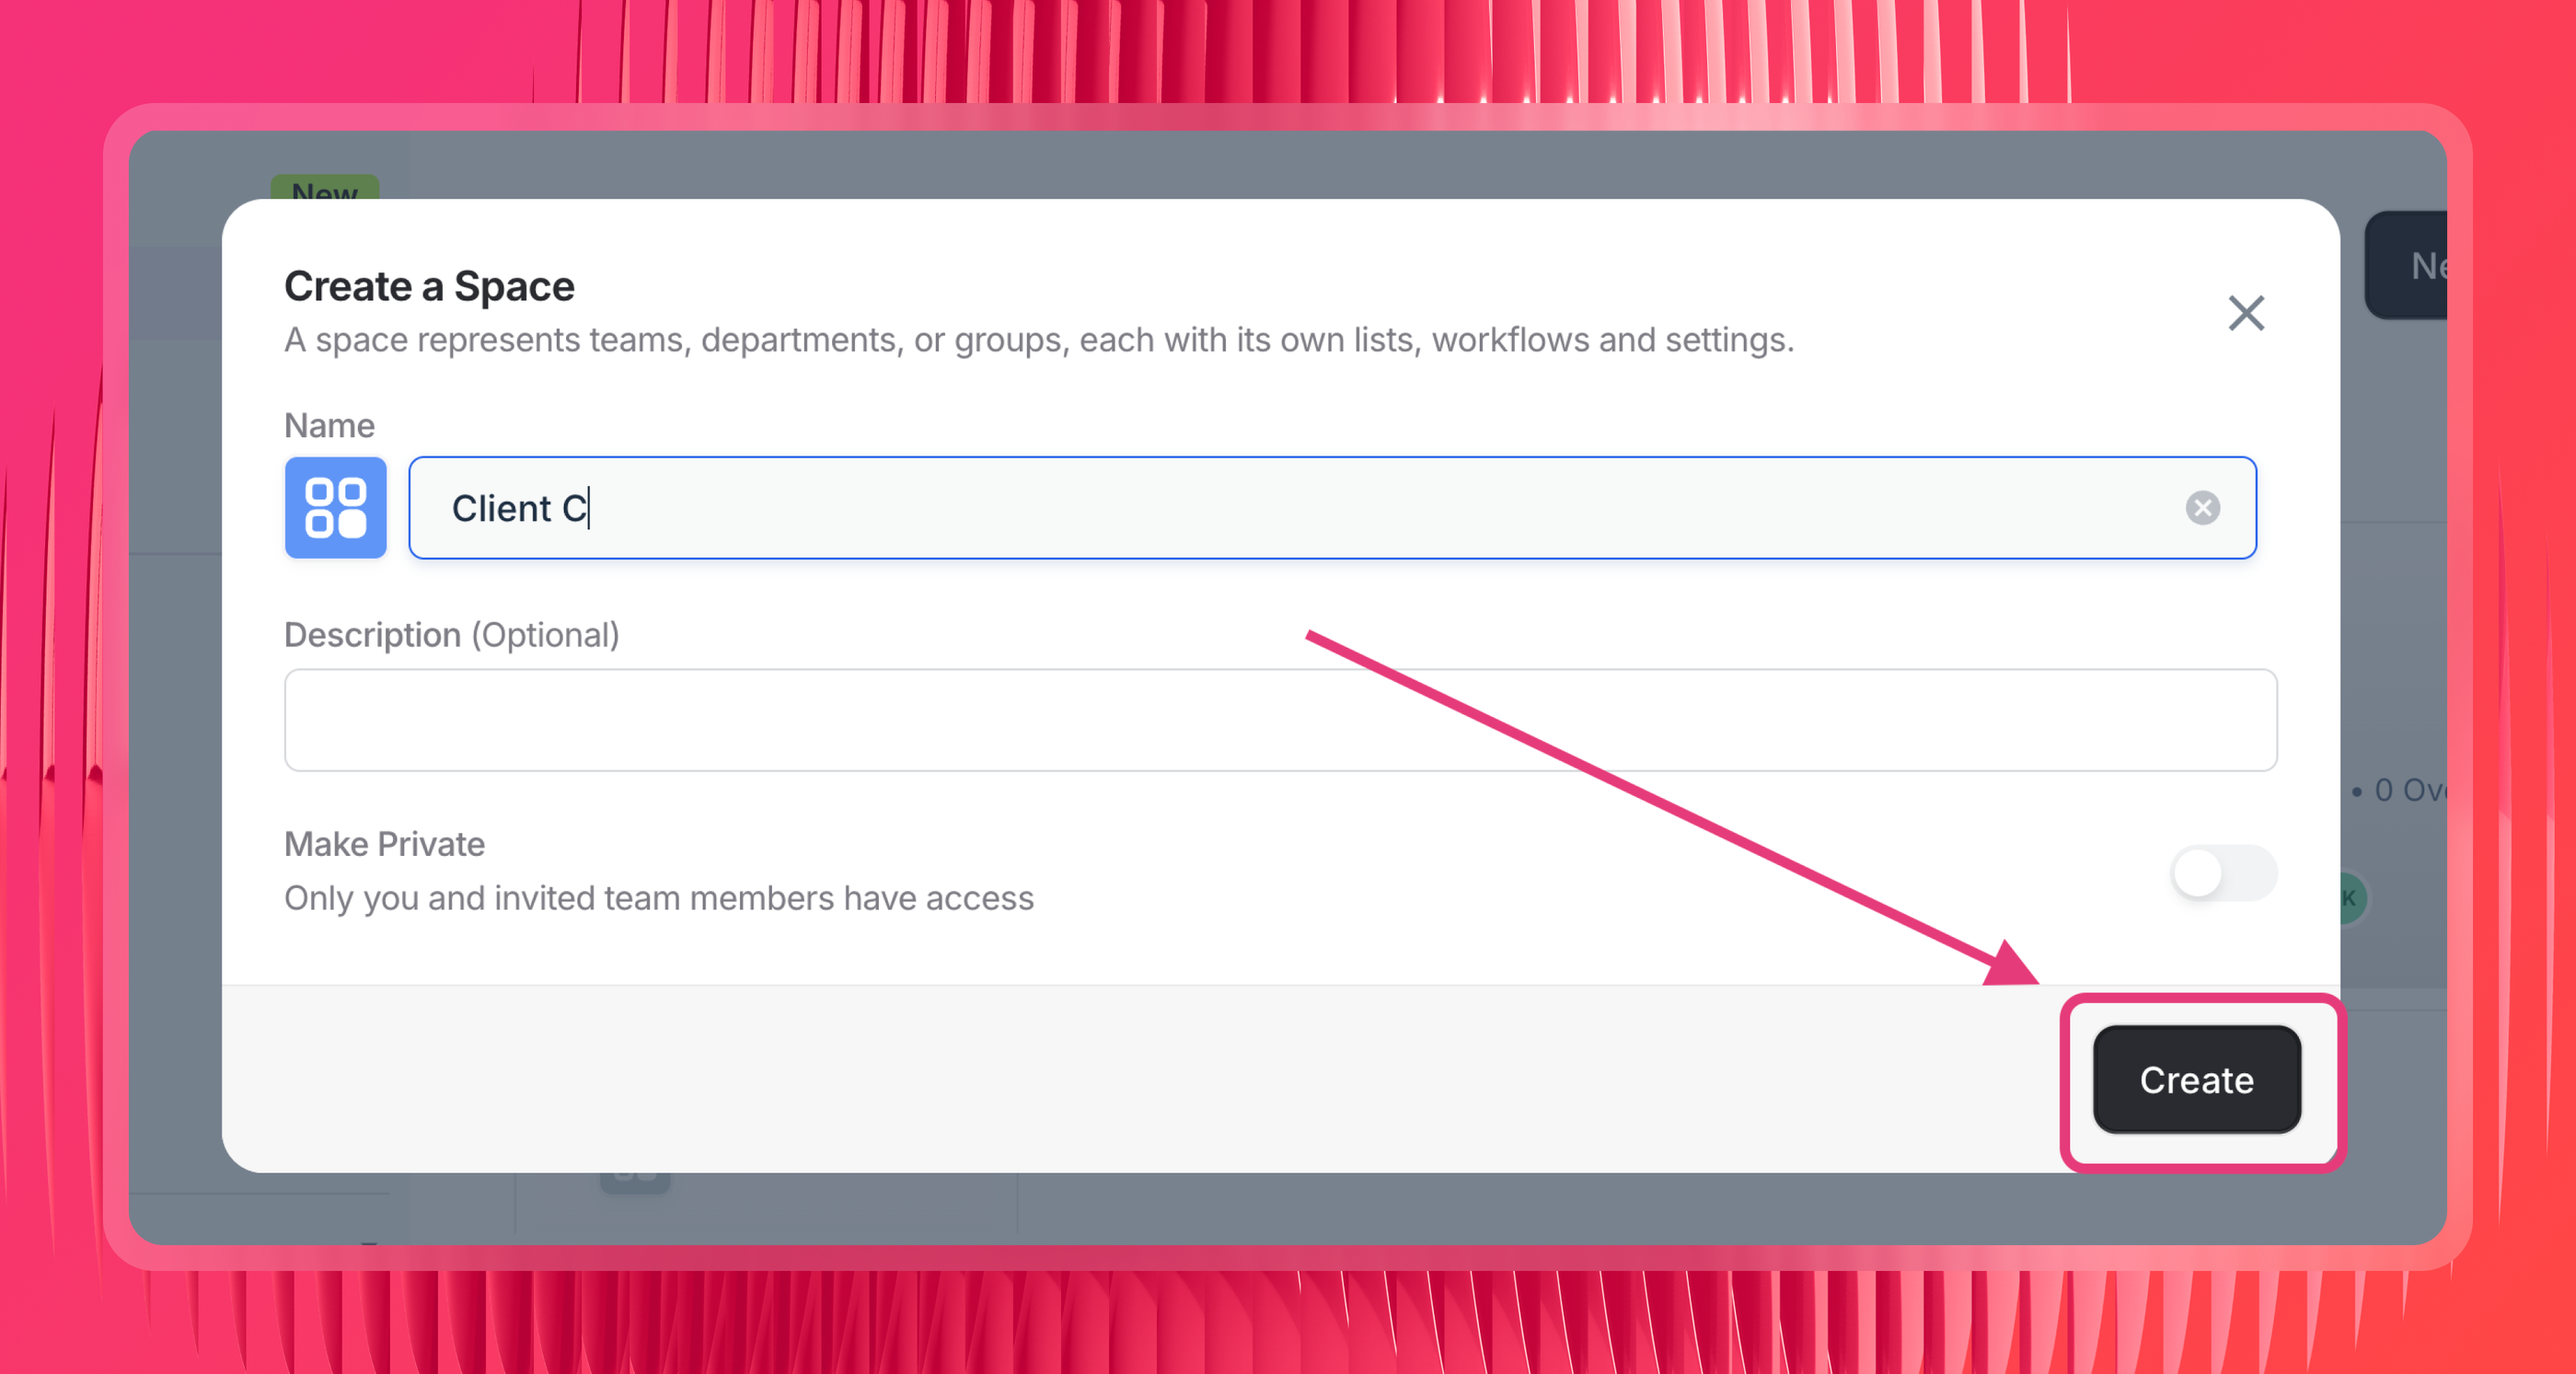
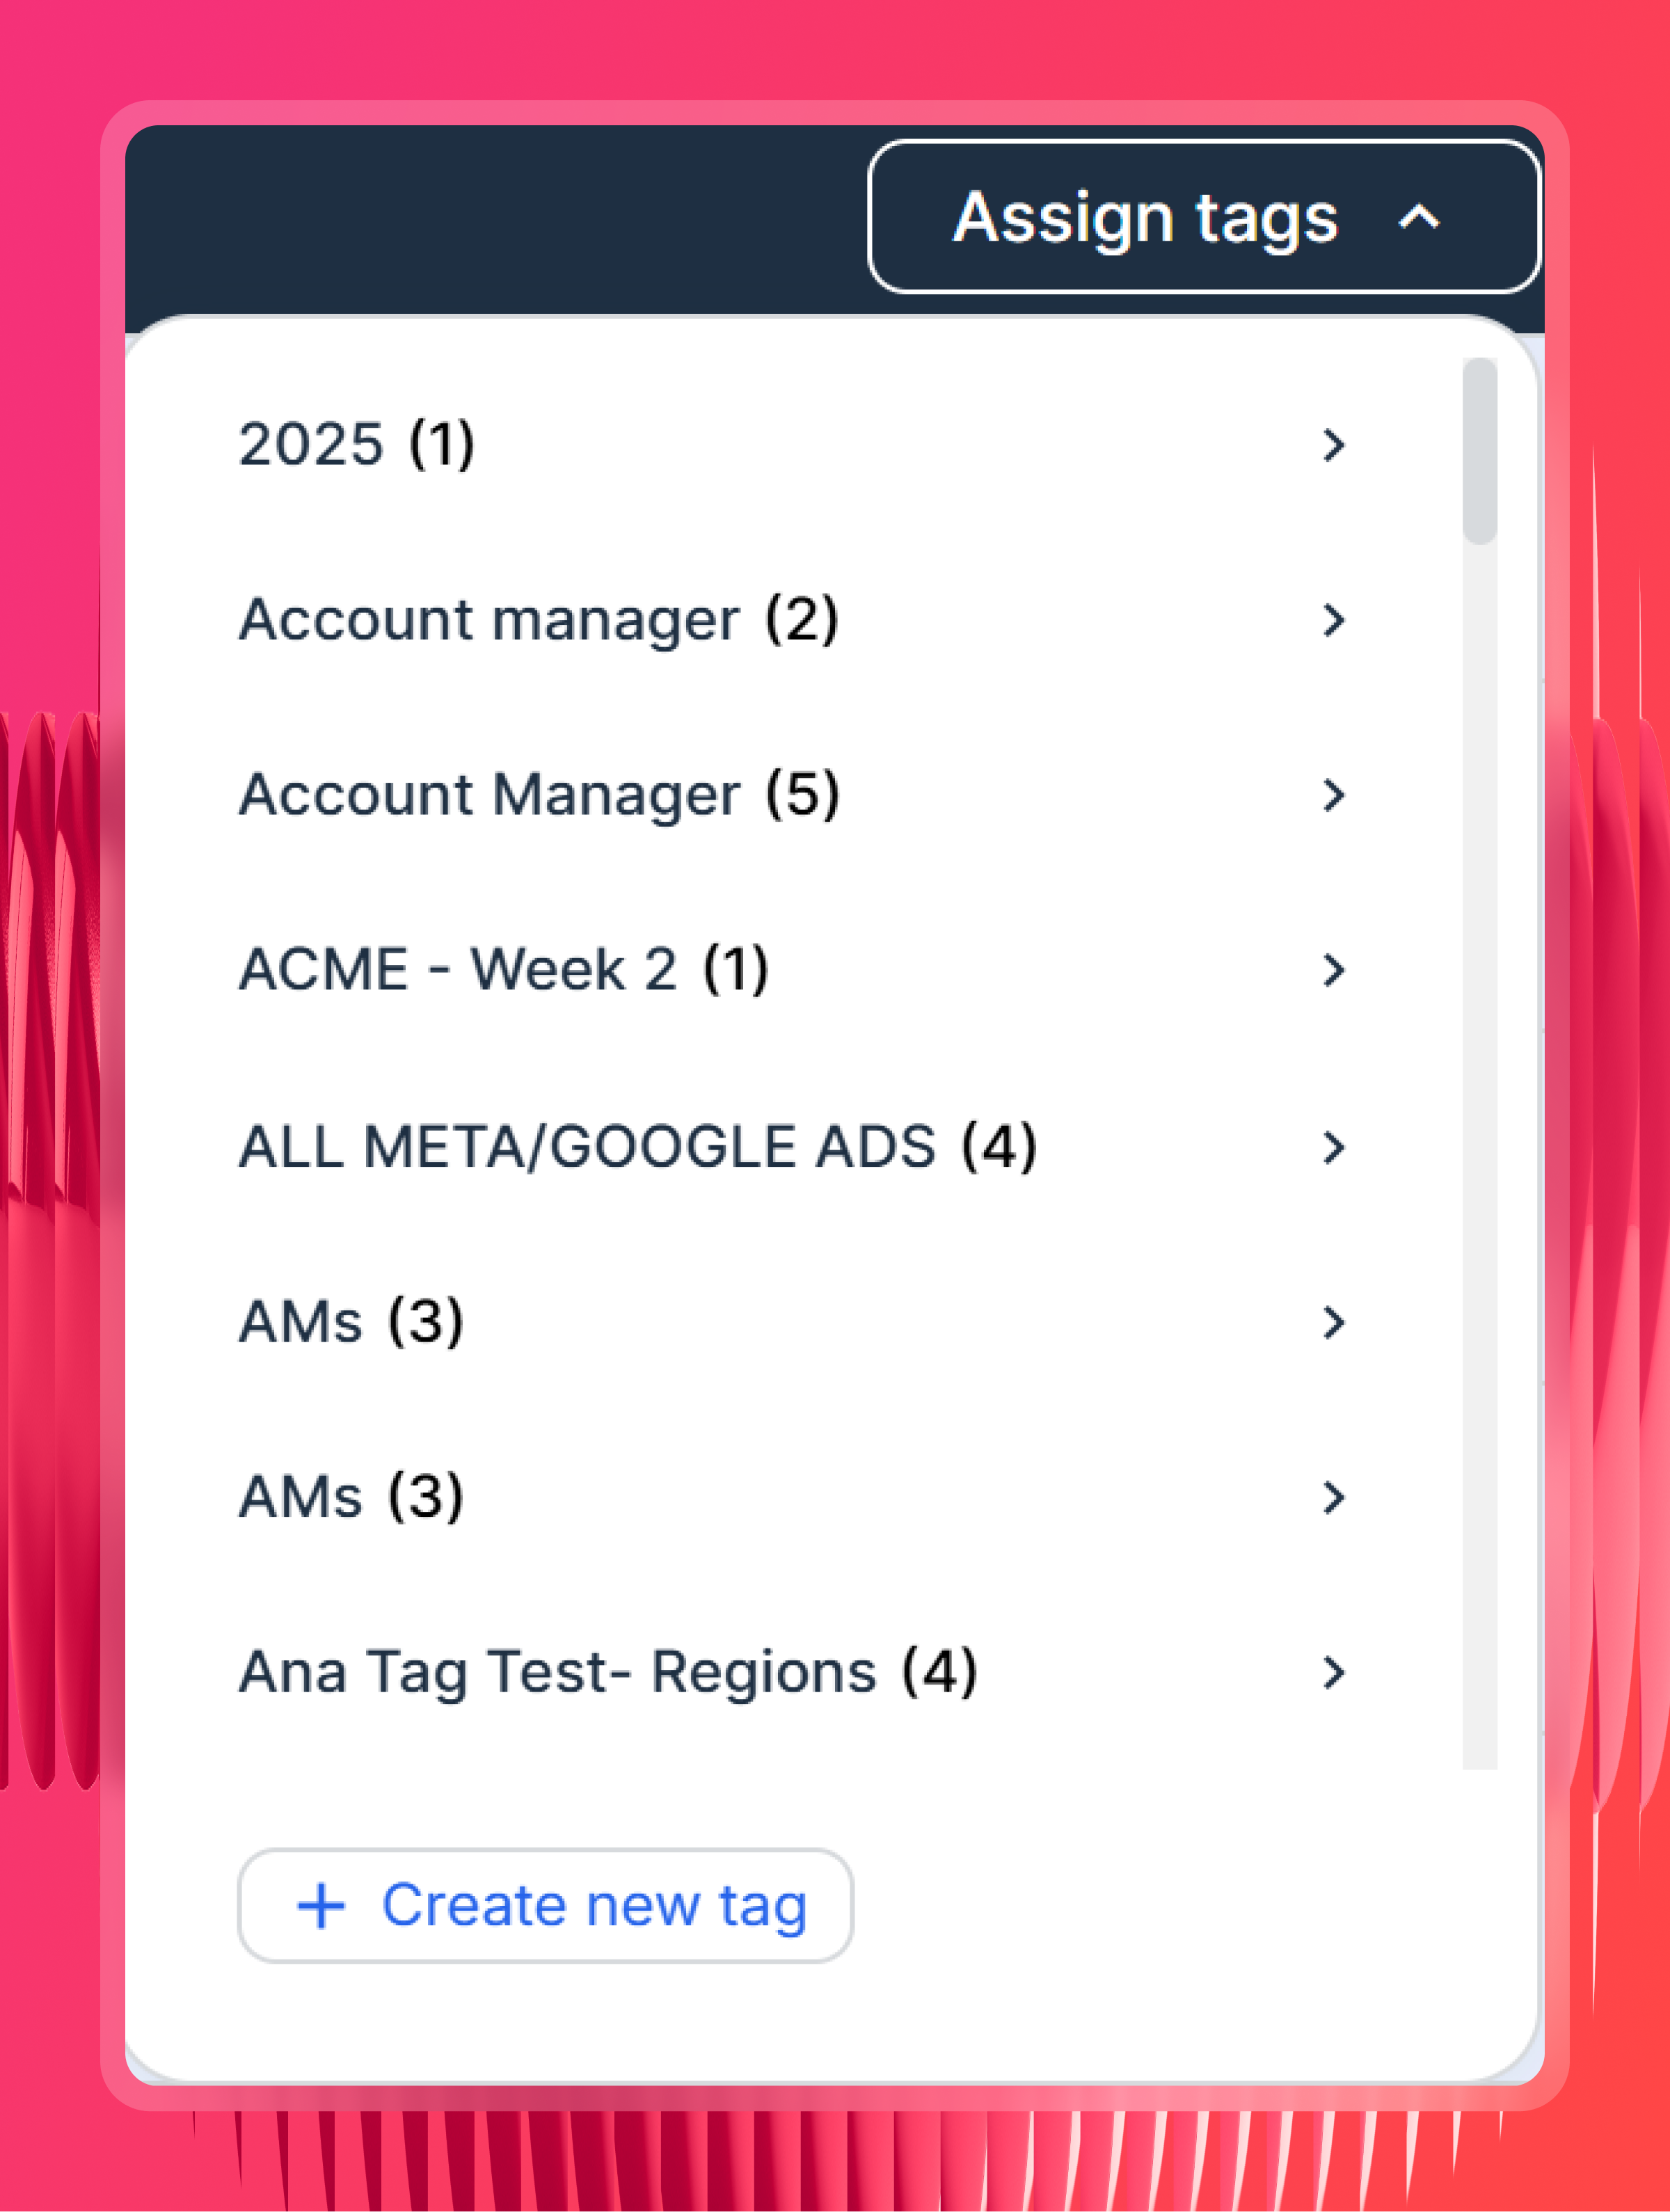
Organize your sources and reports into Spaces by client or location. Spaces are Whatagraph's folders, one per client or location, and they hold both the data sources and the reports for that account. Claude scopes its queries by Space, so this keeps a dozen properties from bleeding into each other. Ask "how did this client do" and Claude looks inside that one folder instead of returning a blur of everyone's data.
Tag your sources. Label them by client, region, or account manager, then ask Claude to filter by a tag instead of spelling out which sources to include every time.
Optional, but the single best habit for reliable answers: build a report first, then point Claude at it. This one comes straight from our Product Manager, Laurynas Arminas. Put the metrics that matter into one report, then reference that report when you query.
As he explains it, “the numbers in the report will be reliable, because not much can break in there.”
For anything recurring, like a daily traffic check across clients, a prompt such as "summarize sessions and conversions across all properties last month from Report [name]" gives you a stable answer pulled from a fixed reference, while Claude can still dig into the raw data when you want to explore something one-off.
The more of this you do upfront, the closer Claude's answers land to what you'd see if you checked by hand.
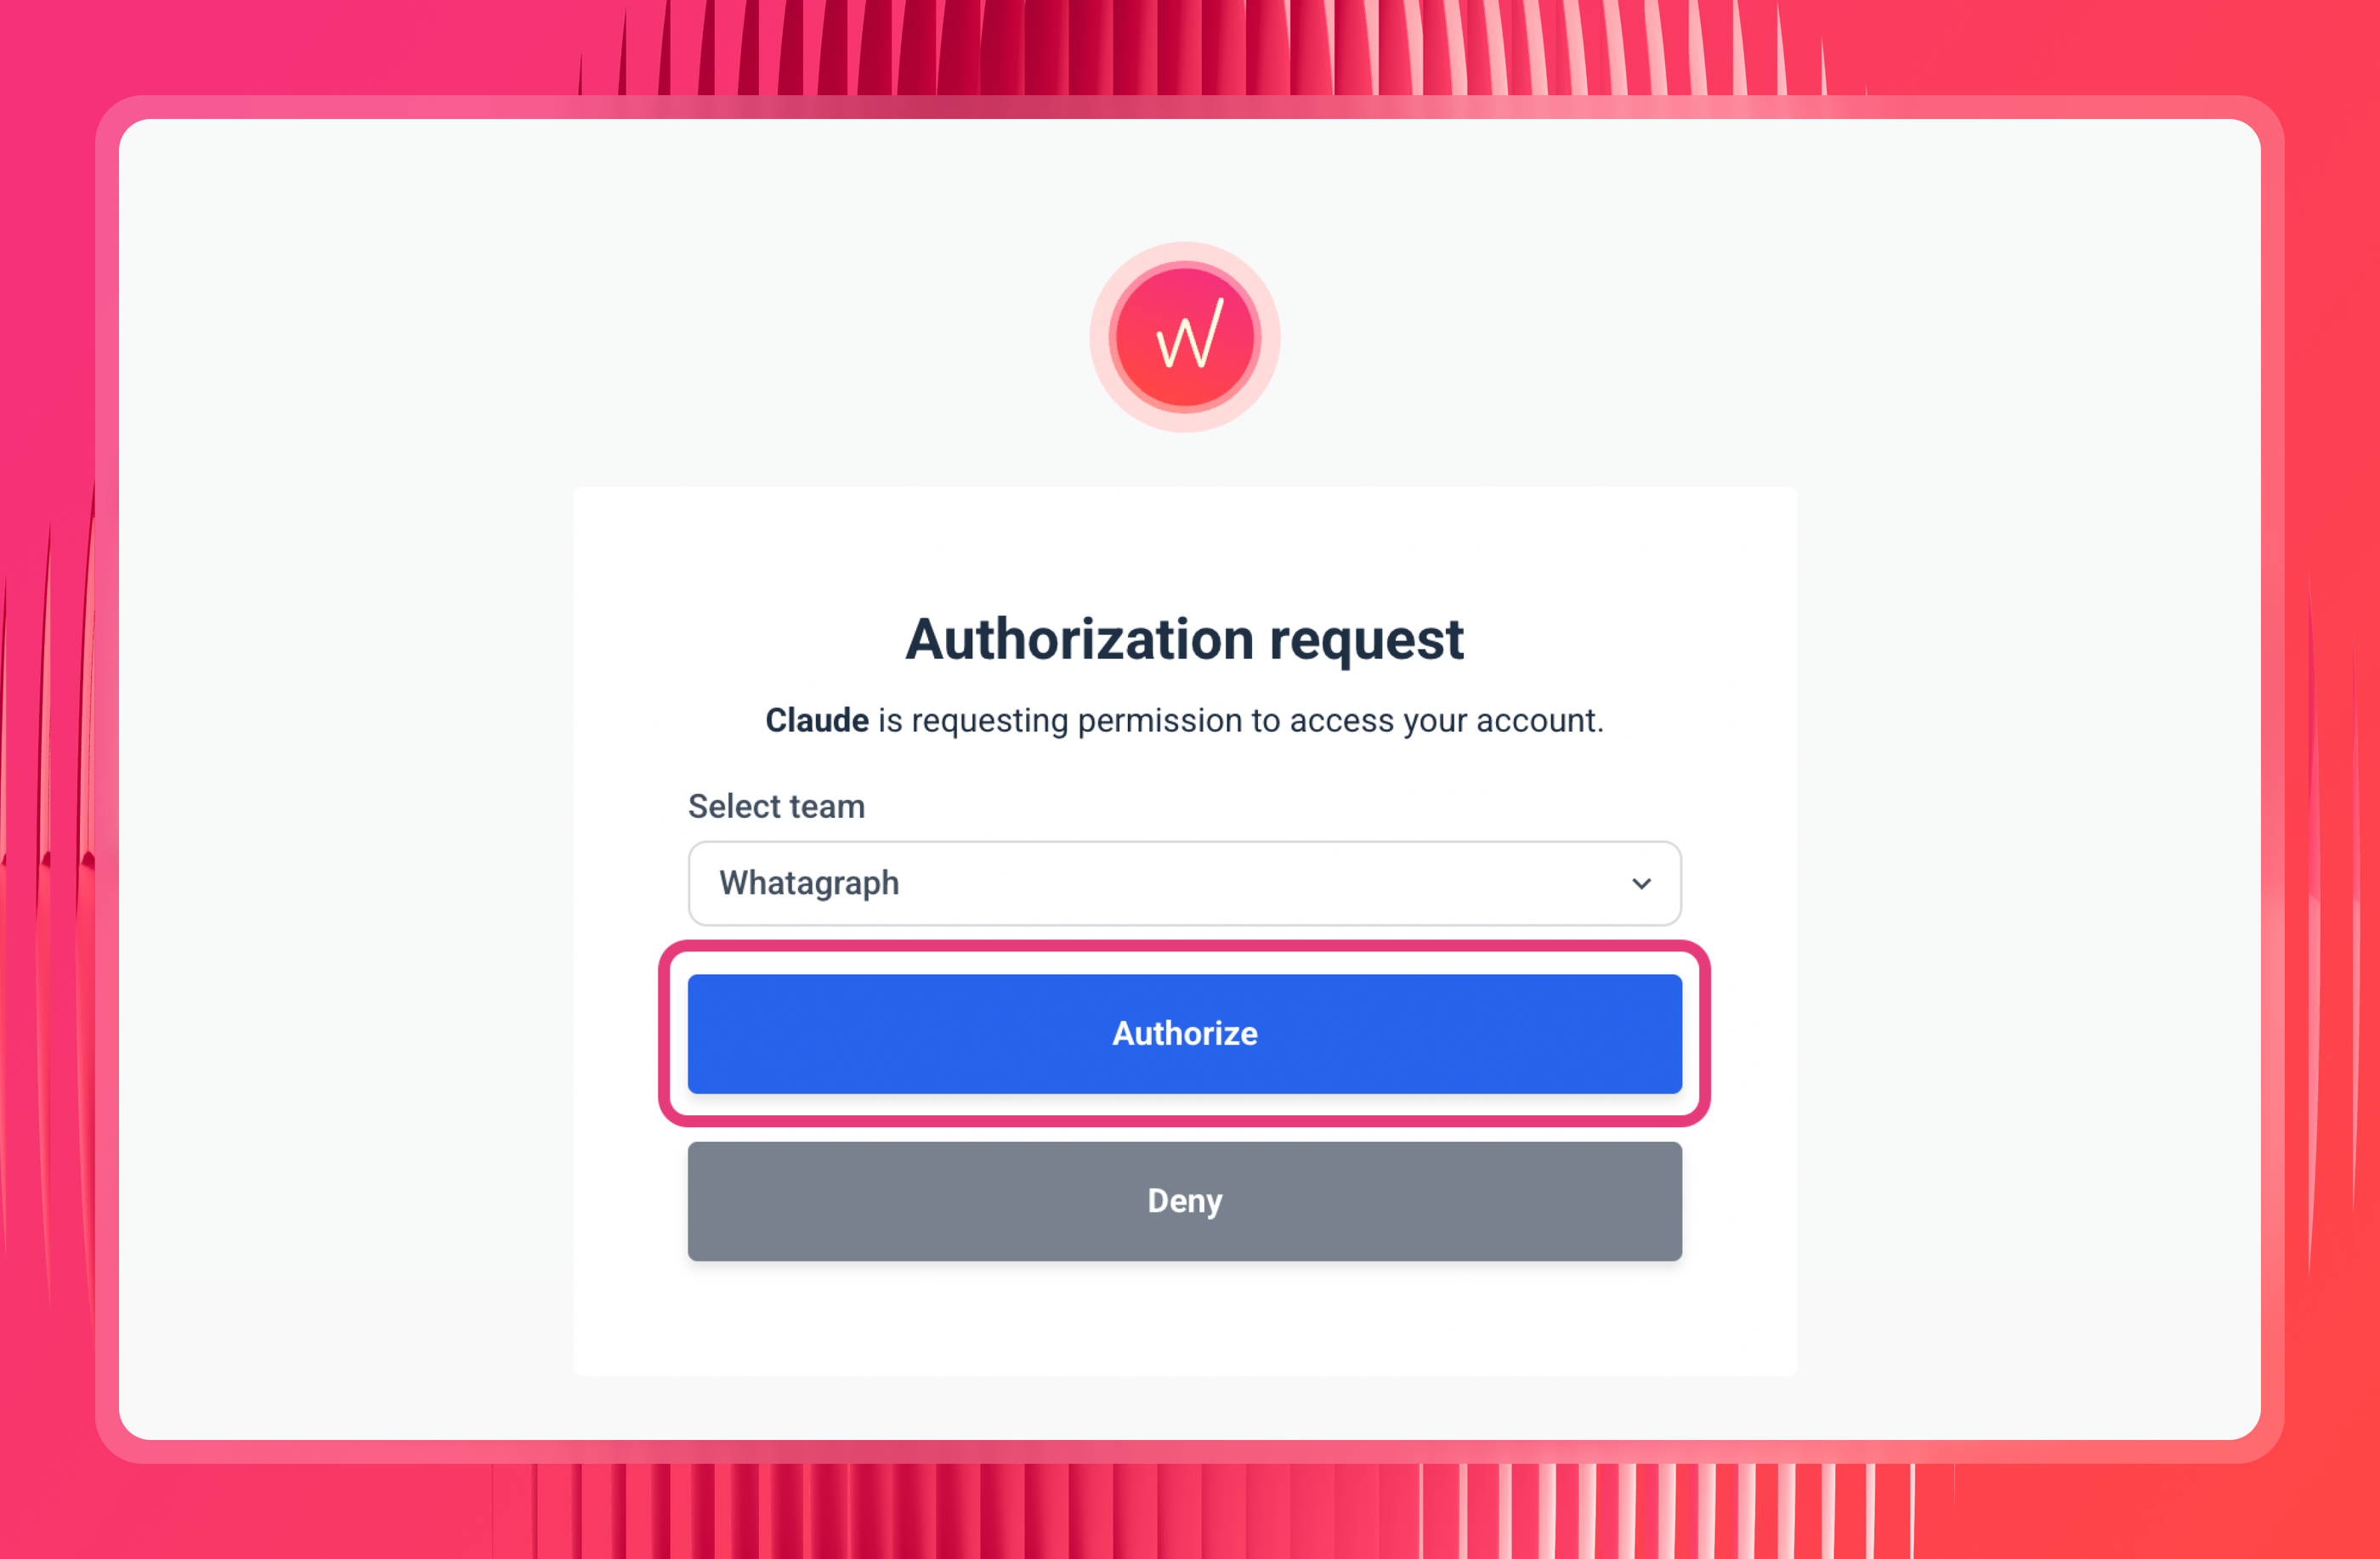
Step 3: Add the Whatagraph MCP connector in Claude
Open Claude, go to Settings, and find Connectors.
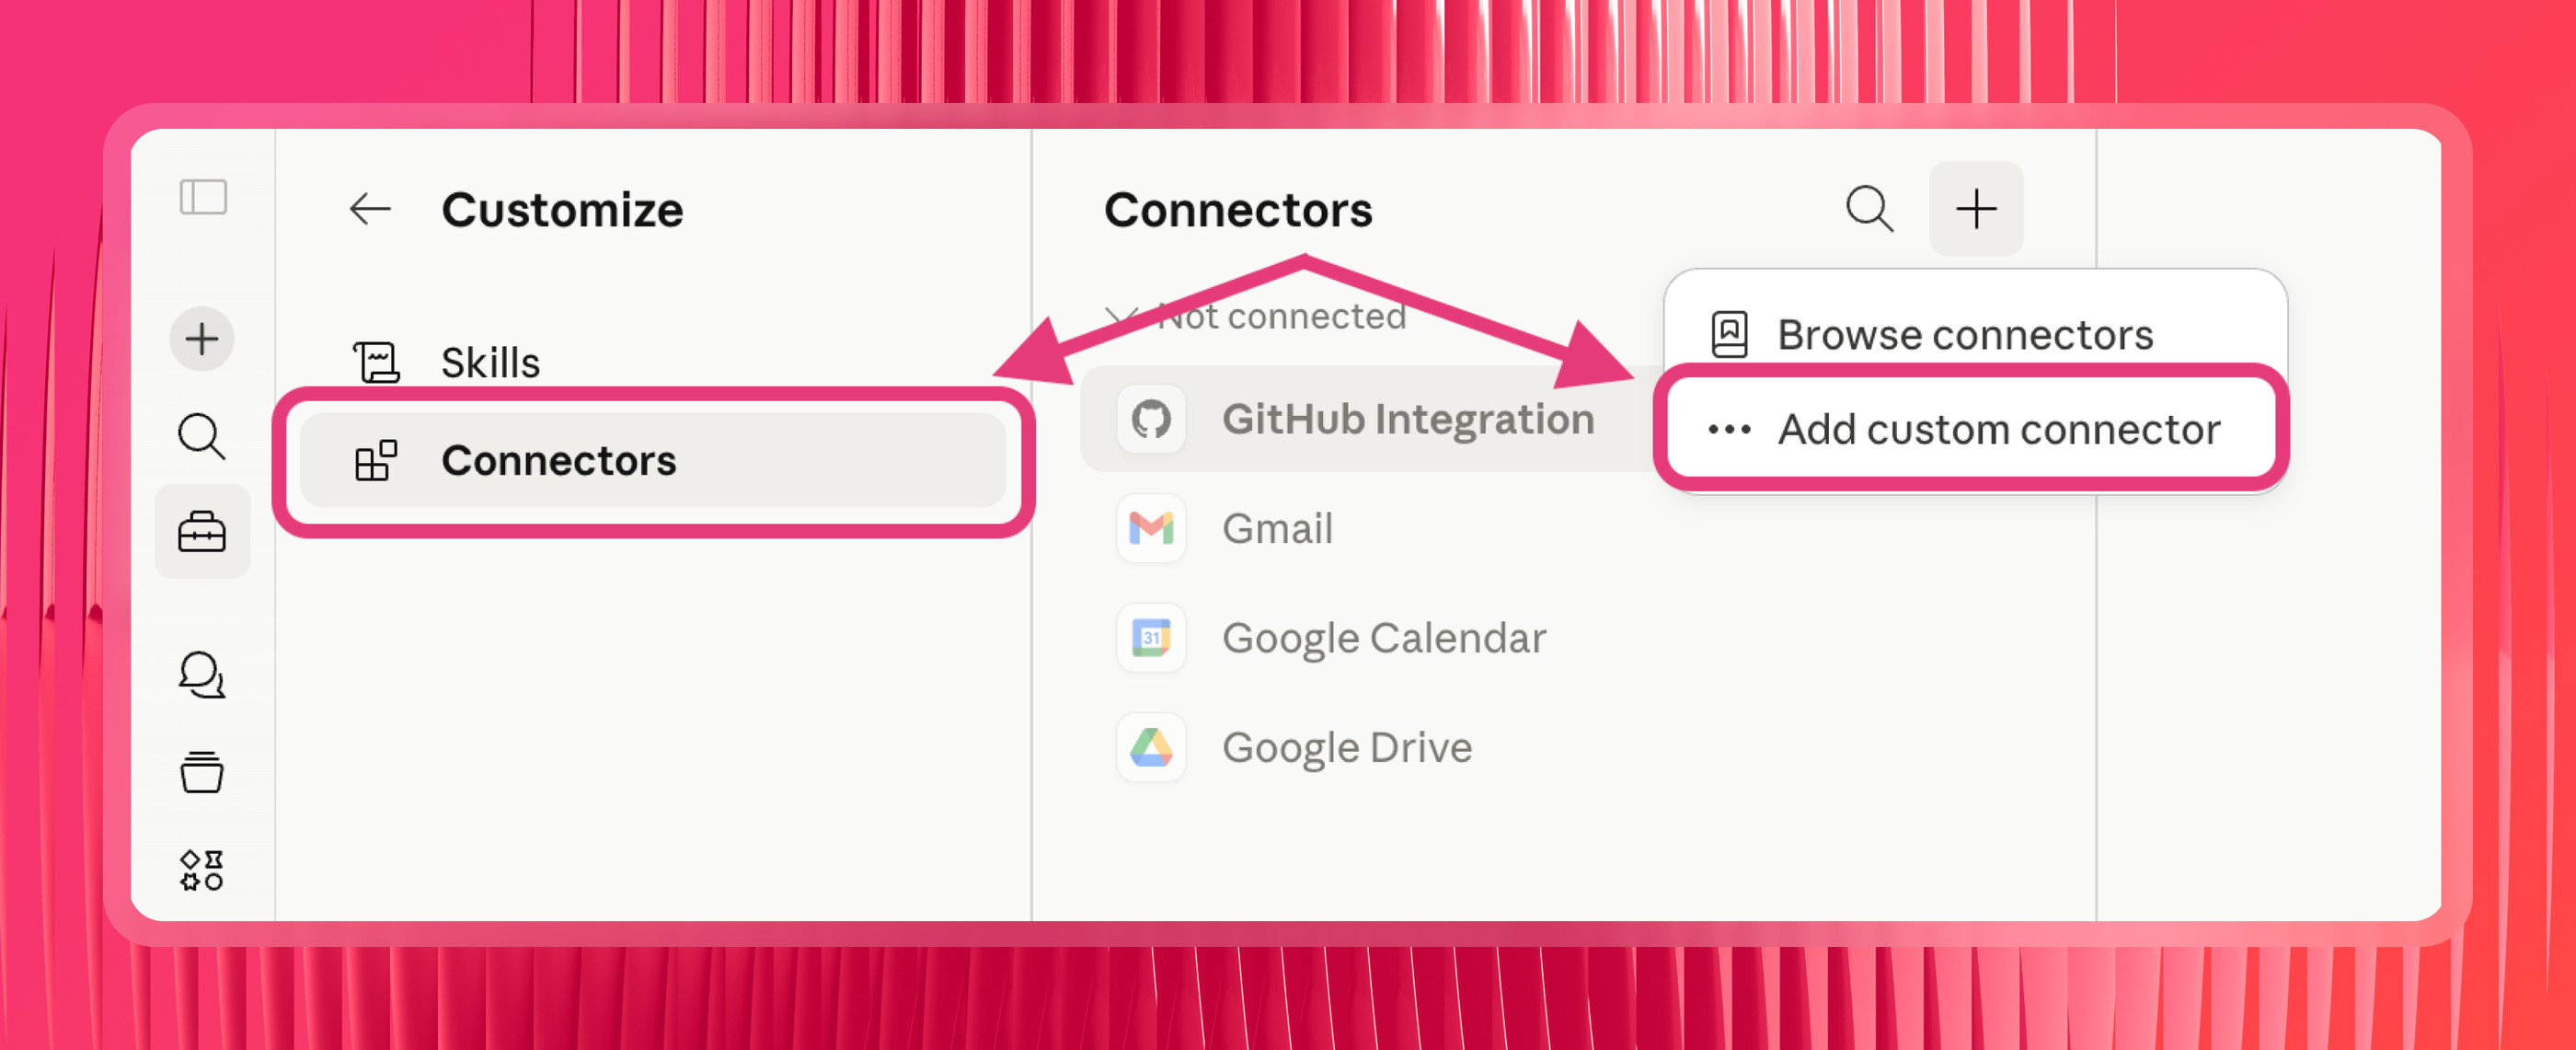
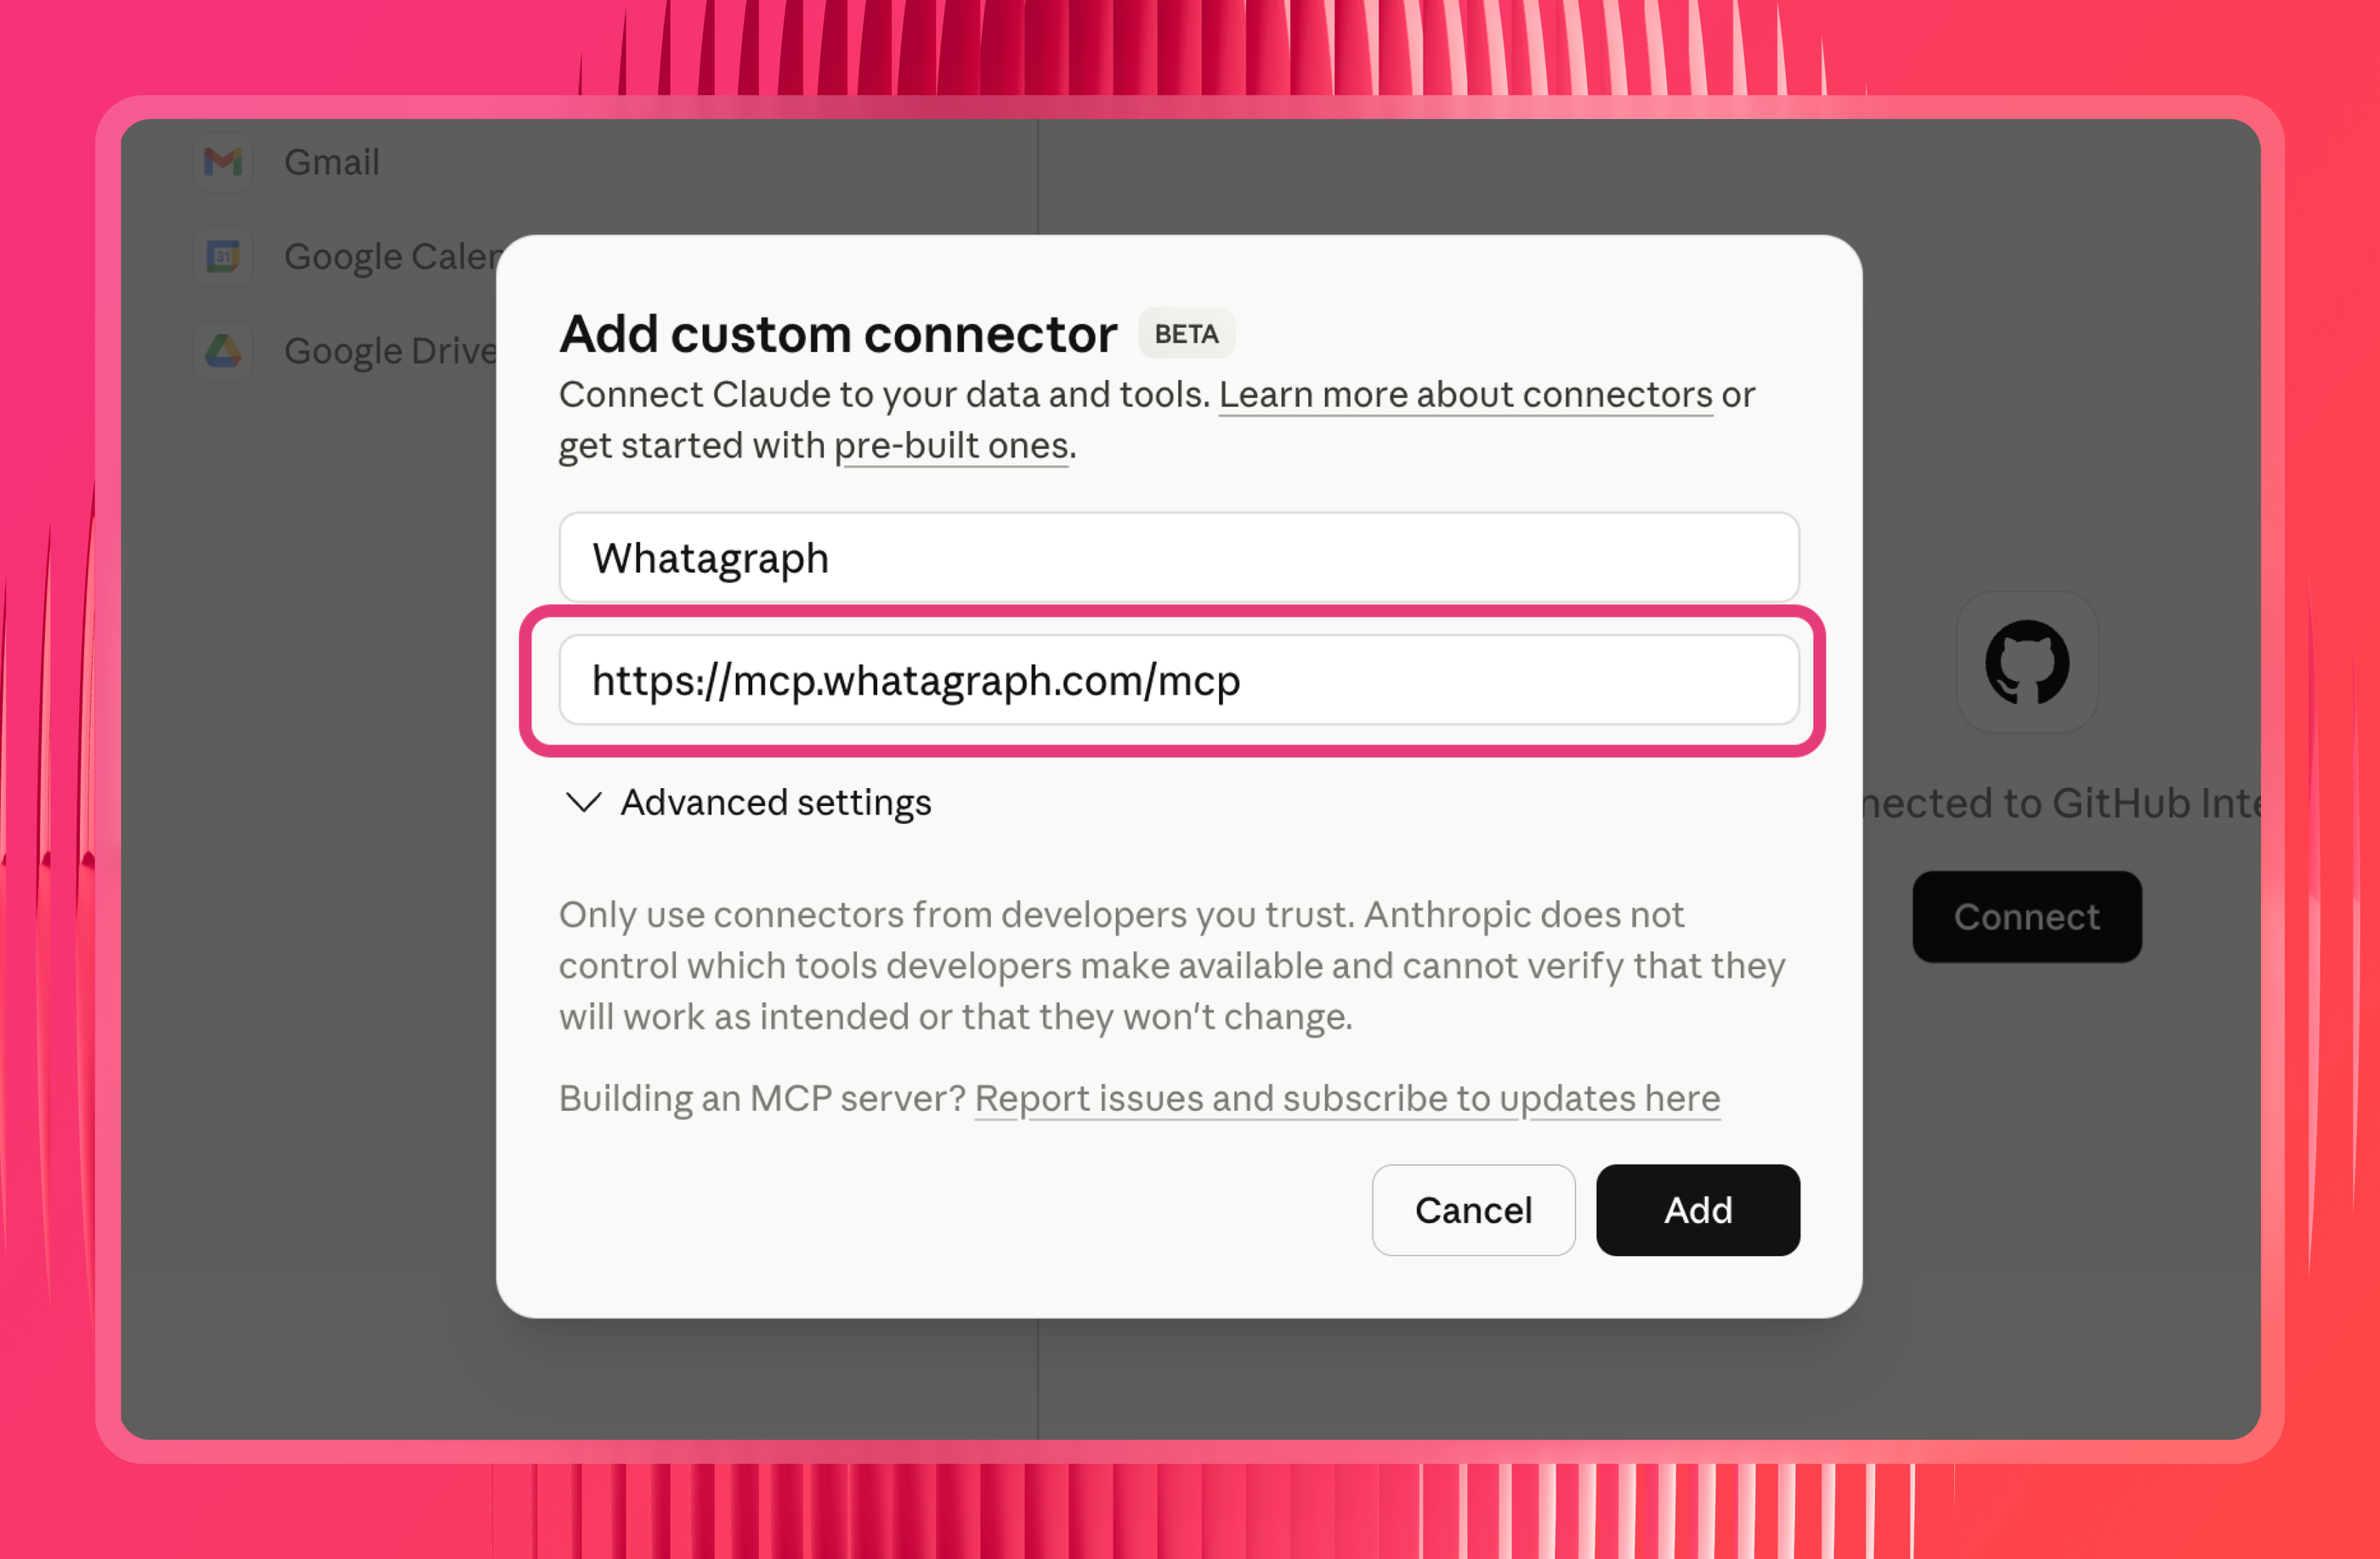
Look for the option to add a custom connector, then paste in the Whatagraph MCP server URL:
https://mcp.whatagraph.com/mcp
Step 4: Save and authorize
Claude will prompt you to connect your Whatagraph account. If you're already logged into Whatagraph in the same browser, this is a one-click step. (Same process on ChatGPT, by the way; you just need Developer access there.)
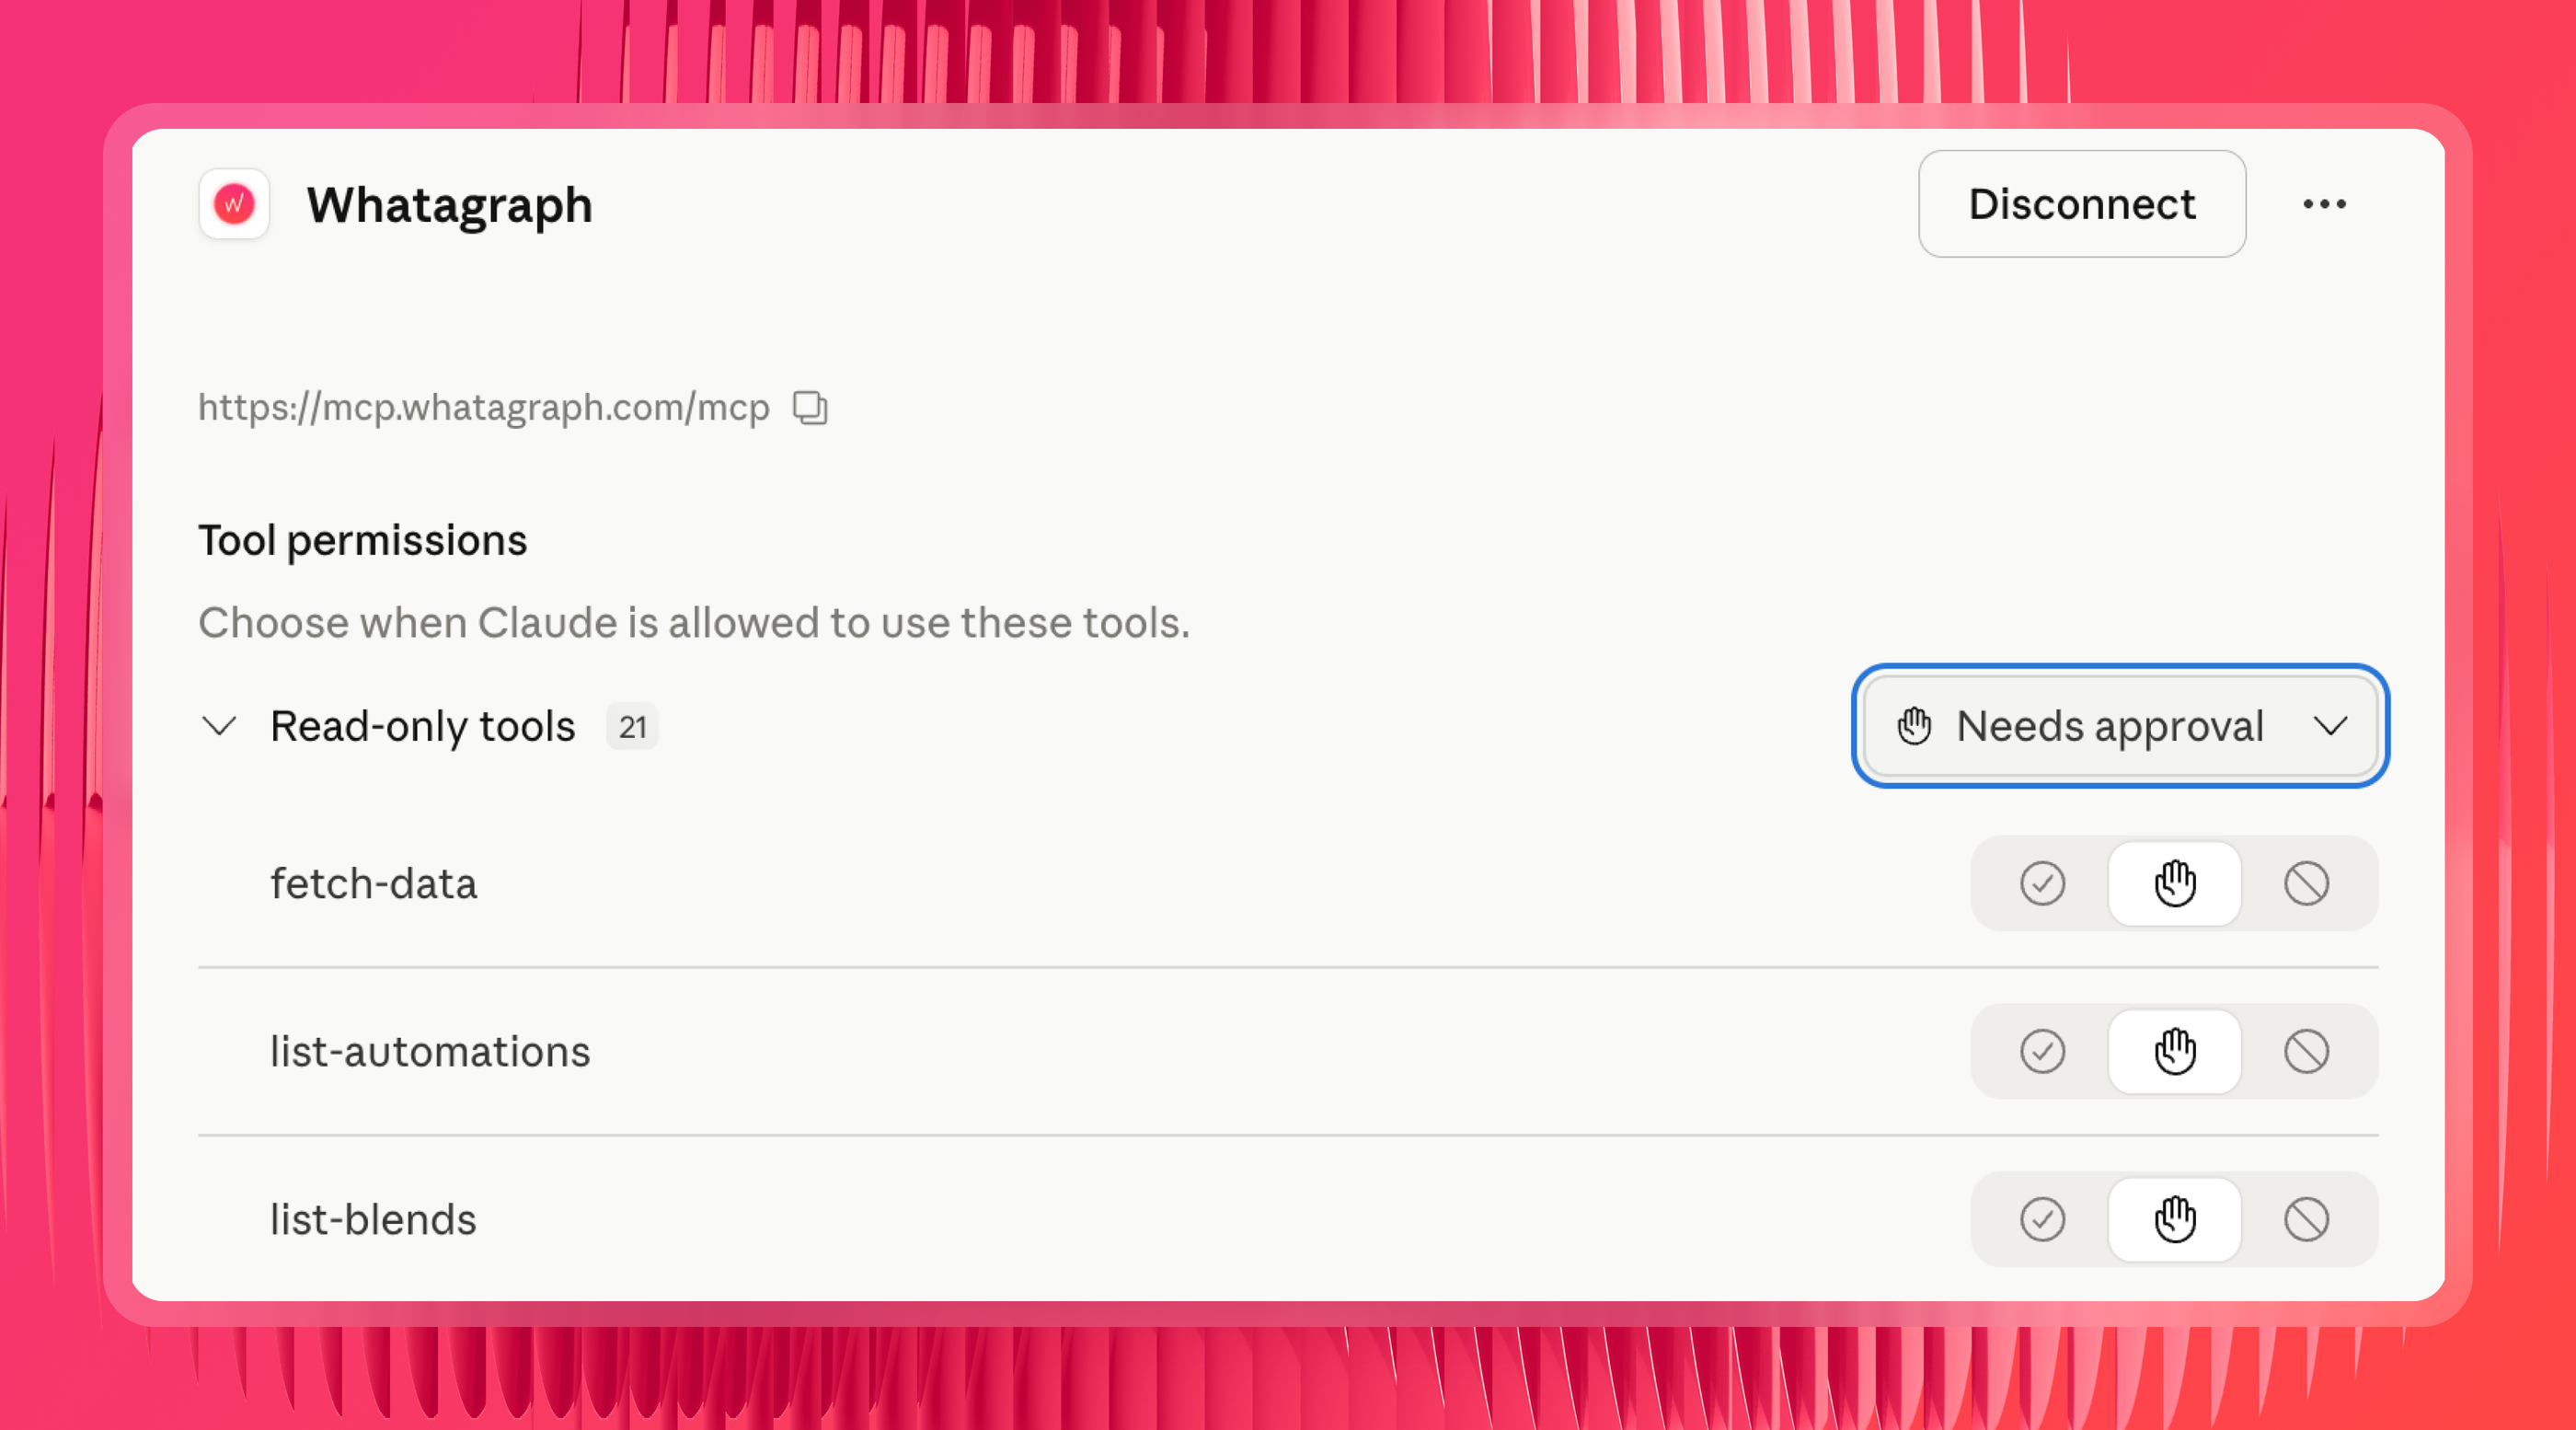
Step 5: Set your permissions
After authorizing, you'll see the permissions the connector has. If they're set to "Needs approval," Claude asks every time it pulls data. Switch to "Always allow" to skip that on every prompt.
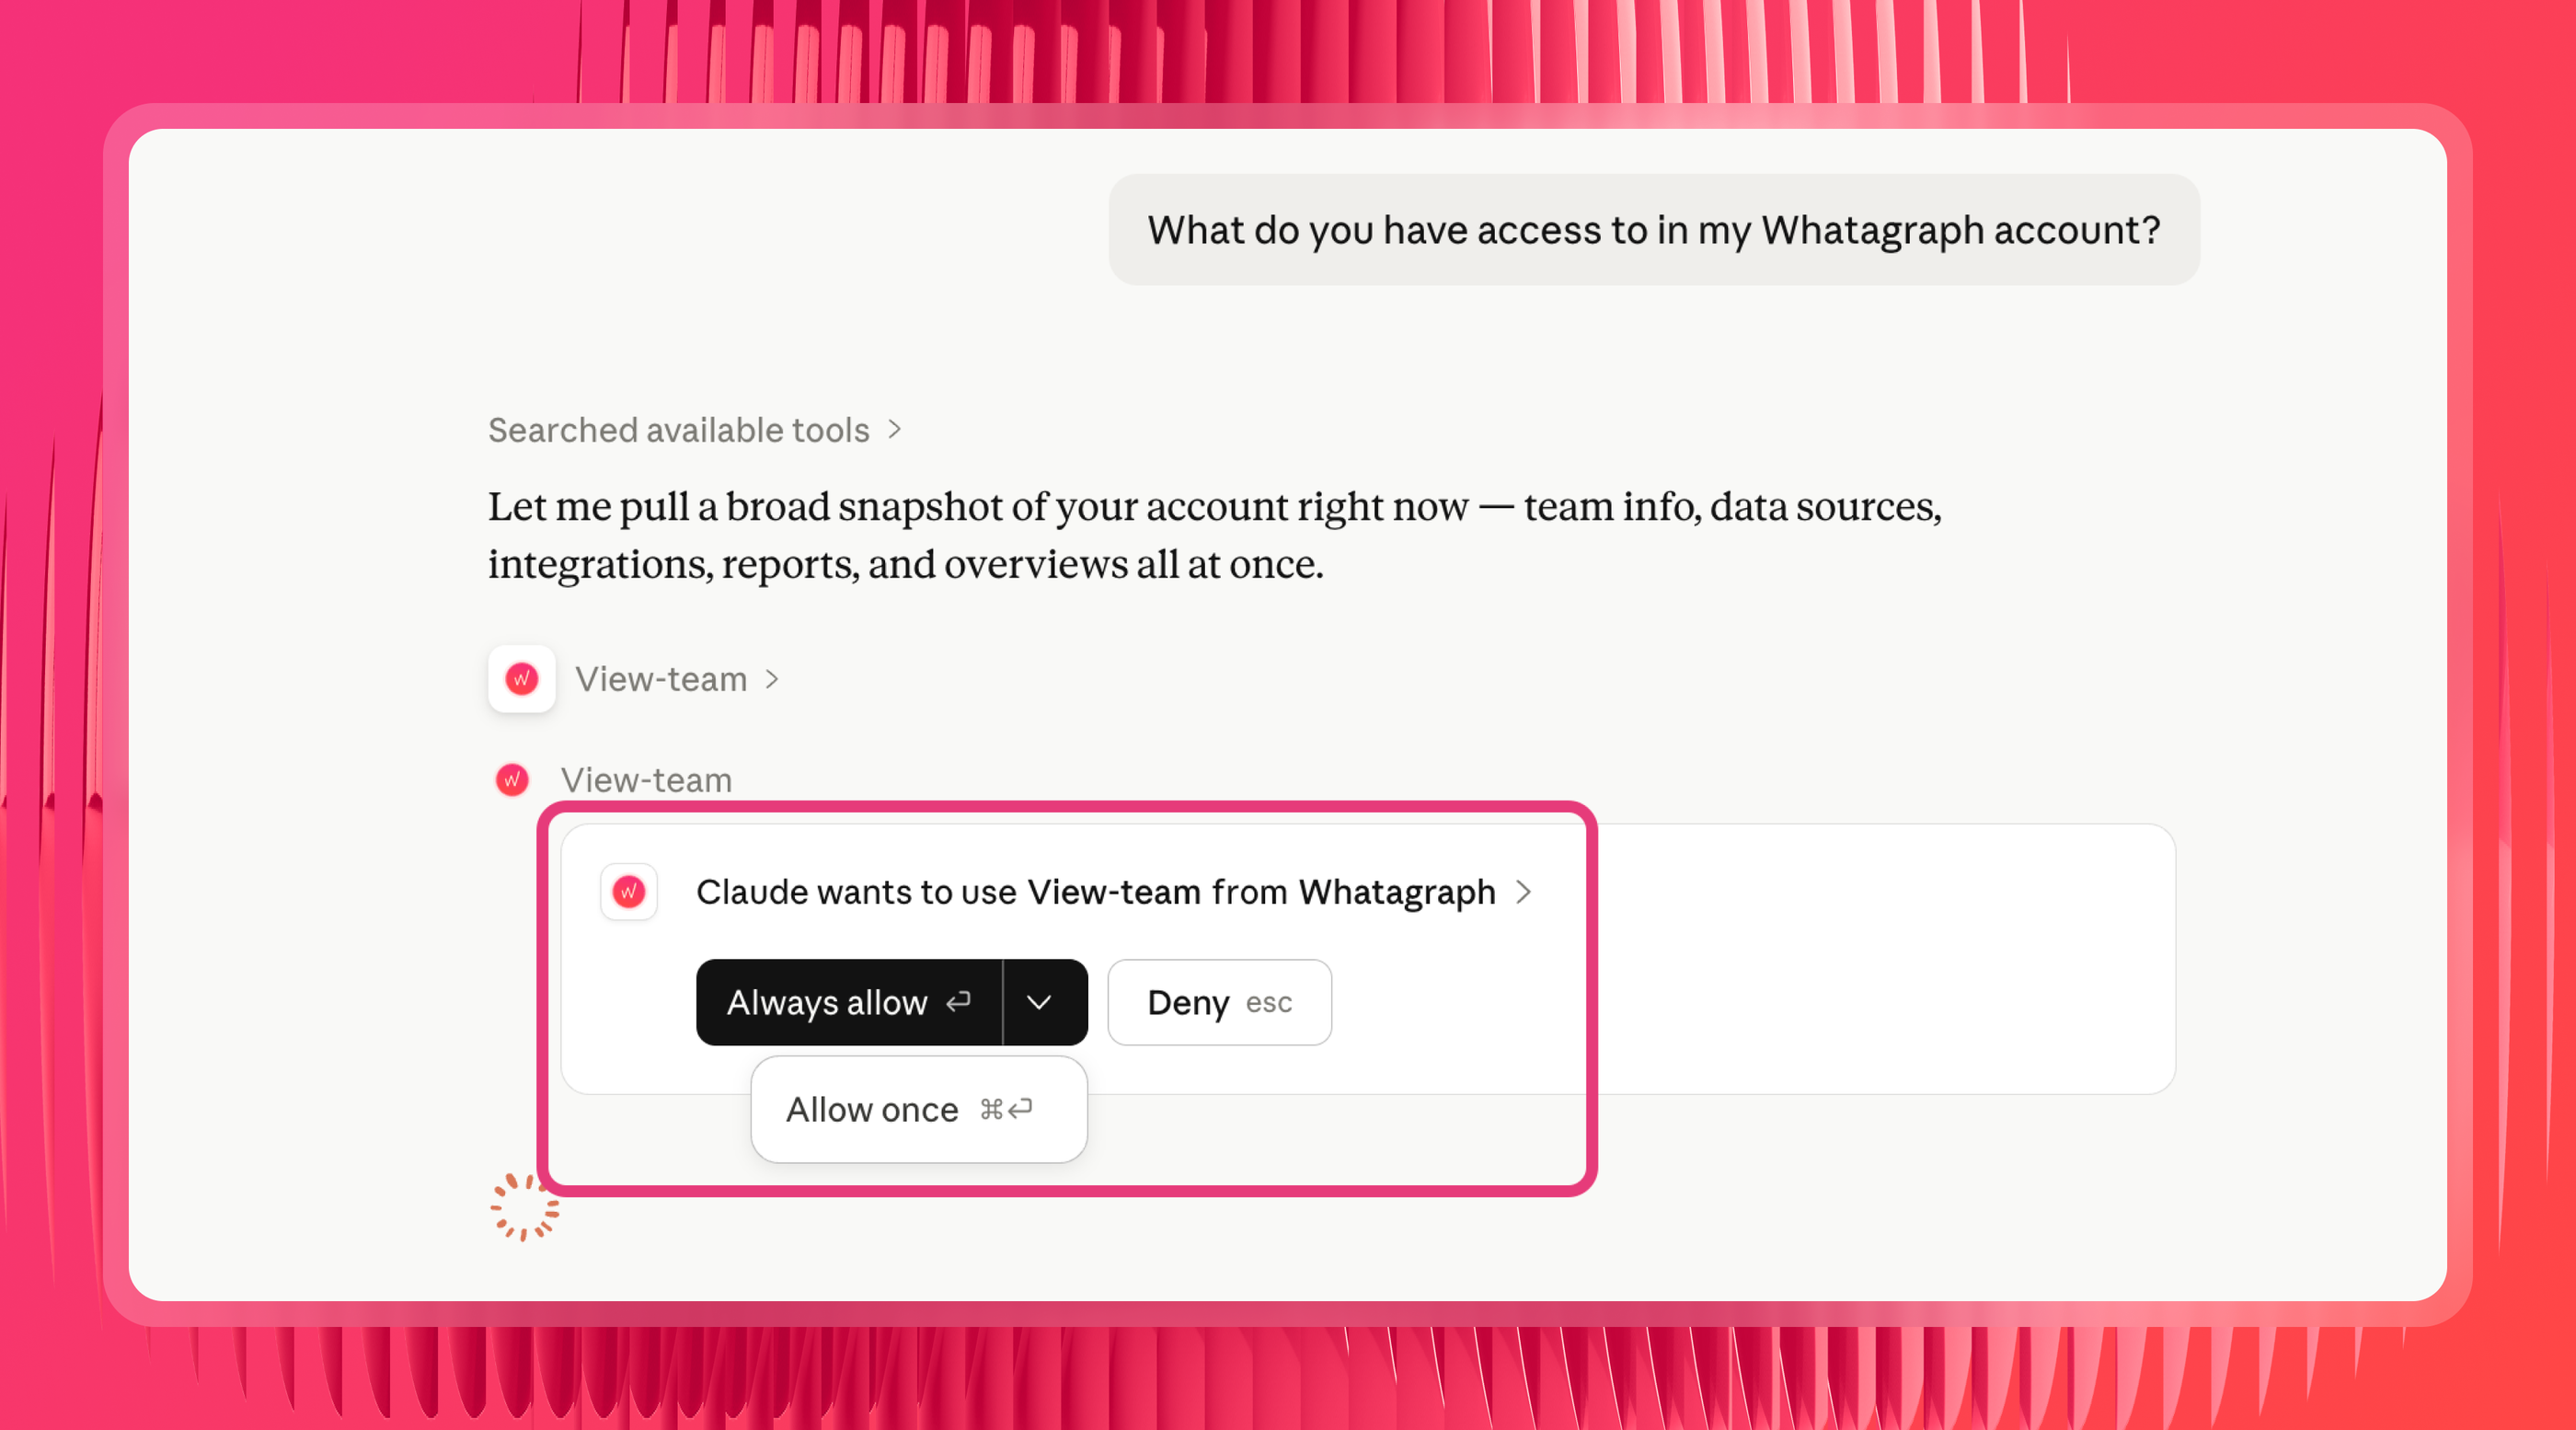
Step 6: Test the connection
Ask Claude: "What do you have access to in my Whatagraph account?" It should respond with your connected sources and account details. That's your sign it's working.
→ Important note
Whatagraph’s MCP already comes with pre-built skills like “cross-channel-analytics” and “generating-marketing-insights” so you don’t need to build your own or upload anything. Just go straight to Claude and start asking questions.
A prompt library for GA4 and Claude, by use case
Once you're connected and your data layer is set, the quality of the answer comes down to the question. Below are prompts that work, grouped by job.
Each group has a mix of single-channel prompts (GA4 on its own) and cross-channel ones (GA4 blended with your ad platforms), since most teams need both.
Traffic and acquisition
When you want to analyze website traffic with Claude or use Claude to compare organic and paid traffic in GA4.
Single channel:
- "What were my top 10 traffic sources last month by sessions, and how did each change versus the month before?"
- "Which landing pages brought the most new users in the last 30 days, and what's the engagement rate for each?"
Cross-channel:
- "Compare organic and paid traffic in GA4 for last month. Which one drove more conversions, and at what cost using Google Ads spend?"
- "For my Google Ads campaigns last month, show GA4 sessions and engagement rate next to clicks and spend, so I can see which campaigns sent quality traffic, not just clicks."
- "Organic conversions fell last month. Check whether paid traffic in Google Ads picked up the slack, or whether total conversions dropped across both."
- "Compare GA4 conversions against Google Ads conversions for last month and flag any campaigns where the two numbers disagree by more than 15%."
Finding traffic drops fast
When you want to use Claude to find traffic drops in Google Analytics.
Single channel:
- "Did any traffic source drop more than 20% week over week in the last month? Flag the ones worth investigating."
- "Sessions fell last week. Break the drop down by channel, device category, and landing page to show me where it actually happened."
- "Compare this month's traffic to the previous period. Which content pieces and channels are down month over month, and by how much?"
- "Find any landing pages that lost more than [X%] of their organic traffic in the last 30 days, and include conversions so I can prioritize which to fix first."
- "Why did my organic traffic go down unusually last week? Which content pieces were the most affected?”
- "Conversions dipped last week. Break it down by channel, device, and landing page to show me where the drop actually happened."
Cross-channel:
- "Organic conversions fell last month. Check whether paid traffic in Google Ads picked up the slack or whether total conversions dropped across both."
- "Compare GA4 conversions against Google Ads conversions for last month and flag any campaigns where the two numbers disagree by more than 15%."
- "Traffic from paid search fell last week in GA4. Cross-check it against Google Ads to see if it was a budget change, a drop in impressions, or a tracking problem."
Conversions and funnels
When you want to understand what's actually converting, not just what's getting visits.
Single channel:
- "Build a funnel from product page view to add to cart to checkout to purchase for last month, and show the drop-off rate at each step."
- "Which channels in GA4 have the highest conversion rate, and which bring traffic that never converts?"
Cross-channel:
- "Calculate blended ROAS for last month using Google Ads spend against GA4 revenue, broken down by campaign."
- "Which Google Ads campaigns drove the most GA4 key events last month, and what was the true cost per conversion for each?"
- "My blended ROAS dropped last month. Tell me whether it was a spend increase in Google Ads, a conversion drop in GA4, or both, and which campaigns drove it."
Cross-channel and organic performance
When the question spans platforms, which is most of the questions that drive spend decisions.
Single channel:
- "Give me a channel comparison from GA4 for this month: sessions, engagement rate, and conversions by default channel grouping."
- "Which GA4 channels grew the most quarter over quarter, and which lost ground?"
- "Show me new versus returning user behavior by channel in GA4 for the last 30 days."
Cross-channel:
- "Build a cross-channel performance report combining GA4 and Google Search Console: organic clicks and impressions from GSC next to sessions and conversions from GA4, by landing page."
- "How much did we spend across Google Ads, Meta, and LinkedIn last month, and what did GA4 record in conversions and revenue for each?"
- "Which channel had the best return last month: blended ROAS across all paid sources, ranked."
Client reporting and summaries
When you need a fast read across an account, or a portfolio view across clients.
Single channel:
- "Give me an executive summary of this client's GA4 performance for the last 14 days: headline traffic, top converting pages, and anything worth flagging."
- "What were the top 5 landing pages by conversions for this client this month, and how did they move versus last month?"
- "Summarize the key traffic and conversion trends in this client's GA4 property for the last 30 days in plain language I can paste into an email."
Cross-channel:
- "Summarize this client's full performance last month across GA4, Google Ads, and Meta from Report [name]: spend, conversions, blended ROAS, and the two biggest wins and concerns."
- "Give me a GA4 performance summary across all client properties for last month, ranked by conversion growth, so I know which accounts to dig into first."
- "For each client, pull GA4 conversions next to total ad spend across all their channels, and flag any where spend went up but conversions went down."
Now you’re all set! Sign up for free with Whatagraph and start asking questions about your cross-channel and cross-property Google Analytics data - and trust the answers you get.
Or book a demo with our team for a personalized walkthrough.
Published on Jun 26 2026
WRITTEN BY
YamonYamon is a Senior Content Marketing Manager at Whatagraph. With an eye for detail and a knack for always considering context, audience, and business goals to guide the narrative, she's on a mission to create genuinely helpful content for marketers. When she’s not working, she’s hiking, meditating, or practicing yoga.