Marketing Data Analytics: Bring Together Marketing Data for Actionable Insights
The digital age brought up big data that allows marketing agencies to record every consumer click, impression, and view. However, this amount of marketing data is irrelevant if it’s not structured and analyzed for actionable insights that lead to campaign optimizations. That is the role of marketing data analytics.

Nov 22 2023●6 min read


What is marketing data analytics?
Marketing data analytics is the practice of gathering and analyzing data from different marketing channels and sources to gain insights into customer behavior, marketing performance, and the effectiveness of marketing strategies.
The aim of marketing data analysis is to foster data-driven decisions that help marketing teams optimize their marketing efforts and achieve better results with the available resources.
There are three models or types of marketing data analytics:
- Descriptive analytics: When you collect historical data sets from earlier campaigns and use the insights to plan strategies for future campaigns.
- Predictive analytics: When you use insights from previous digital marketing campaigns to try to predict customer behavior so you can work out better-targeted future campaigns.
- Prescriptive analytics: This model assumes that you gather customer data from all available touchpoints and analyze the impact of each company initiative and customer interaction to create highly targeted campaigns that influence customer behavior.
When used together, these analytic models create a complete picture of the effectiveness of marketing campaigns on the target audience.
6 ways marketing agencies benefit from analyzing marketing data
Marketing data analytics transform the performance of clients’ marketing channels into actionable insights that agencies can use to improve customer engagement, eventually bringing in more leads for clients and converting them into paying customers.
However, marketing data analytics can alleviate multiple pain points that marketing agencies often encounter. Here are some of the challenges that can be tackled through the effective use of marketing data analytics.
- Streamlined decision-making: Analyzing marketing data helps marketers understand clients’ campaigns in a more objective way, allowing them to base their decisions on facts. For a balanced process, it’s best to use analytics before and after decision-making. This way, you can optimize future plans and evaluate the campaign results.
- Identify the most profitable customer segments: Marketing agencies can use data analytics to identify customer segments that are most profitable for their clients’ businesses. You can use this information to meet these segments with more relevant messaging.
- Optimize landing pages for conversions: Marketers can use data analytics to test different landing pages and determine which ones are most effective at converting visitors into customers. Clients can then use this information to improve the overall conversion rate of landing pages.
- Predict customer churn: Advanced analytics allows marketers to develop predictive models to forecast which customers are likely to cancel subscriptions or stop doing business with a client’s company. You can then use this information to target those demographics with specially tailored marketing campaigns and try to prevent them from churning.
- ROI measurement: Demonstrating the return on investment of marketing efforts to clients can be challenging. Marketing data analytics helps by attributing conversions to specific marketing touchpoints in the customer journey. This attribution modeling allows agencies to quantify the impact of their campaigns and allocate marketing budgets more effectively. Attribution modeling allows clients to see which of their marketing channels is the most perspective.
- Prove value to clients: Finally, marketing data analytics helps demonstrate the impact of an agency’s marketing initiatives on clients. By providing tangible metrics and professionally built reports, you can showcase the value of campaigns you plan and execute for your clients, which translates into trust and transparency.
4 steps to analyze marketing data
Marketing data analysis is a continuous cycle of measuring, analyzing, and improving. Make sure you’re not missing any of these four steps:
1. Identify critical metrics
The first step is to determine which metrics to use. This largely depends on your client, as each business will have a different set of metrics to support the company's KPIs. The common metrics used in marketing data analytics are:
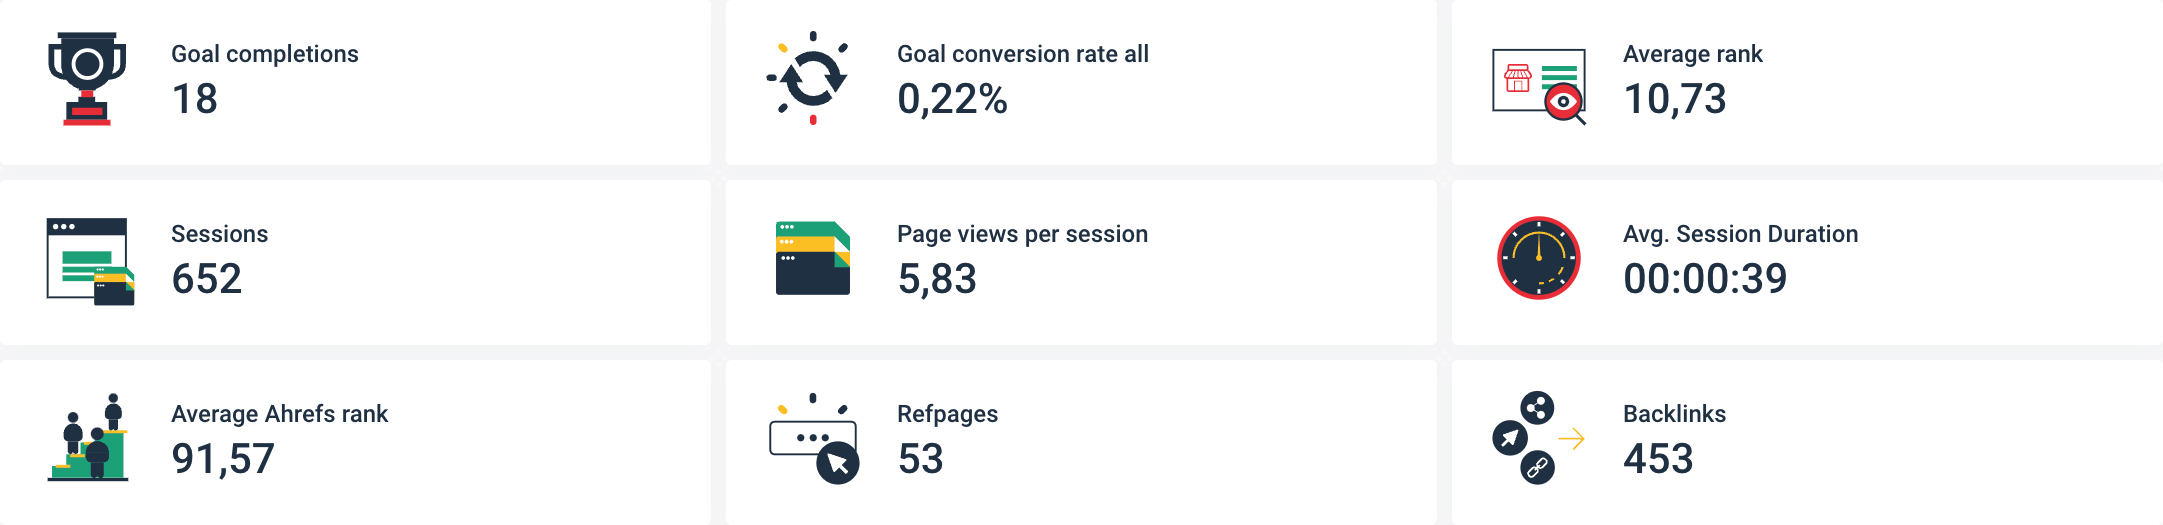
- Website performance metrics: Including traffic, most visited pages, search ranking, unique visits, conversions, and bounce rates.
- Paid ads metrics: Impressions, click-through rate, ad lifetime value (LTV), ad spend, ROI, and engagement rate.
- Social media metrics: Total reach, likes, views, comments, shares, followers, and subscribers.
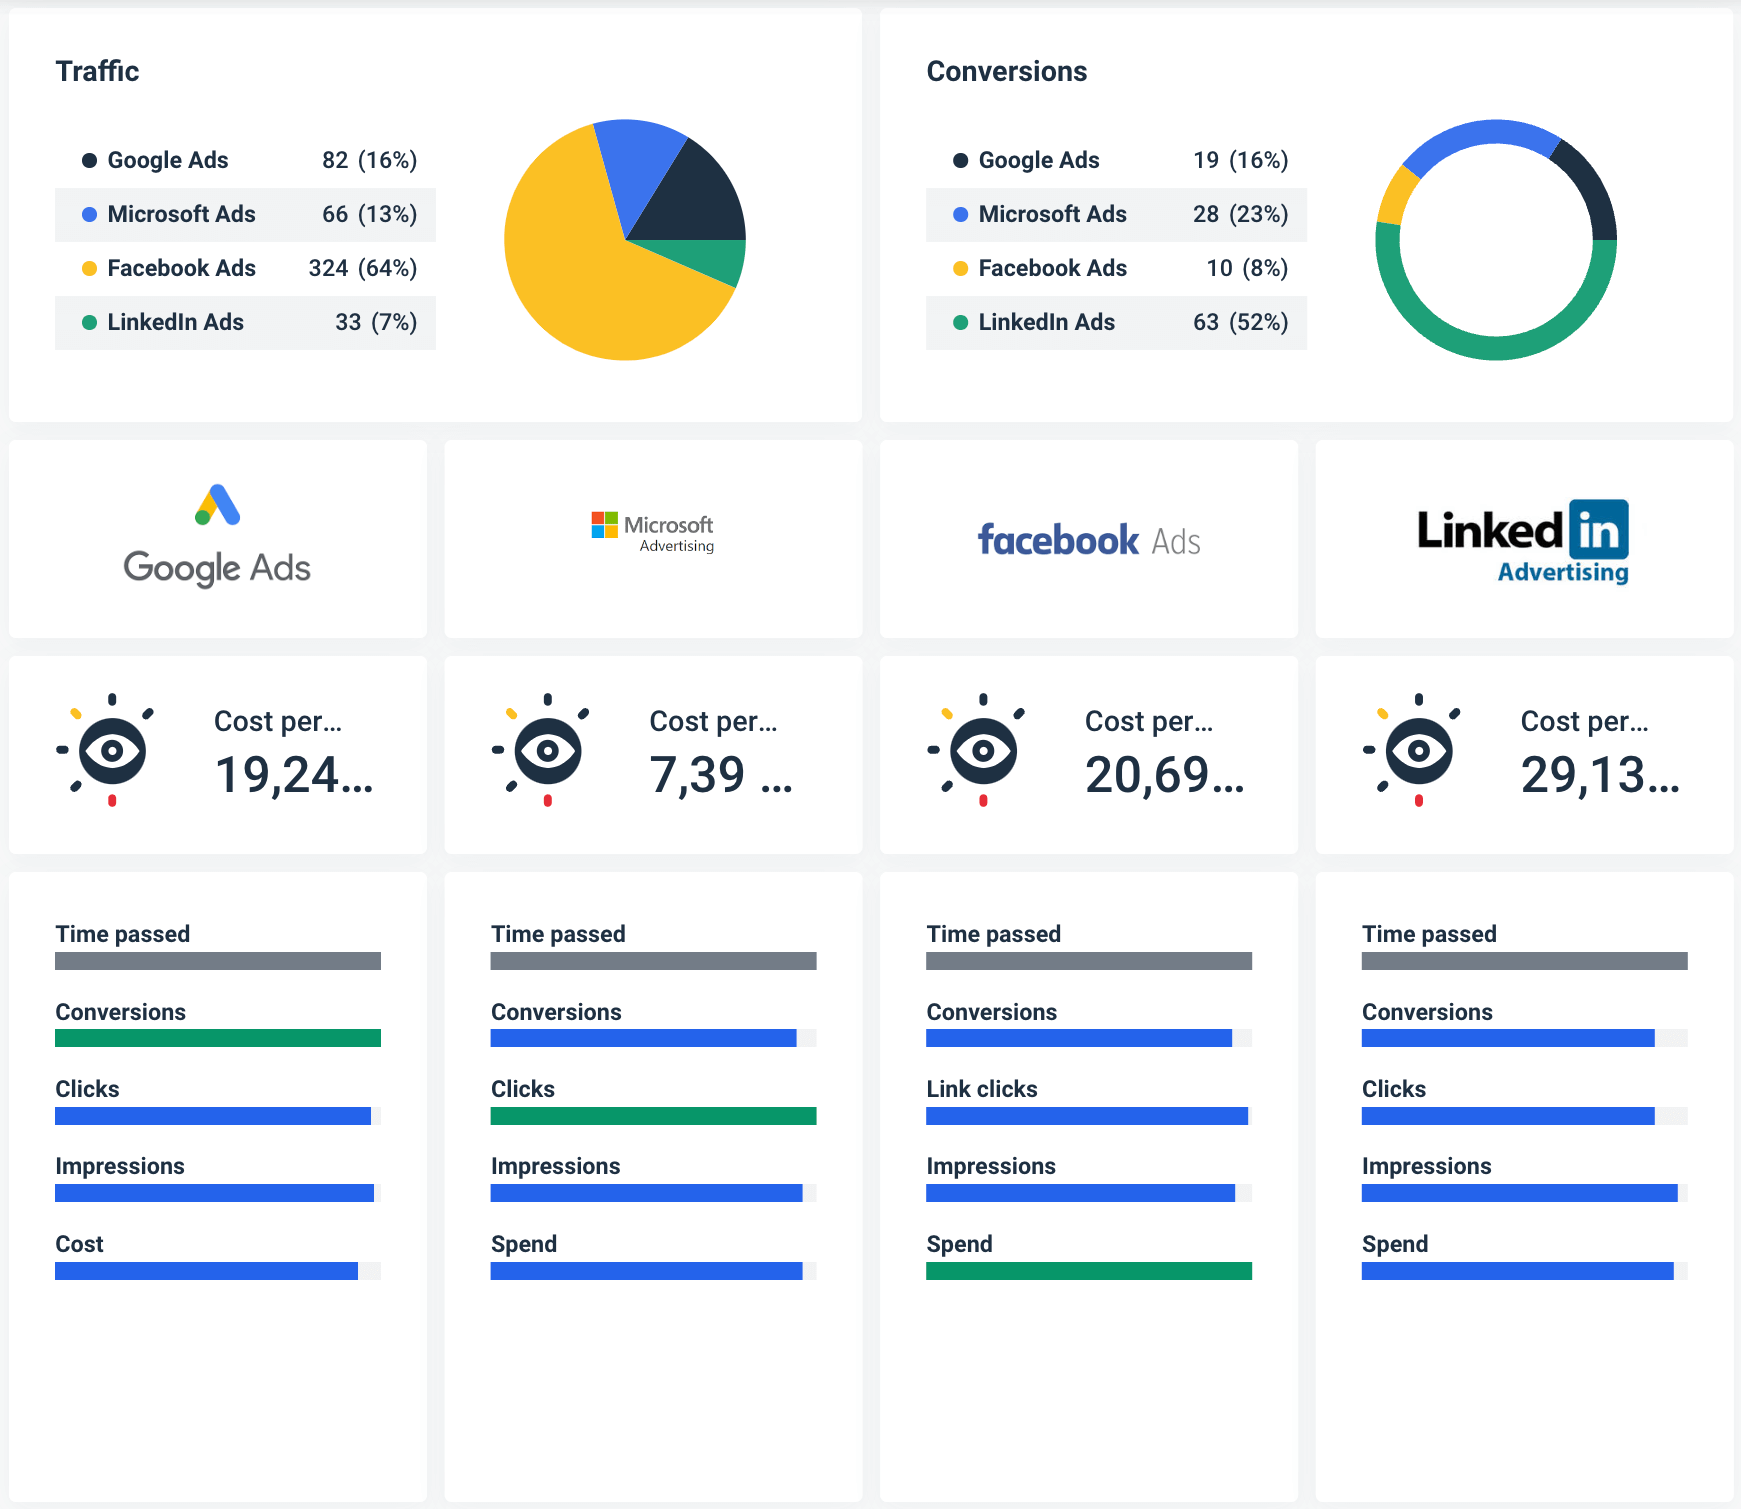
Important: Some of these metrics are easily available from the social media platform analytics. However, to get cross-channel metrics such as total reach or total CTR, in the case of paid ads, you need to use a marketing data platform with data transformation ability.
Whatagraph allows you to easily set up a custom formula to blend related metrics from different marketing channels and report on unique metrics unavailable at the source API.
- Email marketing metrics: Open rate, click-through rate, and bounce rate.
- Marketing team performance metrics: These metrics measure the productivity of your team. The metrics in this category help the CMO and the team understand the results of their work. For example, metrics in this category can include the number of opportunities created, lead generation, brand awareness, social media followers, etc.
- Lead generation metrics: Metrics in this category tell you how effectively your campaigns and channels capture leads. Some of the lead generation metrics to consider: new metrics per channel, new leads by campaign, new opportunities created, qualified leads created, new customers, conversion rates, and cost per lead.
2. Connect scattered marketing data
In the next step, you need to connect data from your client’s sources. Websites are a primary data source because they’re often the first stop where prospects learn more about a product or service.
Web analytics aside, you should also get data from other sources like social media, CRMs, e-commerce, SEO, email, and PPC platforms.
Website data should be easy to get from Google Analytics 4 reports. However, connecting data from all the other sources can be a time-consuming task. You need a way to extract data, consolidate it, cleanse it, and perform transformations where needed.
It’s not rare that marketing agencies use several AI marketing analytics tools for different sources, for example, Looker Studio for Google platforms, Supermetrics for social media, Ahrefs or Semrush for search engine optimization or even some legacy dashboards.
Managing multiple data connection tools is not only challenging from a logistical aspect but can also make budget planning difficult, as vendors may change the pricing or structure of their plans over time.
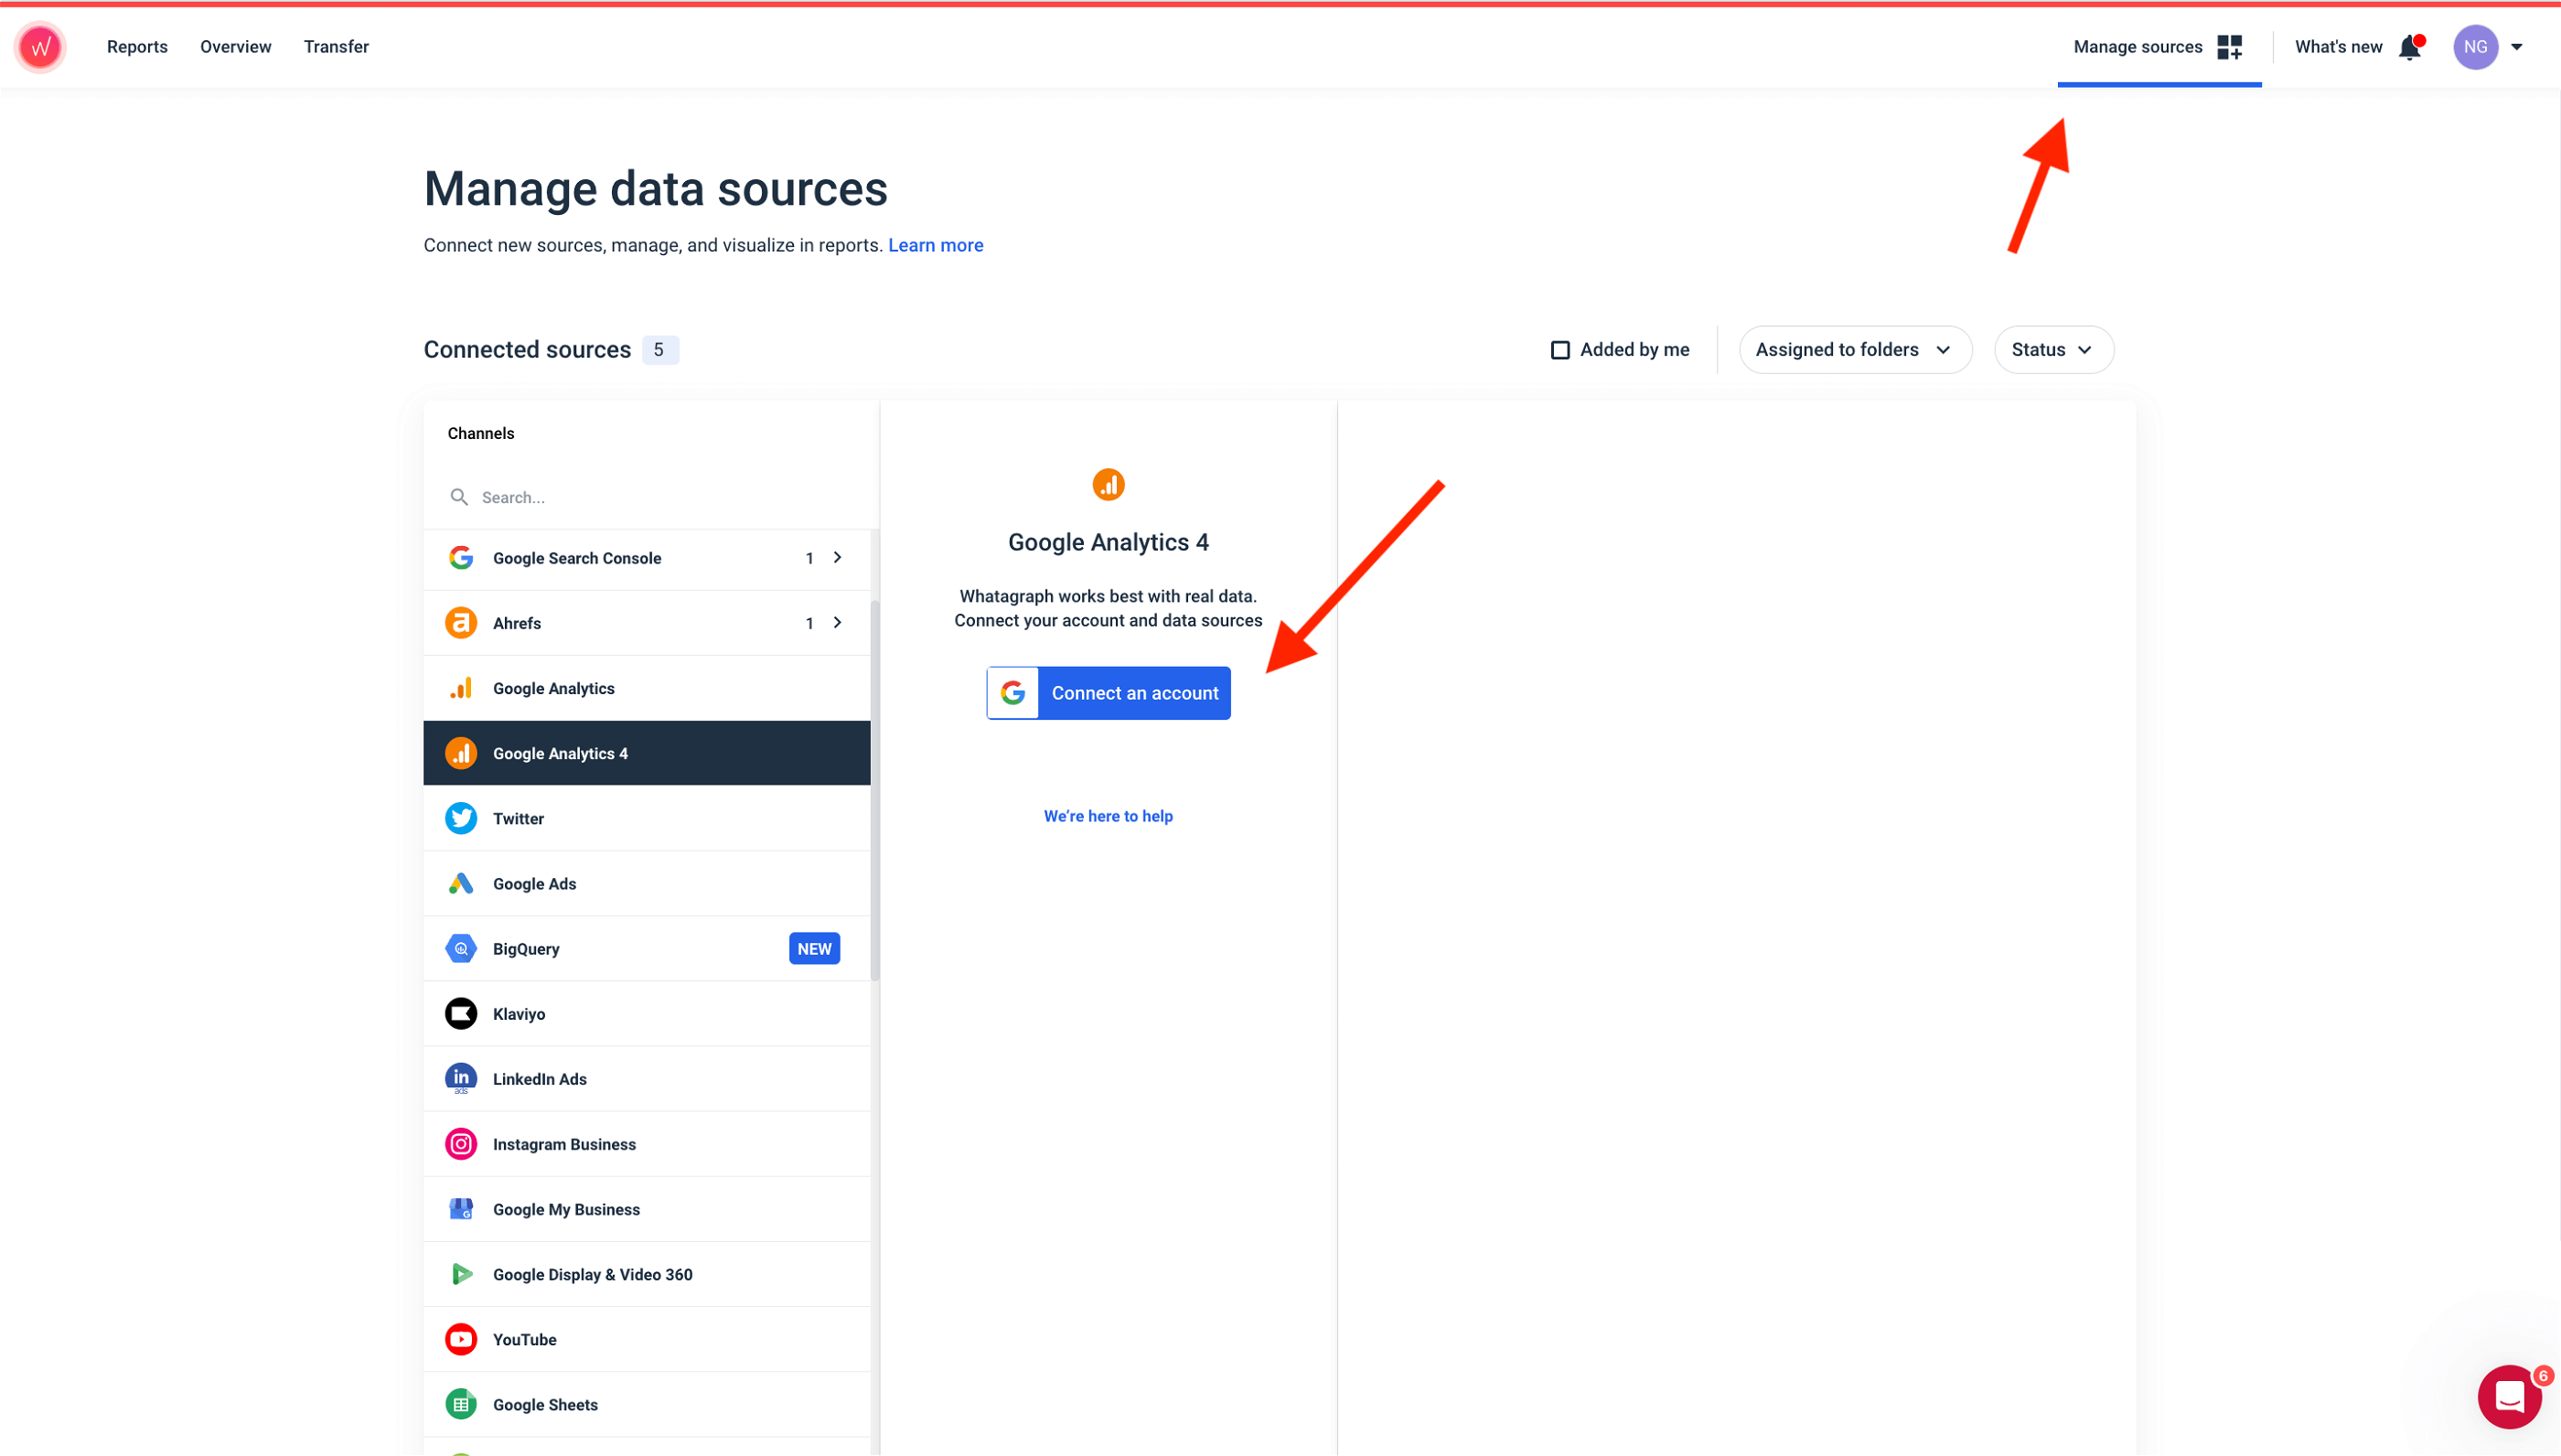
Whatagraph solves this problem by presenting a single platform that pulls data from a range of marketing sources via native integrations. This not only secures the greater speed and reliability of connections but also allows marketers to seamlessly manage data sources from one place.
Once you add your clients’ accounts, that’s that. There’s no need to manually import anything or refresh the connection. The data is pulled automatically whenever you need to analyze it.
3. Visualize and analyze cross-channel
The next step is to visualize the connected data for analysis. Ideally, you would use the same platform you used to collect marketing data.
By going with one marketing data platform to both connect and analyze marketing data, you avoid logistical issues and ensure that the data you analyze is always relevant and up to date. Not to mention that the whole analytics process is simpler and less prone to technical issues, which in return improves the customer experience.
Whatagraph excels in this visualization role as well.
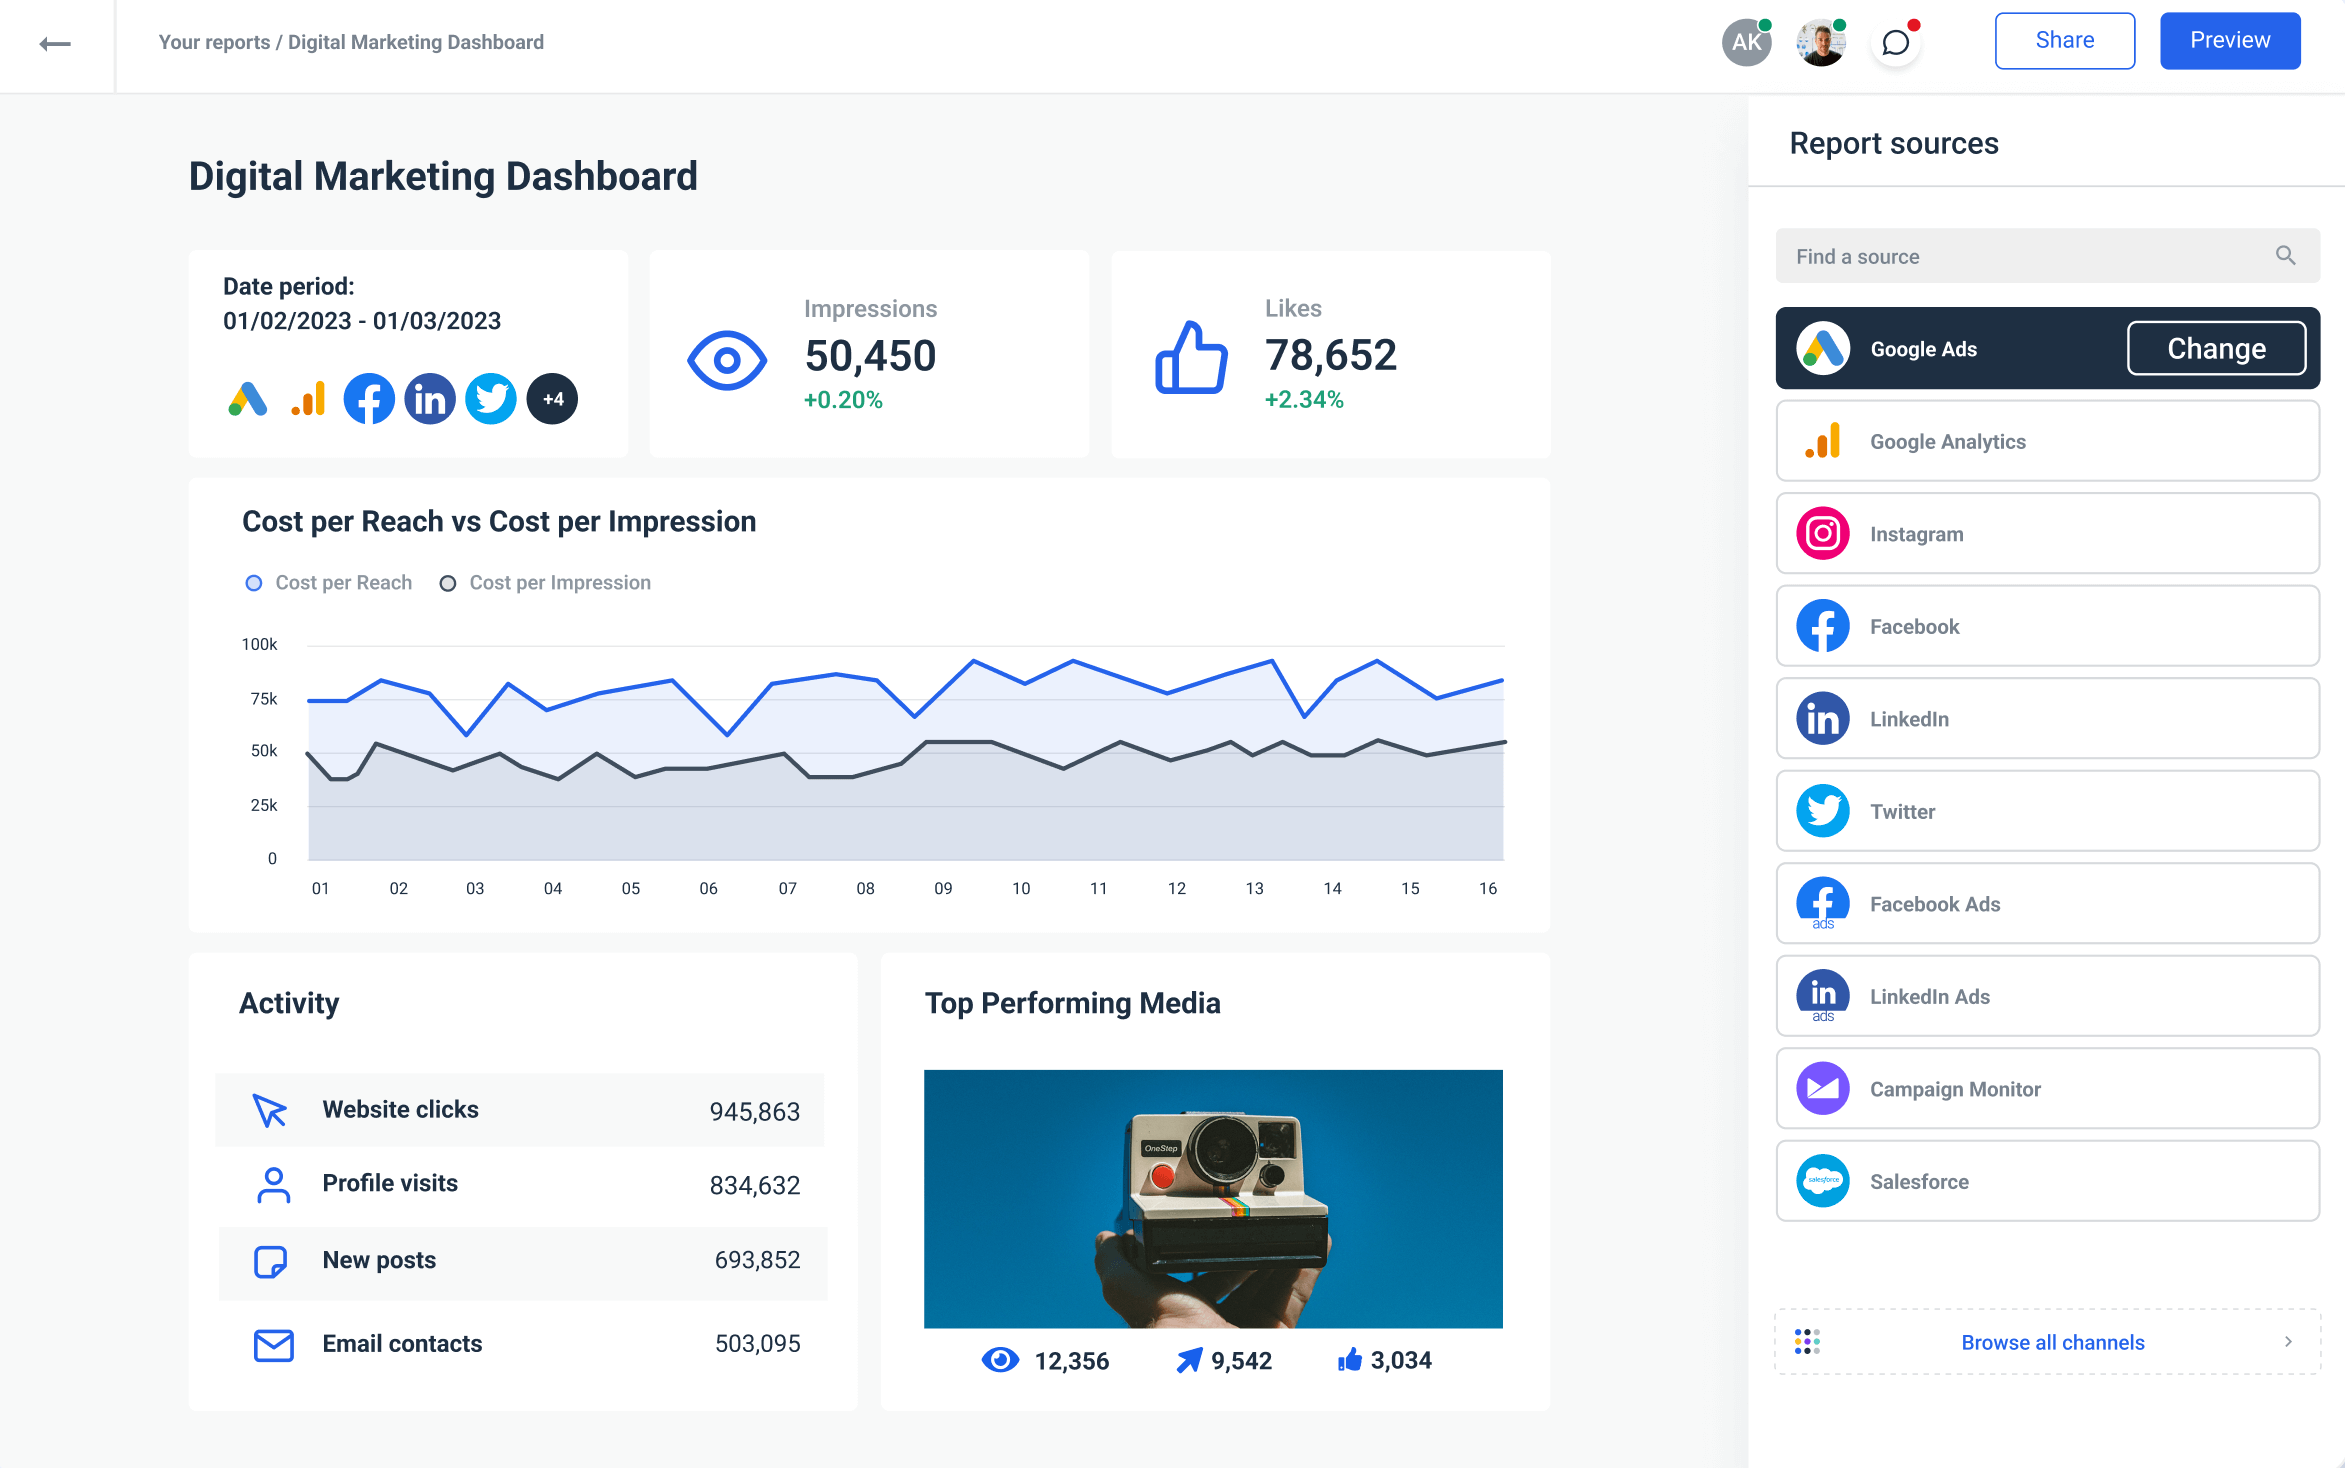
Once you connect the client marketing data, you can effortlessly build a marketing report or dashboard and present selected metrics from any of your client’s sources.
But what does “effortless” data visualization mean in Whatagraph’s case?
It means that you create every report using drag-and-drop widgets that conveniently stick to the grid for a neat and organized presentation.
You can set data sources for every widget you use, which allows you to create cross-channel marketing reports on the key metrics.
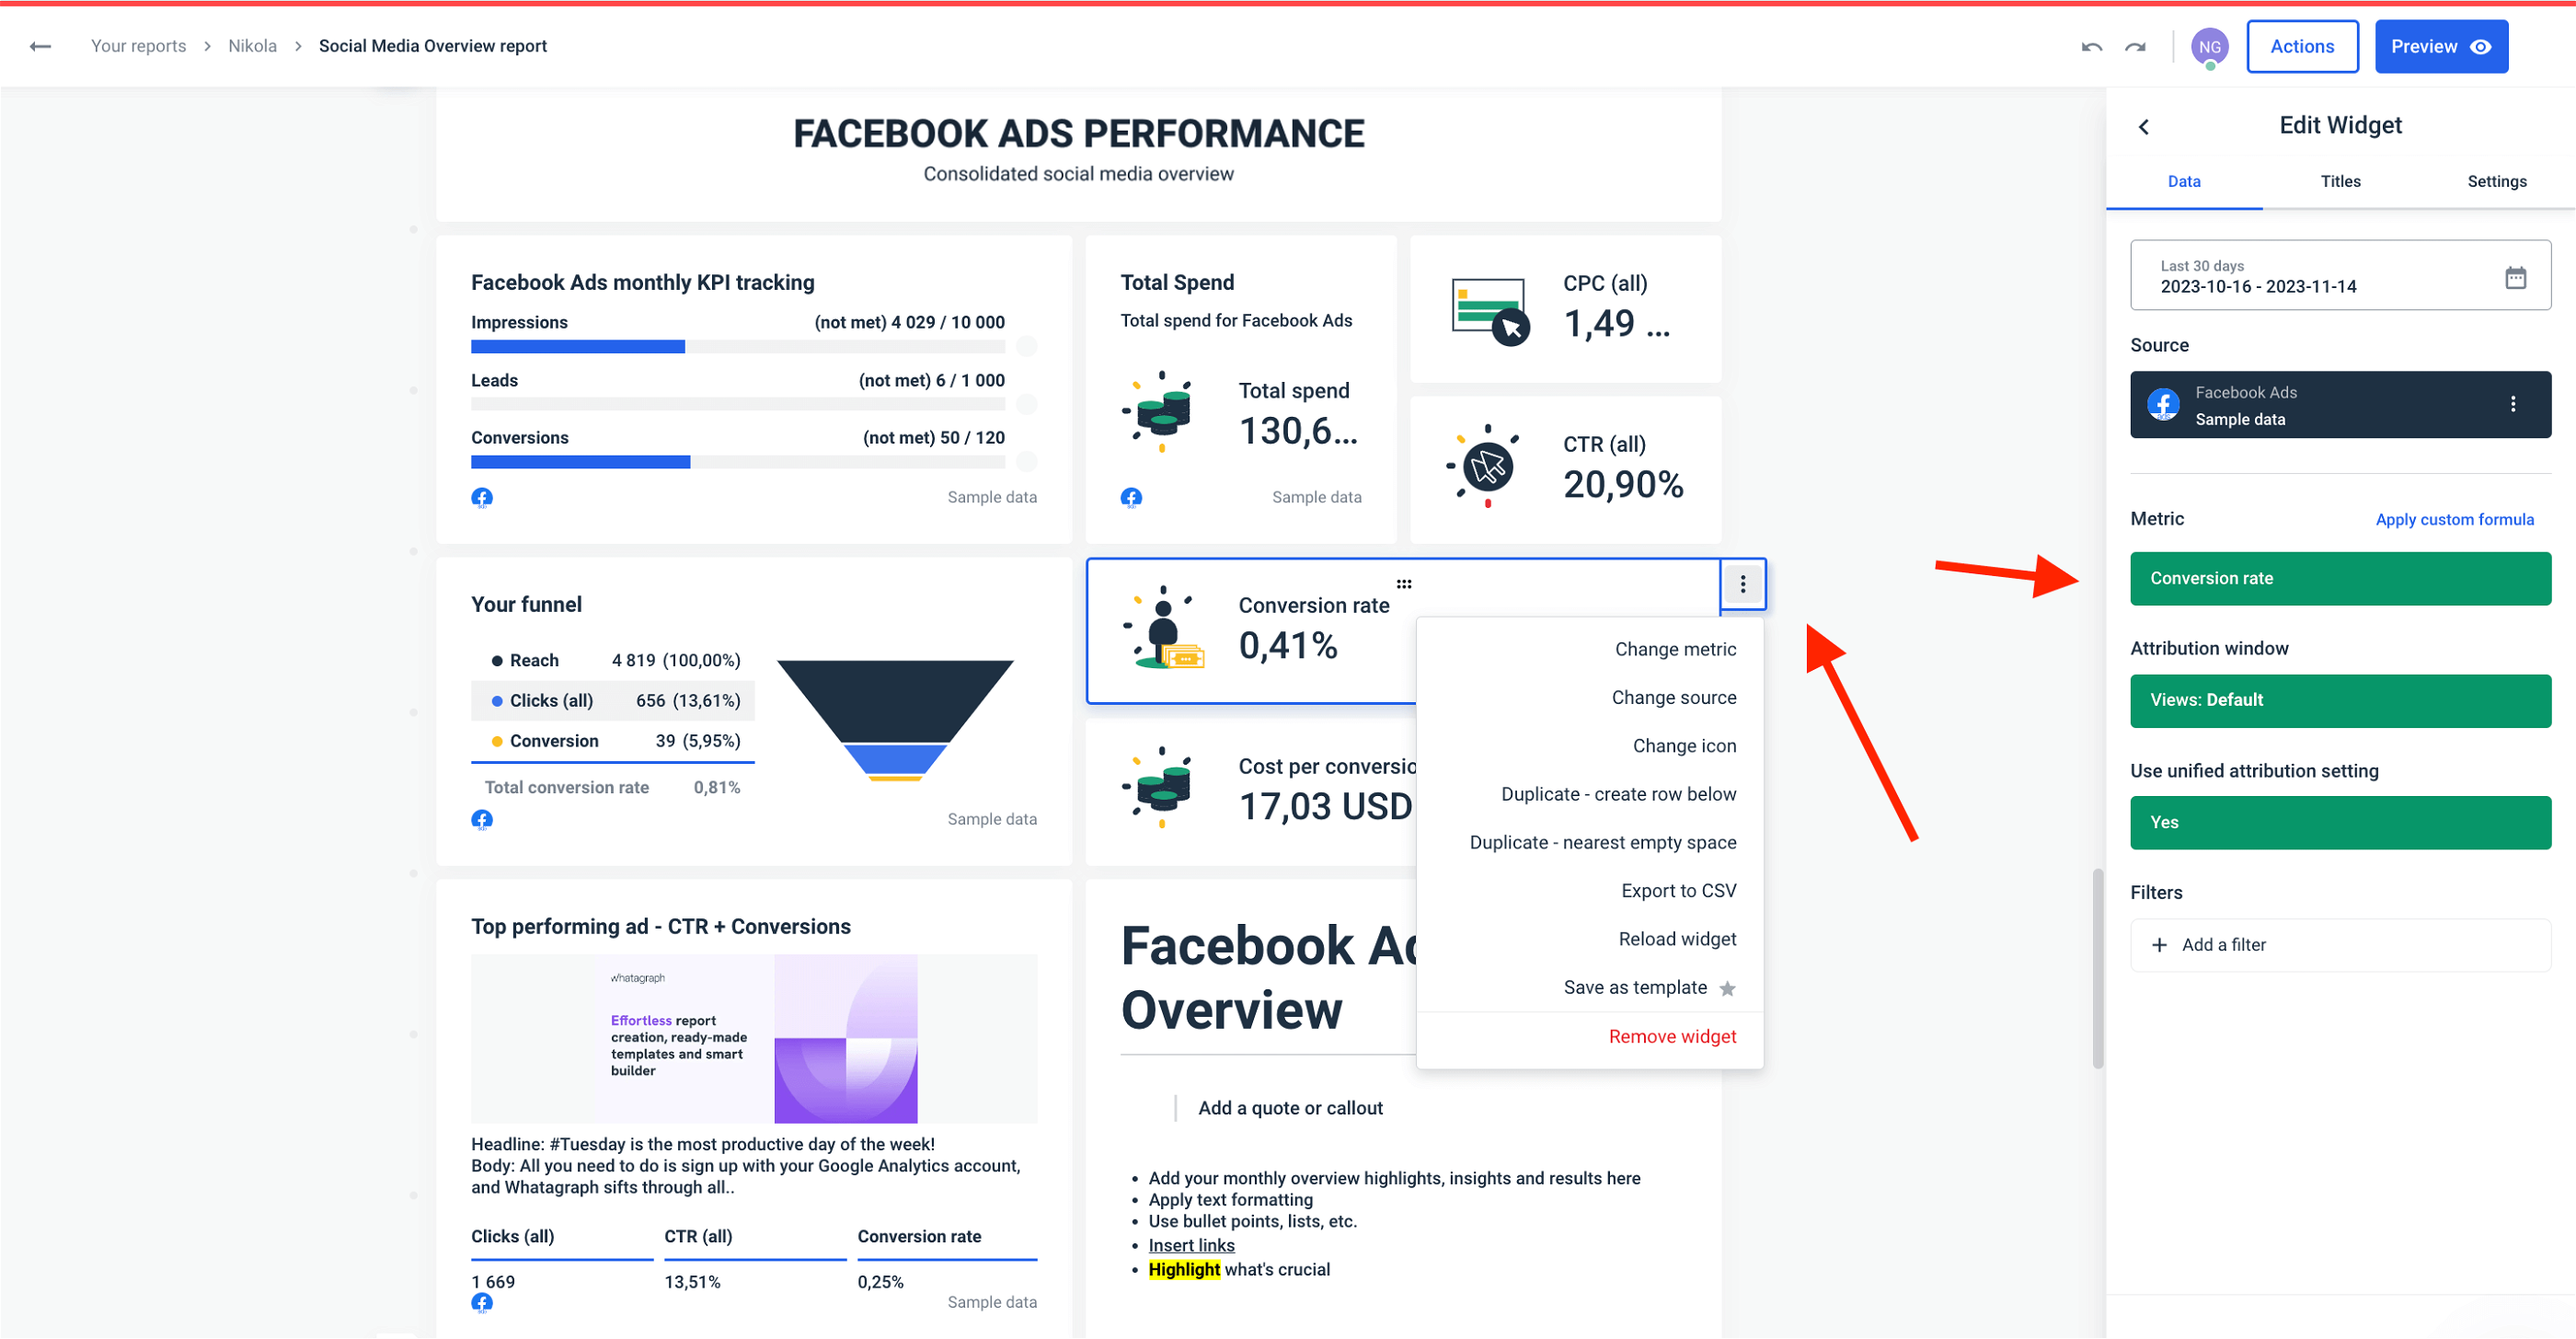
You can blend metrics from multiple sources within one widget to present combined values. Thanks to custom formulas, it’s also possible to create new metrics that aren’t available from the source API, and set filters both at a widget and source level.
Any new widget, formula, report, or dashboard can be saved as a template for future use.
Speaking of templates, we have a library of ready-made marketing report and dashboard templates for different use cases — web page overview, cross-channel PPC reporting, consolidated social media dashboard, Instagram Business, you name it.
There’s also a linked templates feature that is developed specifically for agencies in mind. Namely, you can create a “master template” and link all other report templates you create from it. This way, you can make bulk edits, as all the changes you make to the master template also affect the linked reports.
This Whatagraph feature is super convenient when you must change details for all the reports you create for a particular client.
Finally, you can rebrand every report with the client’s logo and a custom color scheme.
4. Report on findings
Once you visualize marketing data, you need to report the findings to your clients and, more importantly, suggest actions for improvement.
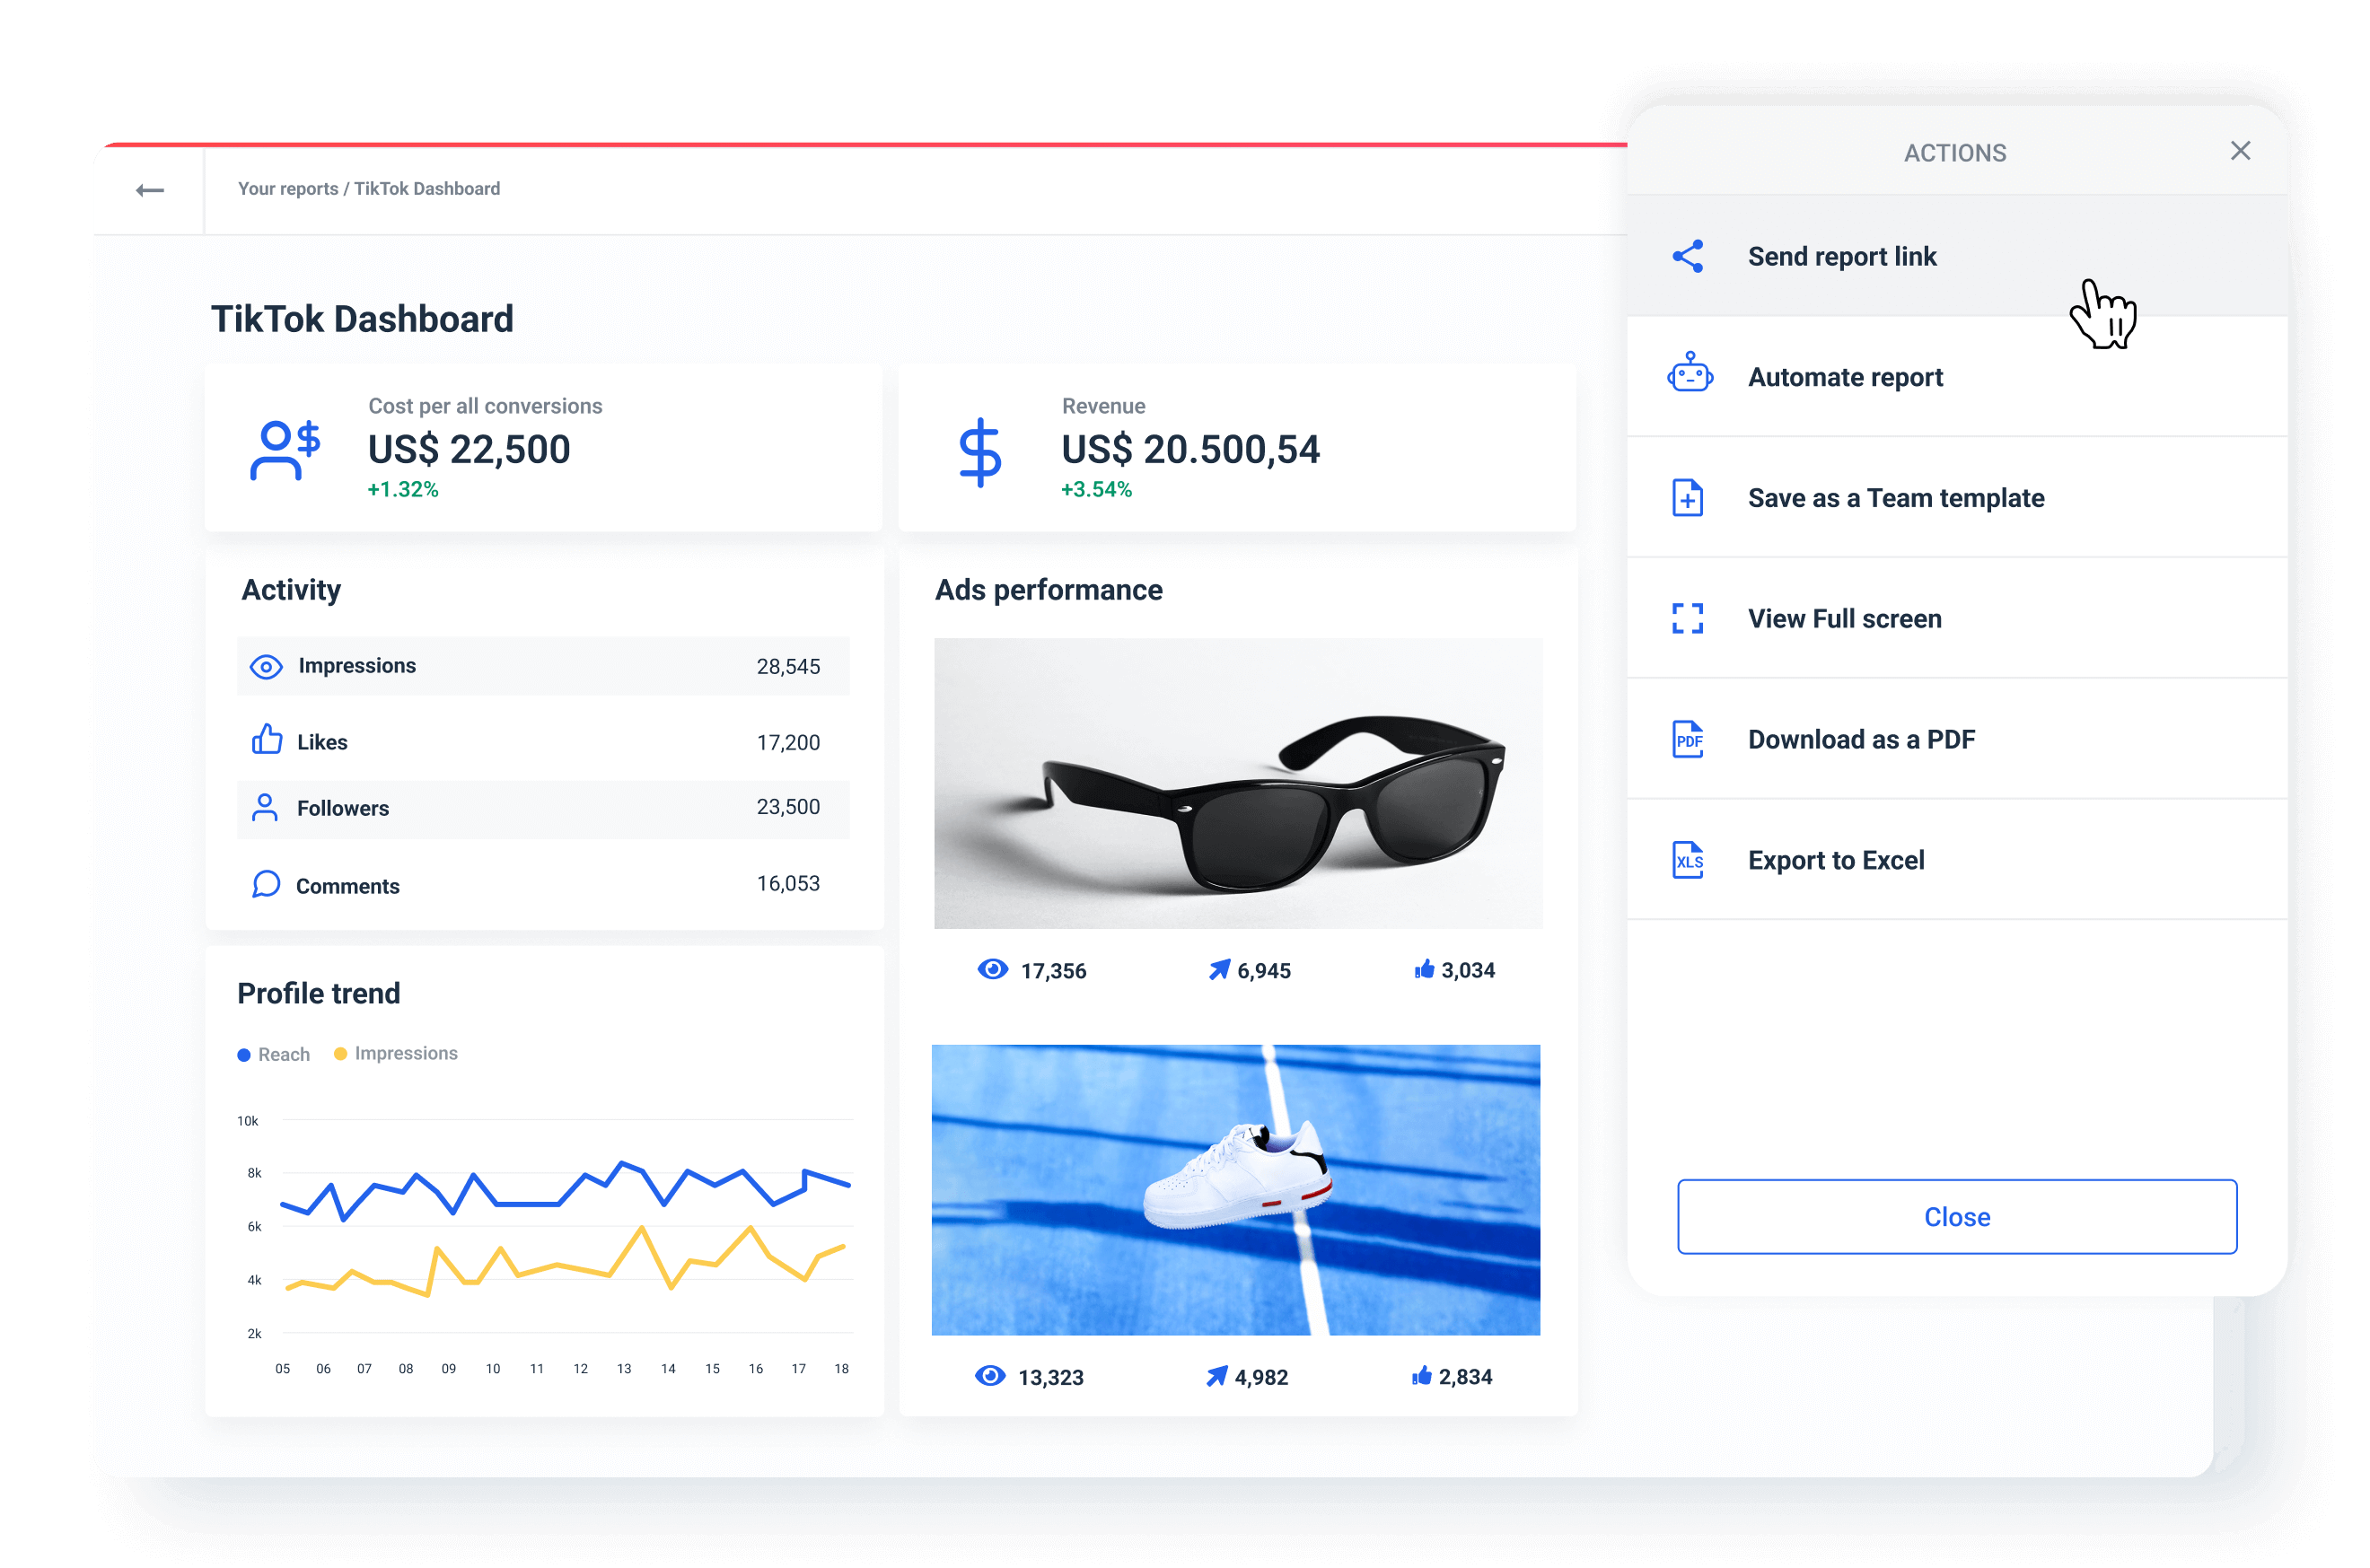
The traditional way is to export a report as a PDF document, attach it to a mail with typed recommendations, and send it to a few addresses in the client’s company.
But this method is both time-consuming and prone to human error, which is why we suggest you automate the report-sharing process as well.
To be honest, you’d be pressed hard to find a marketing data platform that makes report sharing easier and more convenient than Whatagraph.
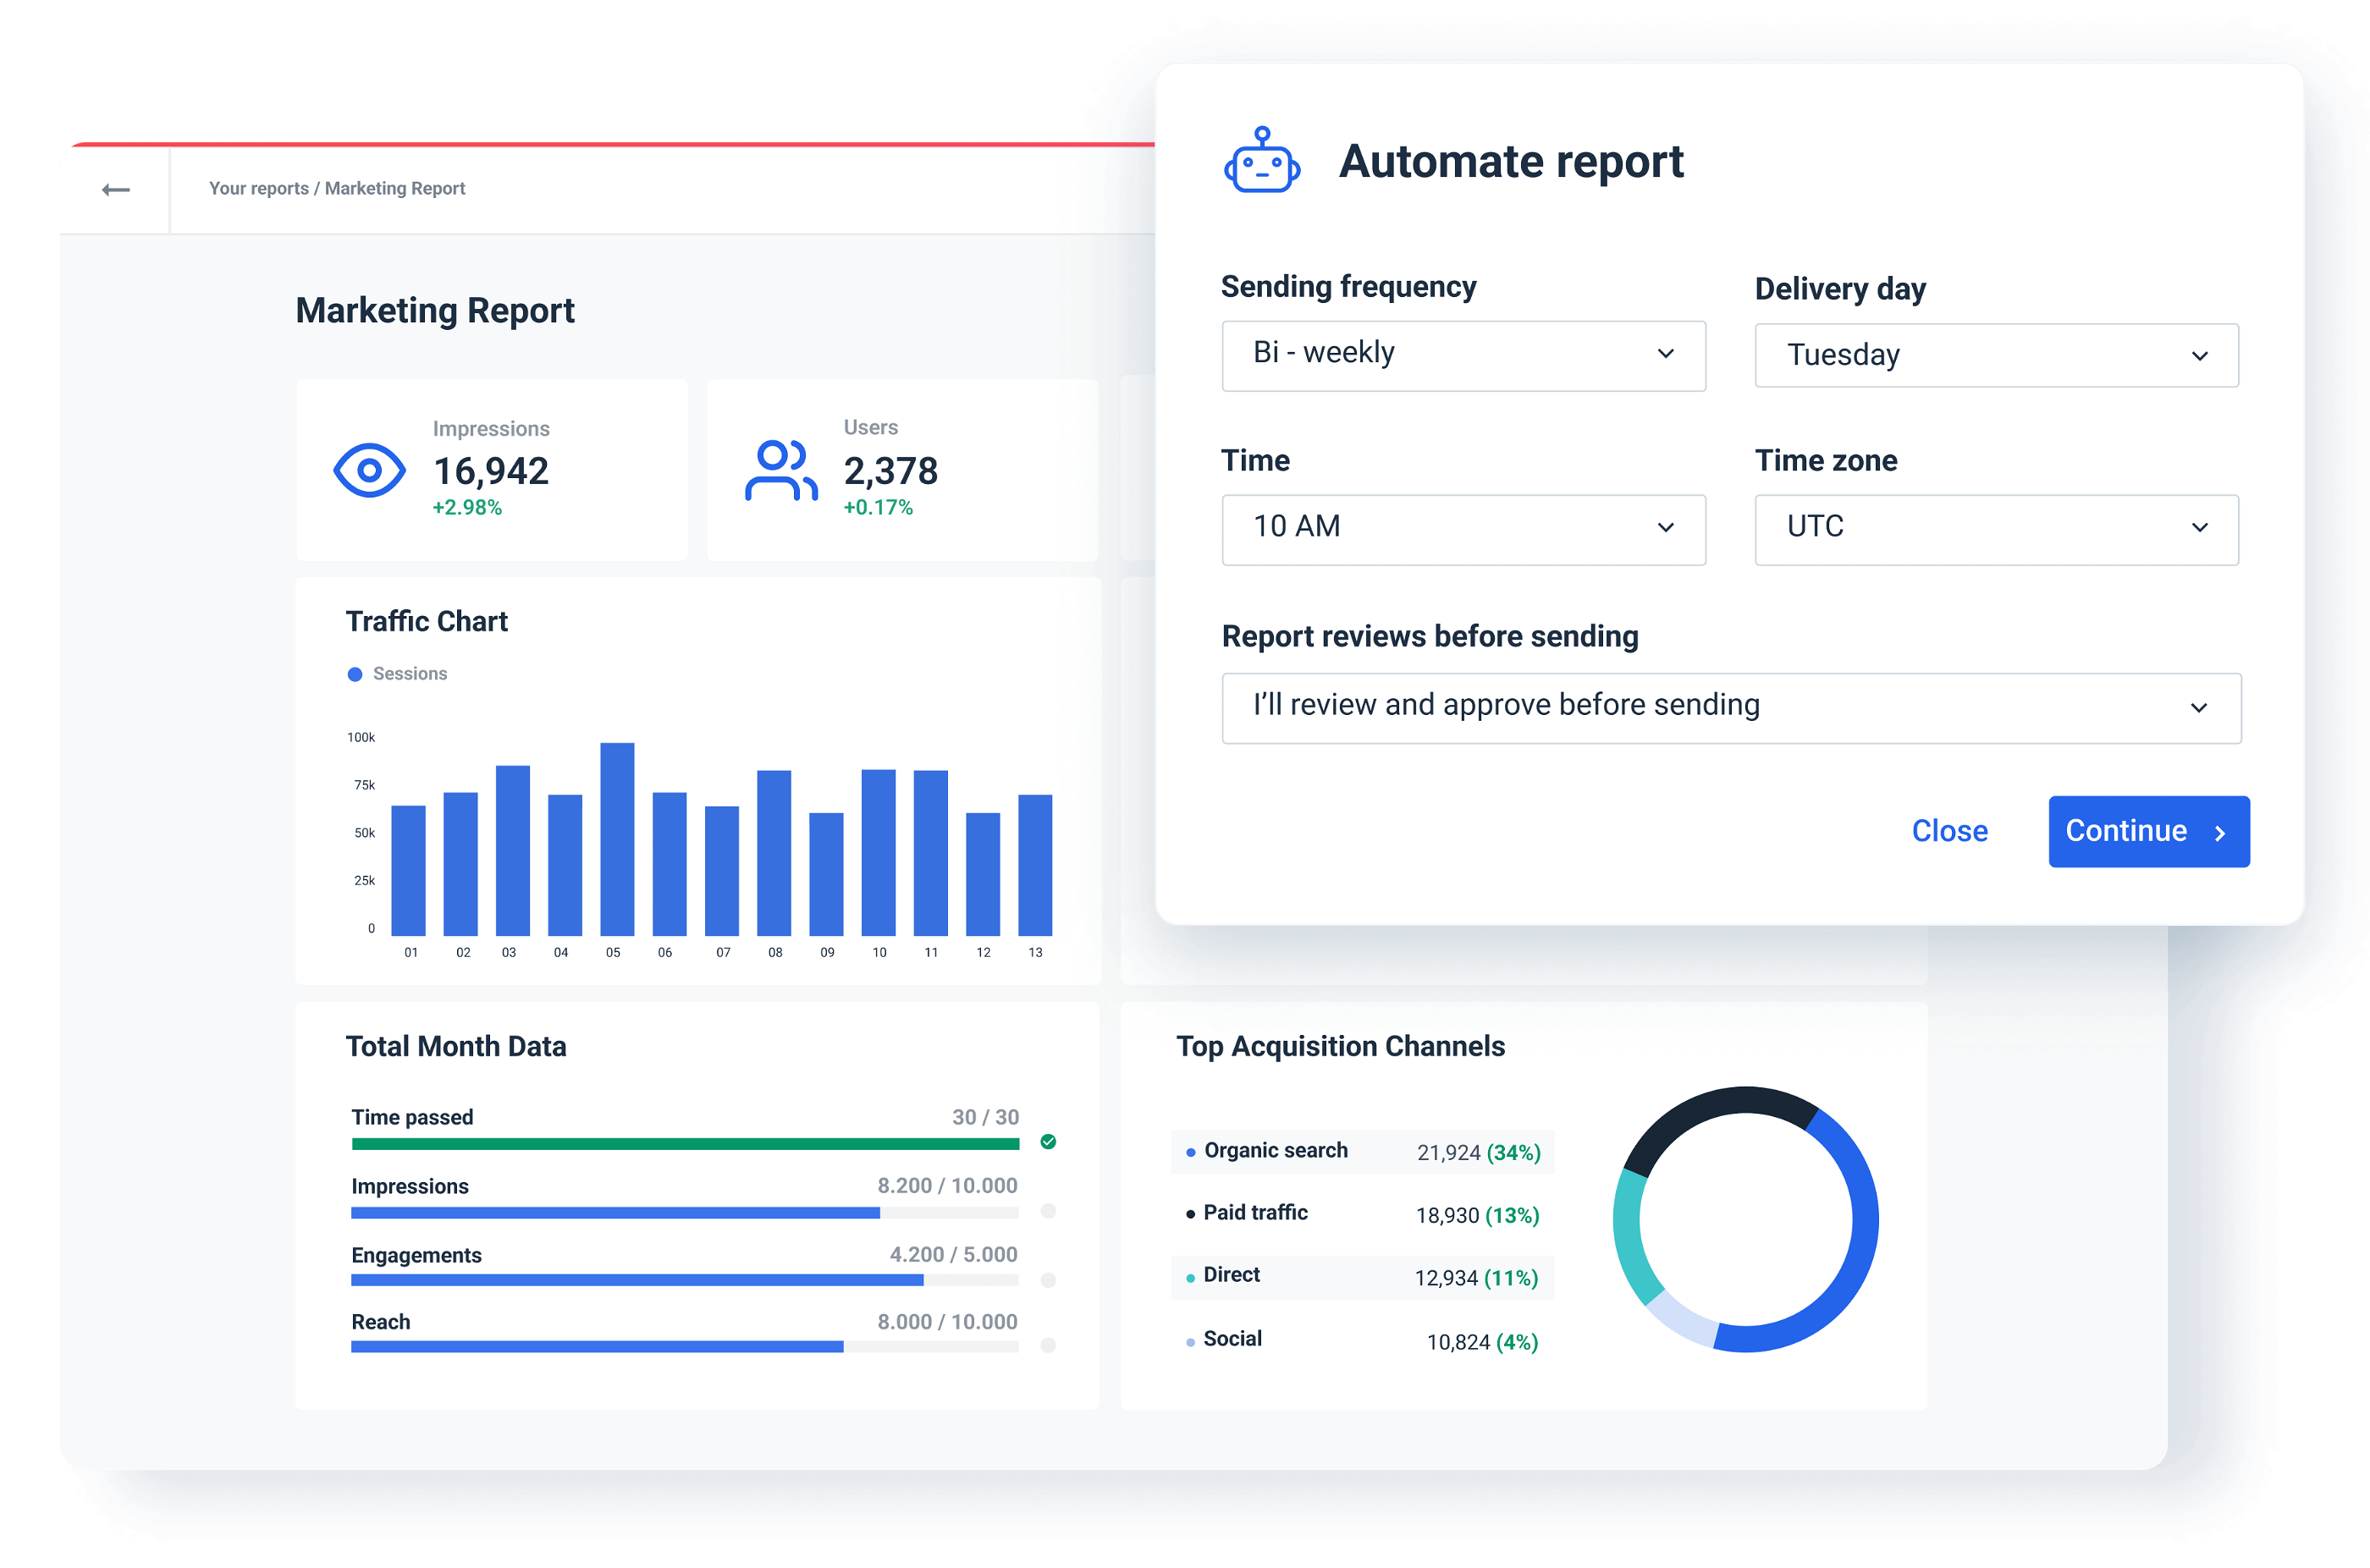
Simply add the recipient's addresses, set the cadence, and the delivery time for each report, and the client gets the exact report as discussed at exactly the same time every time.
Once you set up this process, it’s completely automated. However, you can add a review step where you get to approve every report before it goes out. But it’s not just about approving. Even in this step, you can change metrics manually and add personal comments to each of the report sections.
Of course, you can still export and save any report as PDF, but there’s no need to do it manually.
Another way you can share a Whatagraph report or dashboard is via a live link. This means your clients can always check the stats in dashboards you created for them, as data updates automatically in near-real time.
This increases your accountability and transparency as an agency because you’re letting clients see unaltered results every time and even change the data range themselves to see how results have changed over time.
Wrapping up
Marketing data analytics largely depends on an agency’s ability to connect scattered marketing data sources and secure fast and reliable data flow, visualize cross-channel data, and get insights in front of decision-makers on time.
Marketing agencies that master all three marketing activities gain a competitive advantage over agencies that depend on multiple analytics tools or manual data collection.
Whatagraph provides that competitive advantage by offering one platform to:
- Connect scattered data from multiple sources – quickly and hassle-free,
- Visualize data from connected marketing sources as engaging marketing reports,
- Share those reports via automated emails or on-demand live links.
The results:
- Minimal manual work and the possibility of human error,
- Accurate and timely analysis of marketing campaigns you’re running for your clients,
- Increased client engagement and trust in you as an agency.
If you’re an agency struggling to analyze marketing data, want to scale and keep the same quality of client service, or simply automate much of marketing data processing, try a free trial of Whatagraph. Save time on analytics and use it for more creative tasks.
Published on Nov 22 2023
WRITTEN BY
Nikola GemesNikola is a content marketer at Whatagraph with extensive writing experience in SaaS and tech niches. With a background in content management apps and composable architectures, it's his job to educate readers about the latest developments in the world of marketing data, data warehousing, headless architectures, and federated content platforms.