8 Essential Marketing Data Sources You Need to Monitor
Marketing teams are analyzing more customer data, business data, and third-party data than ever before, which inevitably leads to many innovations in data gathering and processing methods. In other words, if your job description didn’t include collecting marketing data, it might soon.

Nov 08 2023●7 min read


Marketing success begins and ends with data
If you’re reading this, I hope you’re already using data to measure past success. You evaluate campaigns and create reports to document your ability to ride the current marketing trends toward your business goals.
However, marketing data is equally valuable for planning future marketing campaigns. Still, for omnichannel campaigns to work, you need more content in more places, and the number of digital marketing data sources you need to cover keeps growing every year.
All this makes it difficult to know what types of data and how many marketing data sources you need.
As your marketing budget for 2024 is awaiting approval, it’s a good time to review marketing data sources you’ve used or may use in the next quarter.
These marketing data sources range from quantitative data sources that present hard-to-beat figures to qualitative data you may not even realize you’re collecting.
In this article, we’ll review some of the best places to collect data and what to look for when analyzing that data.
Quantitative marketing data sources
Google Analytics 4
Google Analytics 4 has everything you need to kick off your data-driven marketing strategy. It gives you information on your web traffic and conversions on your website, as well as app data.
What to look for in Google Analytics 4?
Google Analytics 4 collects an overwhelming amount of marketing stats, but what you should focus on the most is:
- Traffic sources,
- Engagement rate,
- Pages with the highest views.
Analyzing traffic sources can also streamline your marketing planning. If, for example, social media performs better than emails or PPC, you should increase the ad spend on socials rather than spreading your budget across multiple channels that don’t hit the target.
Engagement rate is a good metric for detecting if any of your website pages are underperforming and could use an update or refocusing. For example, if the number of engaged sessions is low on a landing page with display ads, you may need to rethink headers and messaging, as well as make the visuals more engaging.
By analyzing high page views, you can shape next year’s content marketing strategy on those pages. This can help you increase a target demographic that is already coming to your website.
With Whatagraph’s native Google Analytics 4 integration, connecting and analyzing your clients’ GA4 data becomes a breeze:
- Step 1: Chose a Google Analytics 4 report template,
- Step 2: Add the client’s account,
- Step 3: Take insights from visualized data.
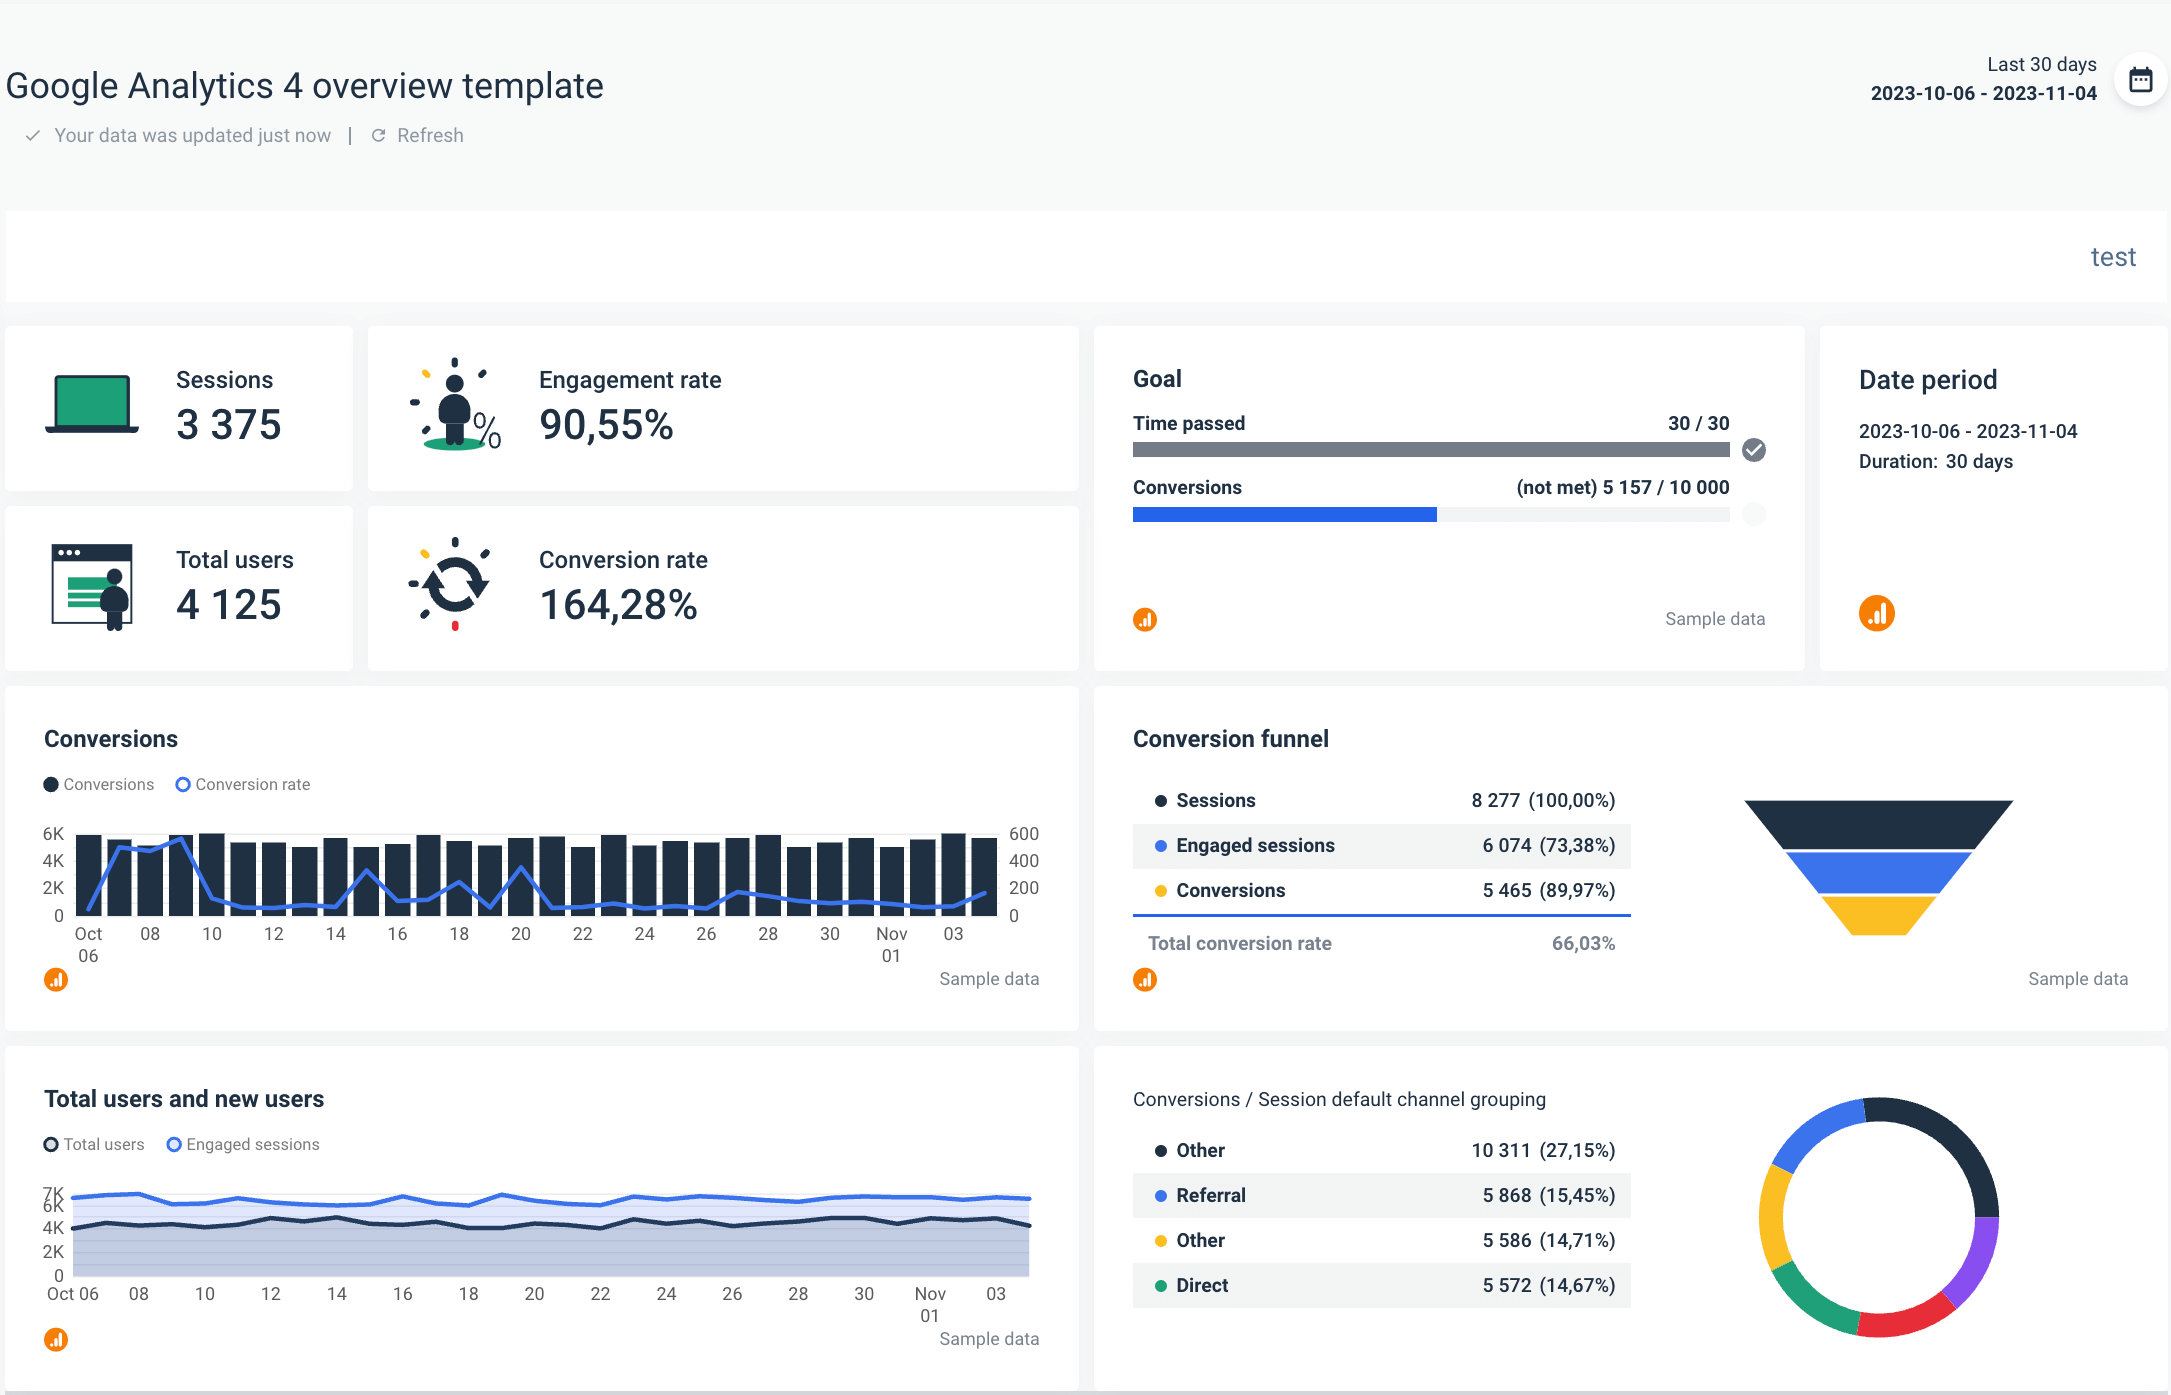
You can use one of Whatagraph templates, or create your own GA4 report from scratch using drag-and-drop widgets as building blocks and specifying metrics and filters for each widget.
Advertising platforms
When it comes to creating content for your paid ads on Google or social media, your primary metric is conversions. If the conversion rate is nowhere near your goal, you should revise your ad copy or visuals to launch more compelling content.
For example, you can also use a Google Ads report template to identify and research high-performing keywords, which you can use for search engine optimization.
But what does high-performing mean in this case?
- Good conversion rate on the website,
- A high number of clicks,
- Good click-through rate.
If these keywords are expensive, you should also use them in your strategy and try to rank for them in organic search.
Paid ads on social media can also provide valuable insights into lead generation and marketing activity for each ad you deploy for your client. On Facebook Ads, for example, some of the most relevant data points include:
- Return on ad spend (ROAS),
- Impressions,
- Clicks,
- Post engagement.
ROAS is a powerful indicator if you’re trying to maximize spending efficiency, especially for clients with large amounts of ad spend. But other metrics like impressions (the number of appearances in users’ feeds) and clicks can provide additional context.
Post engagement is another valuable piece of data to keep an eye on, as it can tell how popular or interesting your ad content is. Posts with low engagement are best deleted or reworked since the current content doesn’t resonate with your target audience.
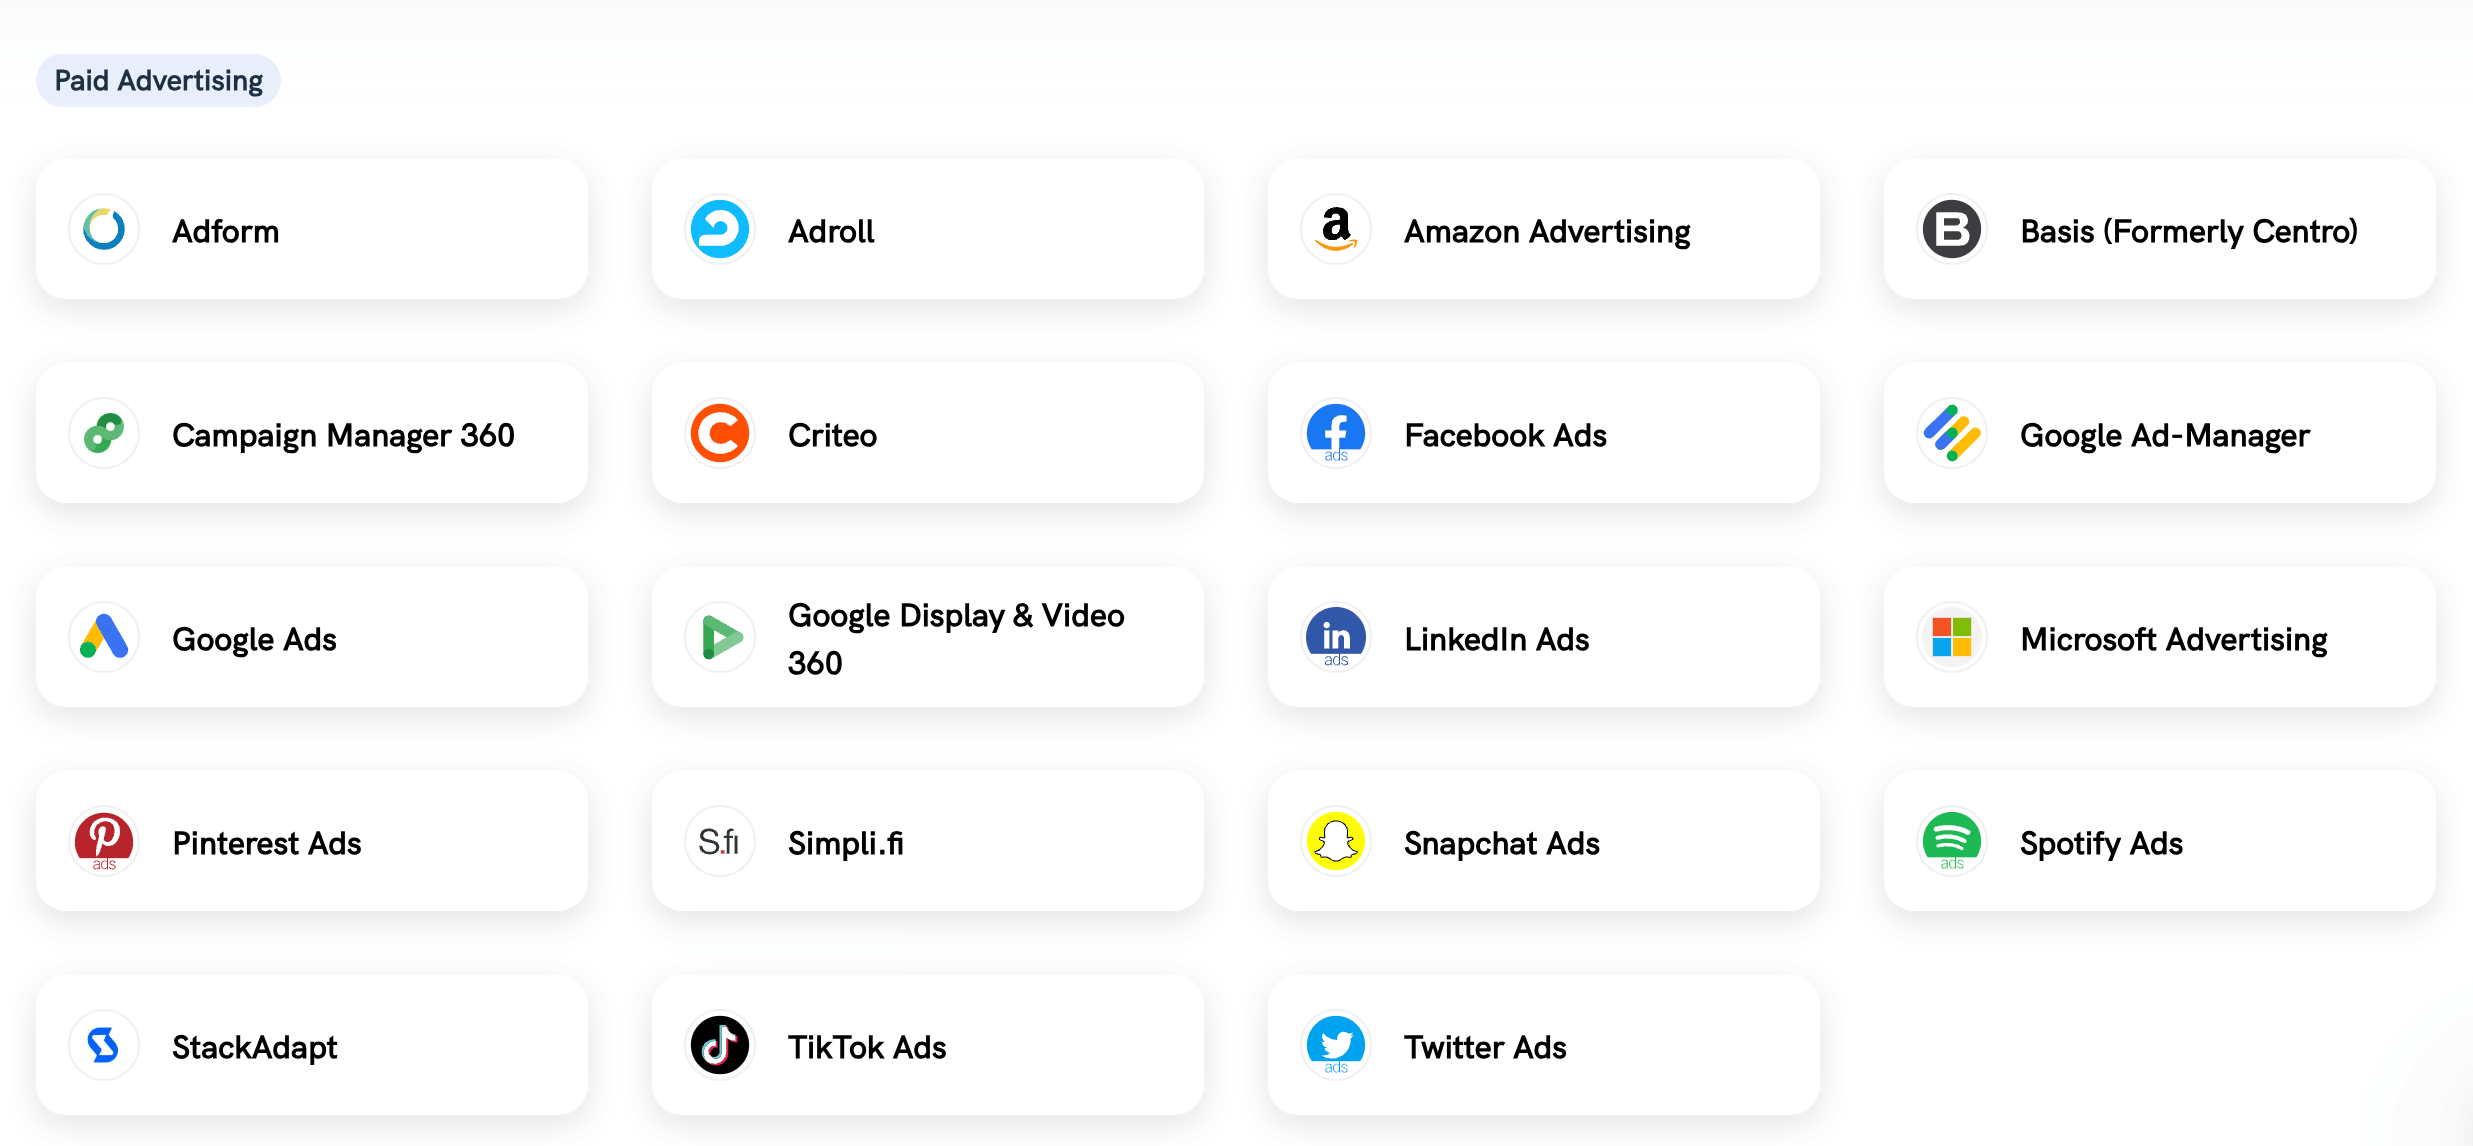
Whatagraph allows you to effortlessly connect data from advertising channels such as Google Ads, Facebook Ads, LinkedIn Ads, and Amazon Ads, and compare the performance in a cross-channel view.
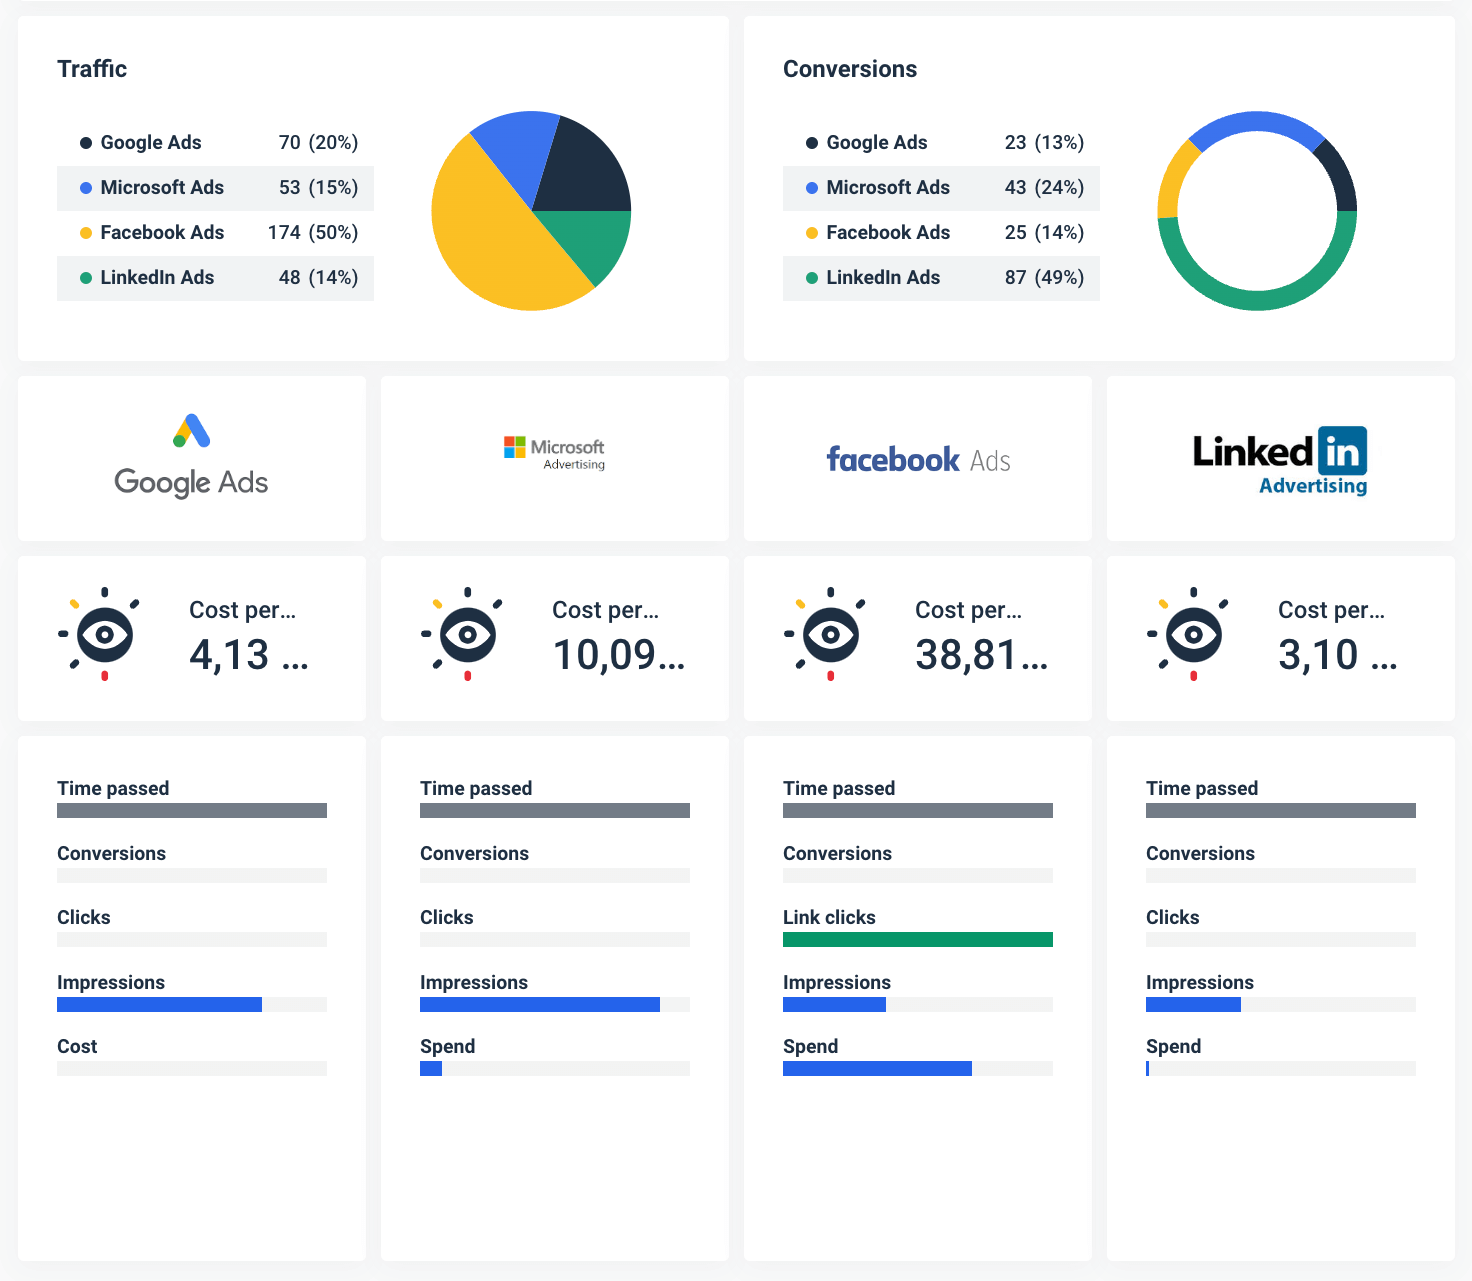
A detail of a Consolidated PPC Report created in Whatagraph
Social media
Social media are critical for advertising, but also for feeling the pulse of the customers and increasing the reach, trust, and advocacy. Agencies that monitor their clients’ brand mentions on social media can achieve even better results than with regular ad campaigns.
Develop a quick response methodology for different brand discussions, including reviews. Product questions, and even customer complaints. This way, the customers feel heard and appreciated.
You can also use social media to monitor what users say about your competition and use those insights in your next marketing strategy revision.
But without the right tool to monitor all social media, you might miss many opportunities.
Whatagraph allows you to collect marketing data from all popular social media channels and present insights in cross-channel reports.
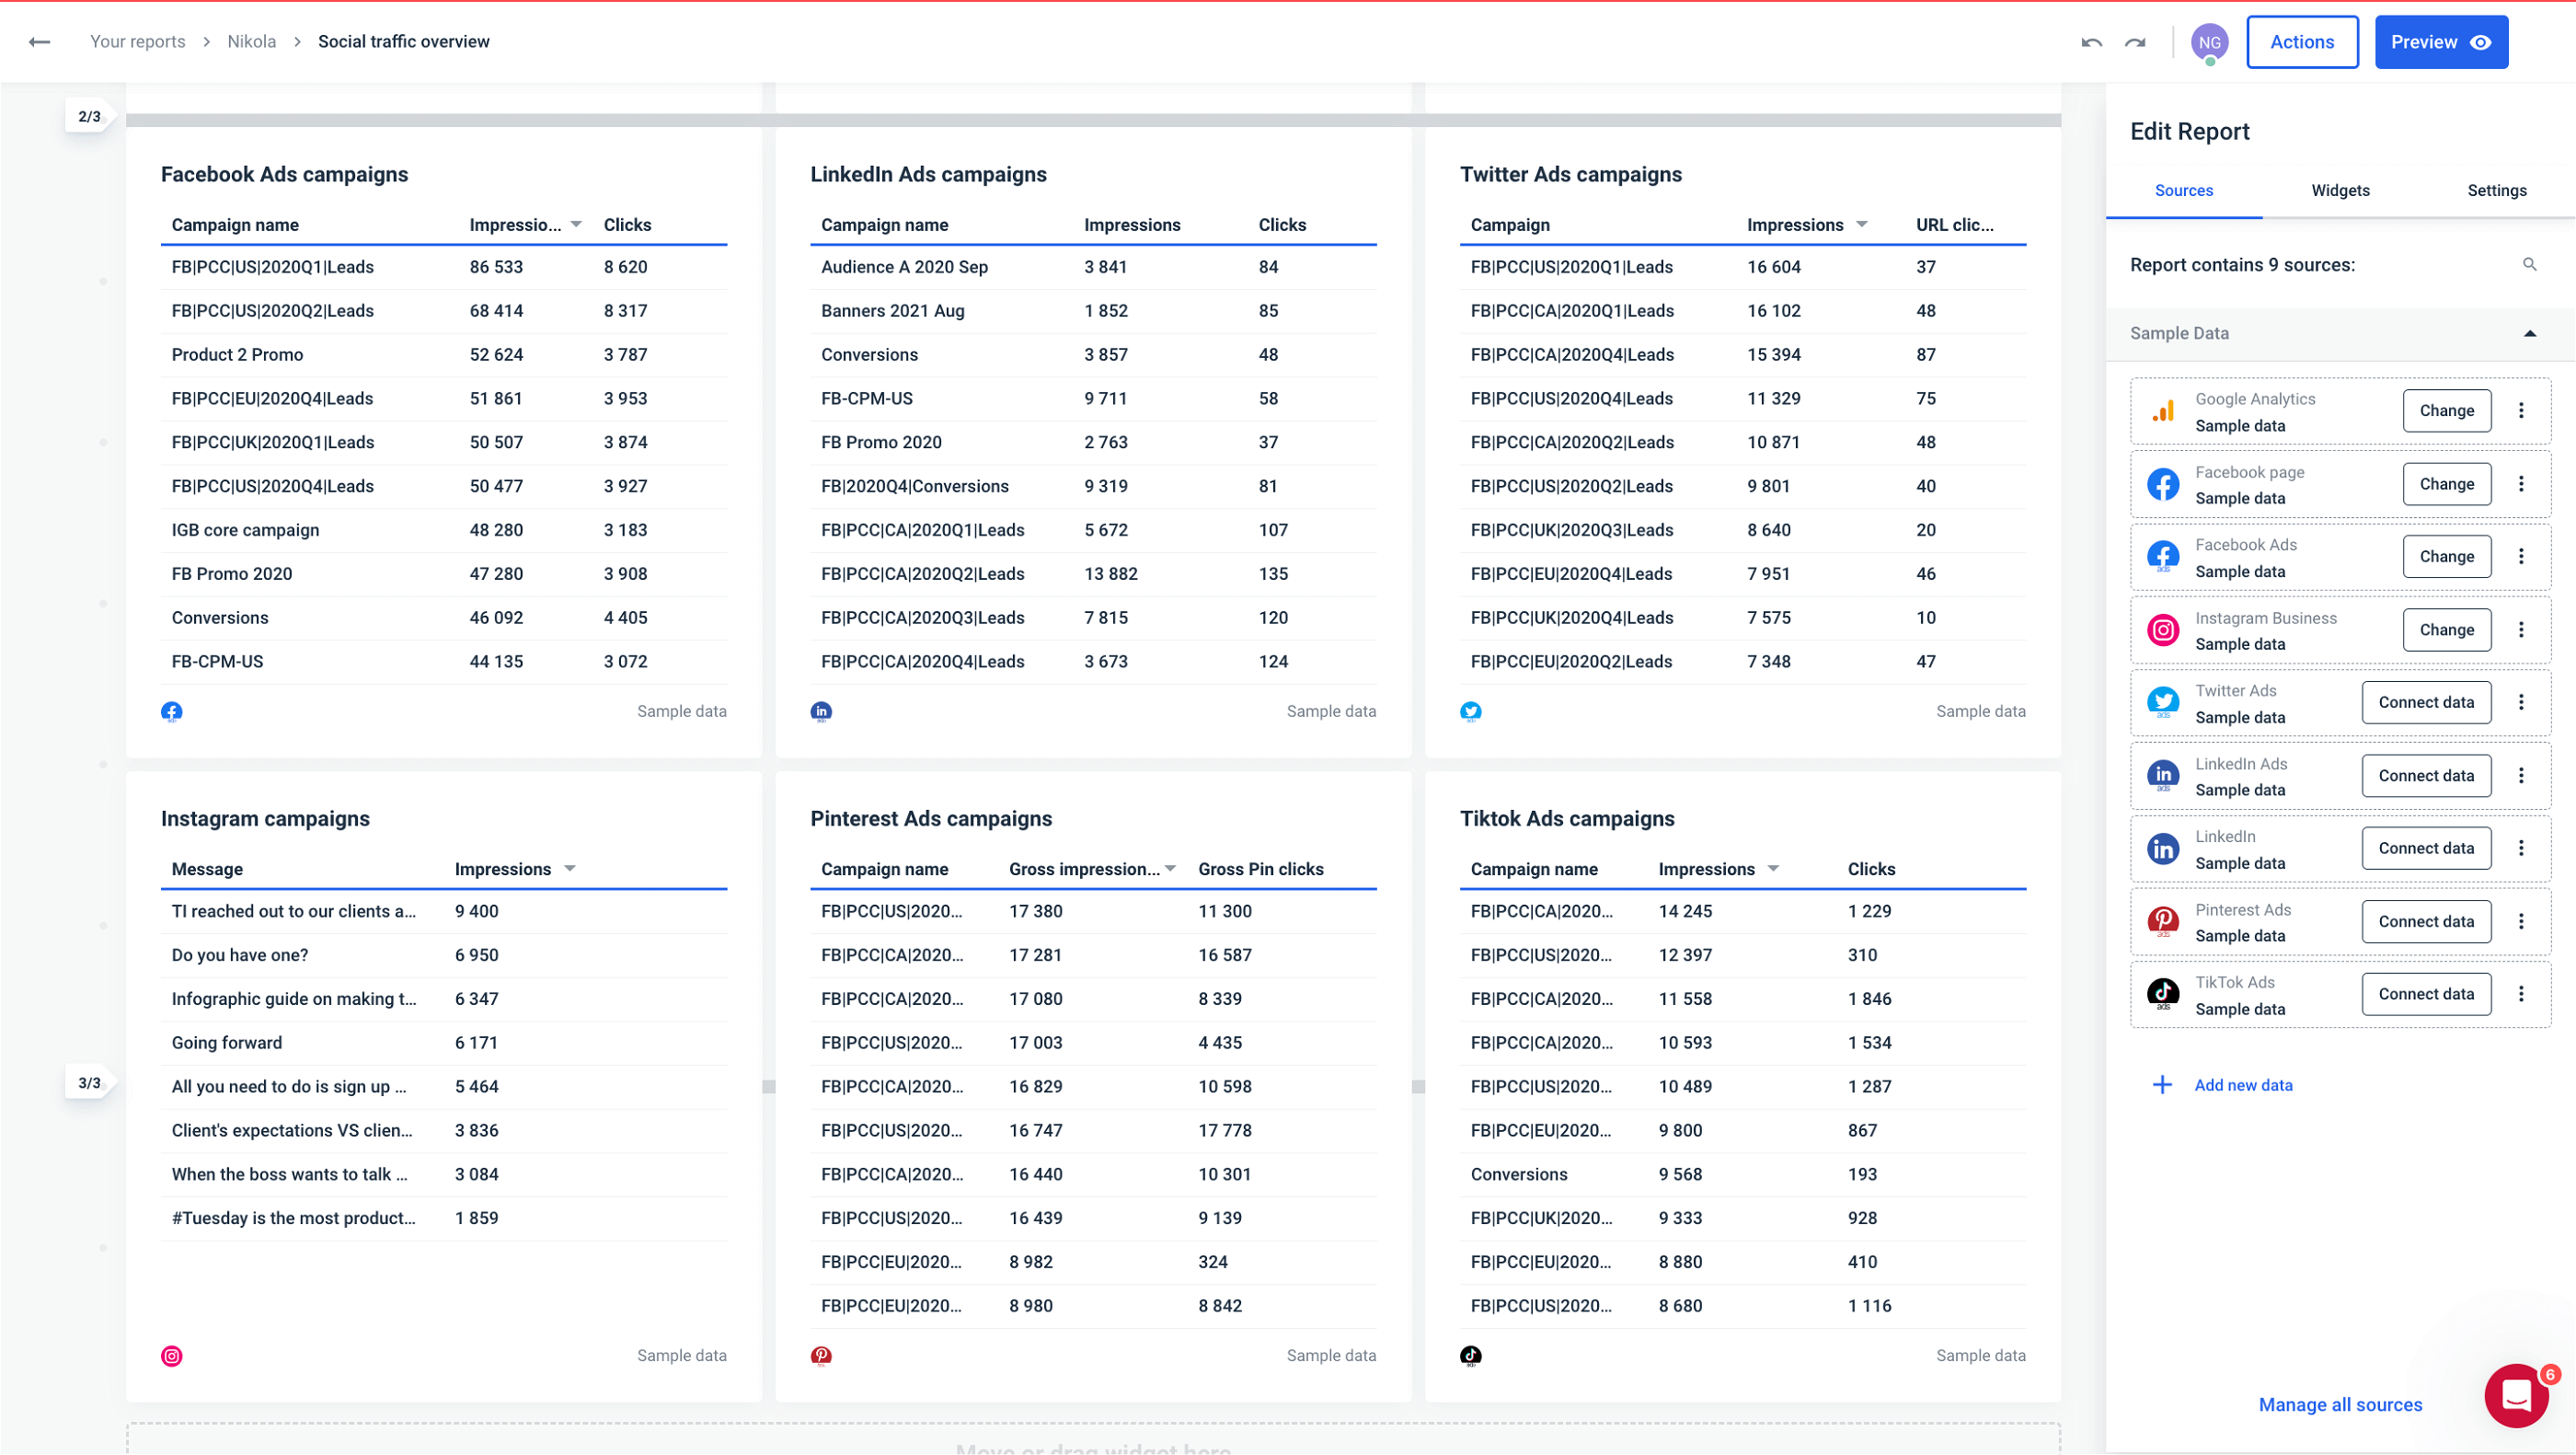
A detail of a Social Media Overview Report created in Whatagraph
With all social media accounts in one overview report, you can easily track the performance of individual channels or create a multi-source table to compare the metrics of choice for individual posts.
Google Search Console
If you’re not an SEO expert, Google Search Console could appear too technical, but it’s not that difficult to learn the basics and monitor metrics like:
- Core web vitals,
- Page indexing,
- Performance overview.
The core web vitals report reveals the speed performance of your pages: good, needs, improvement, and poor. However, speed isn’t just an SEO ranking factor — it’s also essential for the overall customer experience. If you see a lot of poor URLs, you need to create a ticket and get them improved as soon as possible.
The page indexing report tells you if Google indexes your pages, while the performance overview gives you the search queries you appear in.
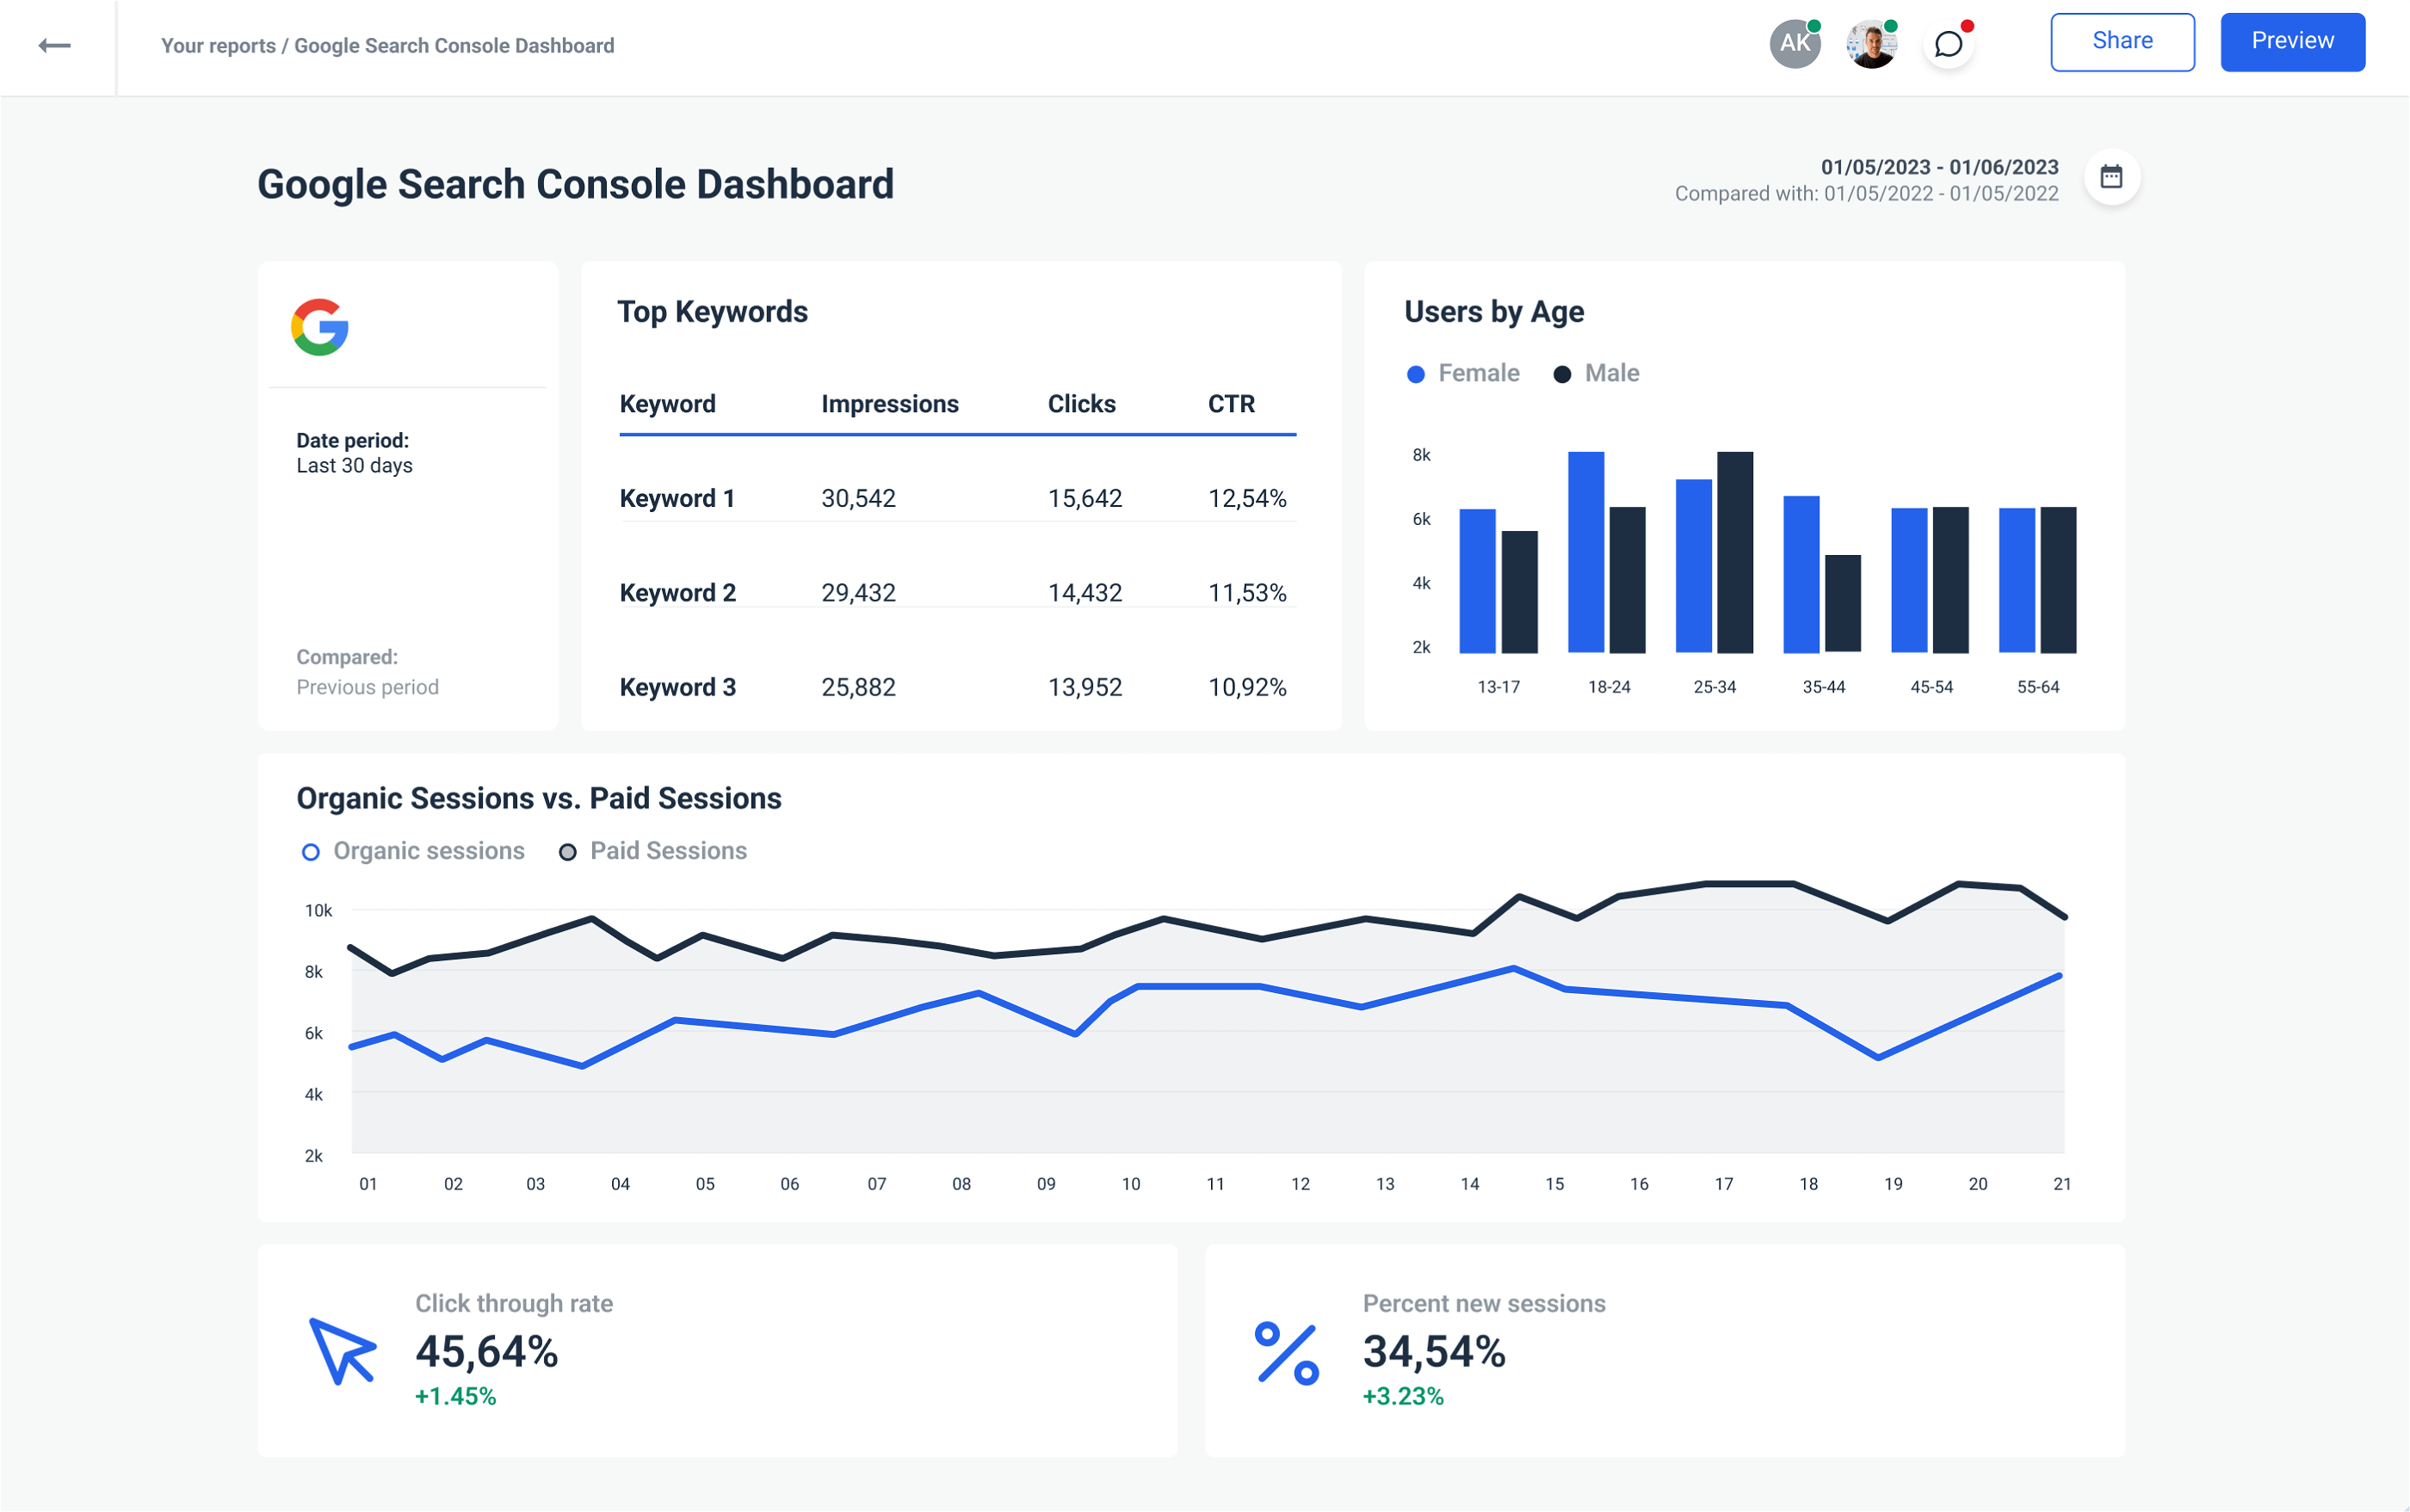
Thanks to native integration with Google Search Console, Whatagraph allows you to connect this source data in a few clicks and create an SEO overview with your critical engagement metrics.
CRMs
Customer Relationship Management tools are a valuable source of marketing data. They hold all the essential customer datasets in one place to help you understand conversions and analyze customer interactions.
What to look for in CRMs?
- Time to close,
- Deal value,
- Time to respond to support tickets.
Combined with information on which channel customers were acquired and their lifetime value, these insights can help you optimize future campaigns and calculate hard-to-get KPIs such as the ROI of your marketing.
Now you can round up your marketing efforts by including data from your HubSpot or Salesforce account in any report created in Whatagraph — quickly and painlessly.
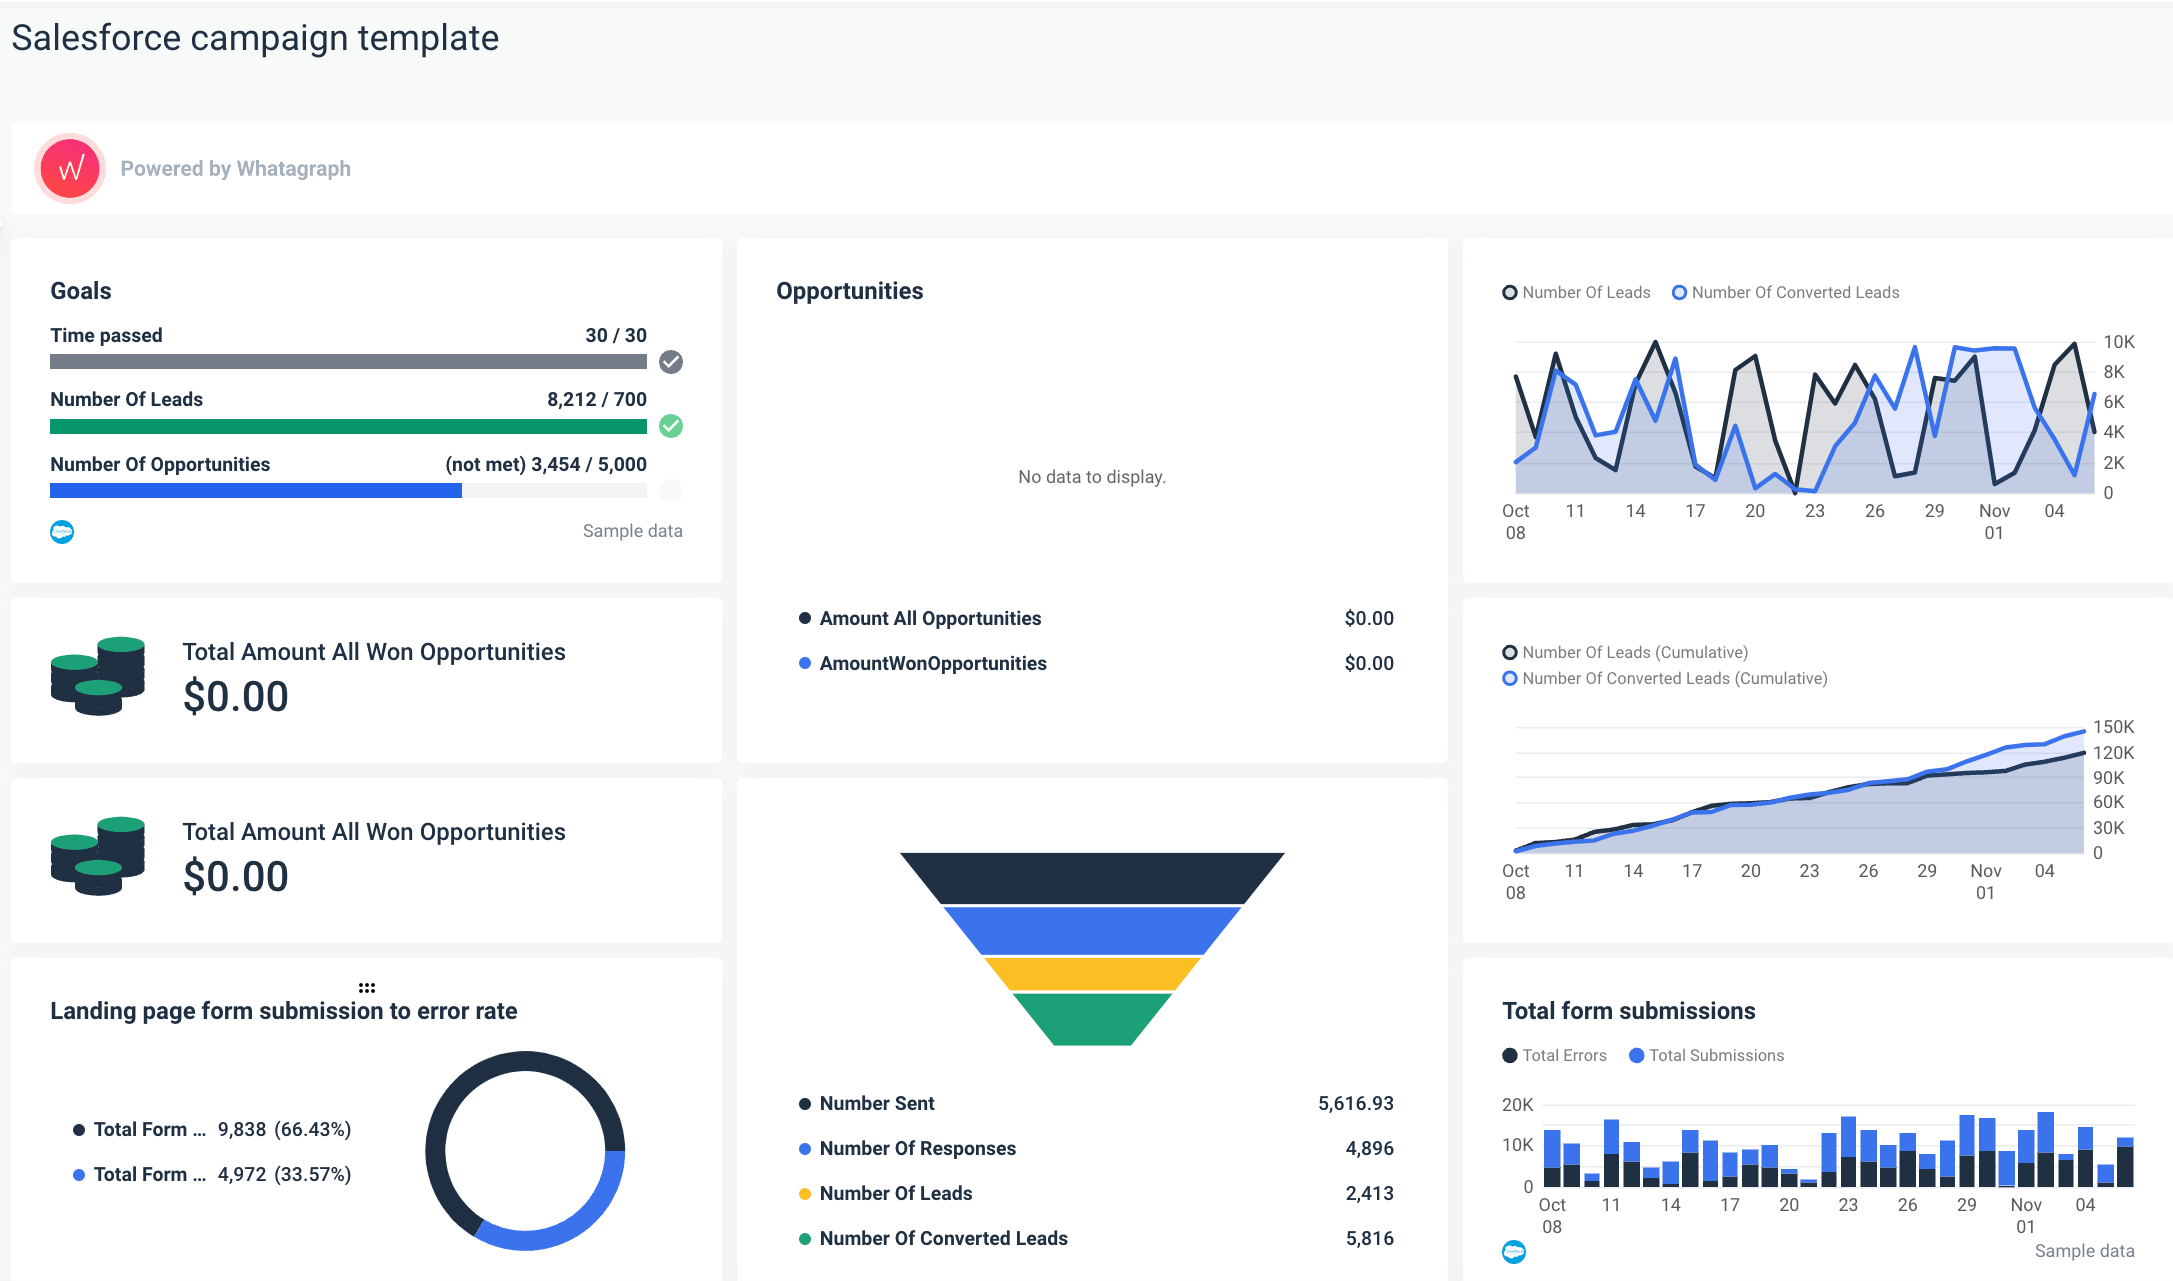
A detail of a Salesforce Campaign Report created in Whatagraph
Qualitative marketing data sources
In addition to quantitative marketing data from the previous examples, qualitative data from your sales and support teams is just as important for gaining new insights and creating a data-based marketing plan.
Insights from sales development representatives
You may do your marketing research, but your sales development representatives (SDRs) speak to customers all the time, which makes them a valuable source of market intelligence.
What insights to look for from SDRs?
Start by asking questions like:
- What was the focus of a recent inbound call with a prospect? What challenges were they trying to solve?
- What was the last prospect that you had an easy time closing? What was the problem that the person was trying to solve? Why did the prospect choose to sign?
- What would you say are our advantages over the companies we compete with?
Speaking to sales representatives to determine customer pain points allows you to understand what unique selling points are most appealing to certain prospect groups. With those insights in hand, you can focus on those unique selling points in your messaging.
Sales call data can also help you separate different customer groups. Audience segmentation makes it easier to find more engaging examples for marketing campaigns.
By talking to people who actually speak to your customers, you can understand the quantitative data you’re gathering and have a more complete picture of your prospects and their industry.
Insights from technical support
Your support team has deep knowledge of your product’s pain points, which makes them a great source of potential marketing data.
The data you get from your customer support team can contain technical issues customers experience with your product or website. This information helps you understand what messaging to underline and what to avoid if, for example, a feature is not yet fully developed and may lead to a negative user experience.
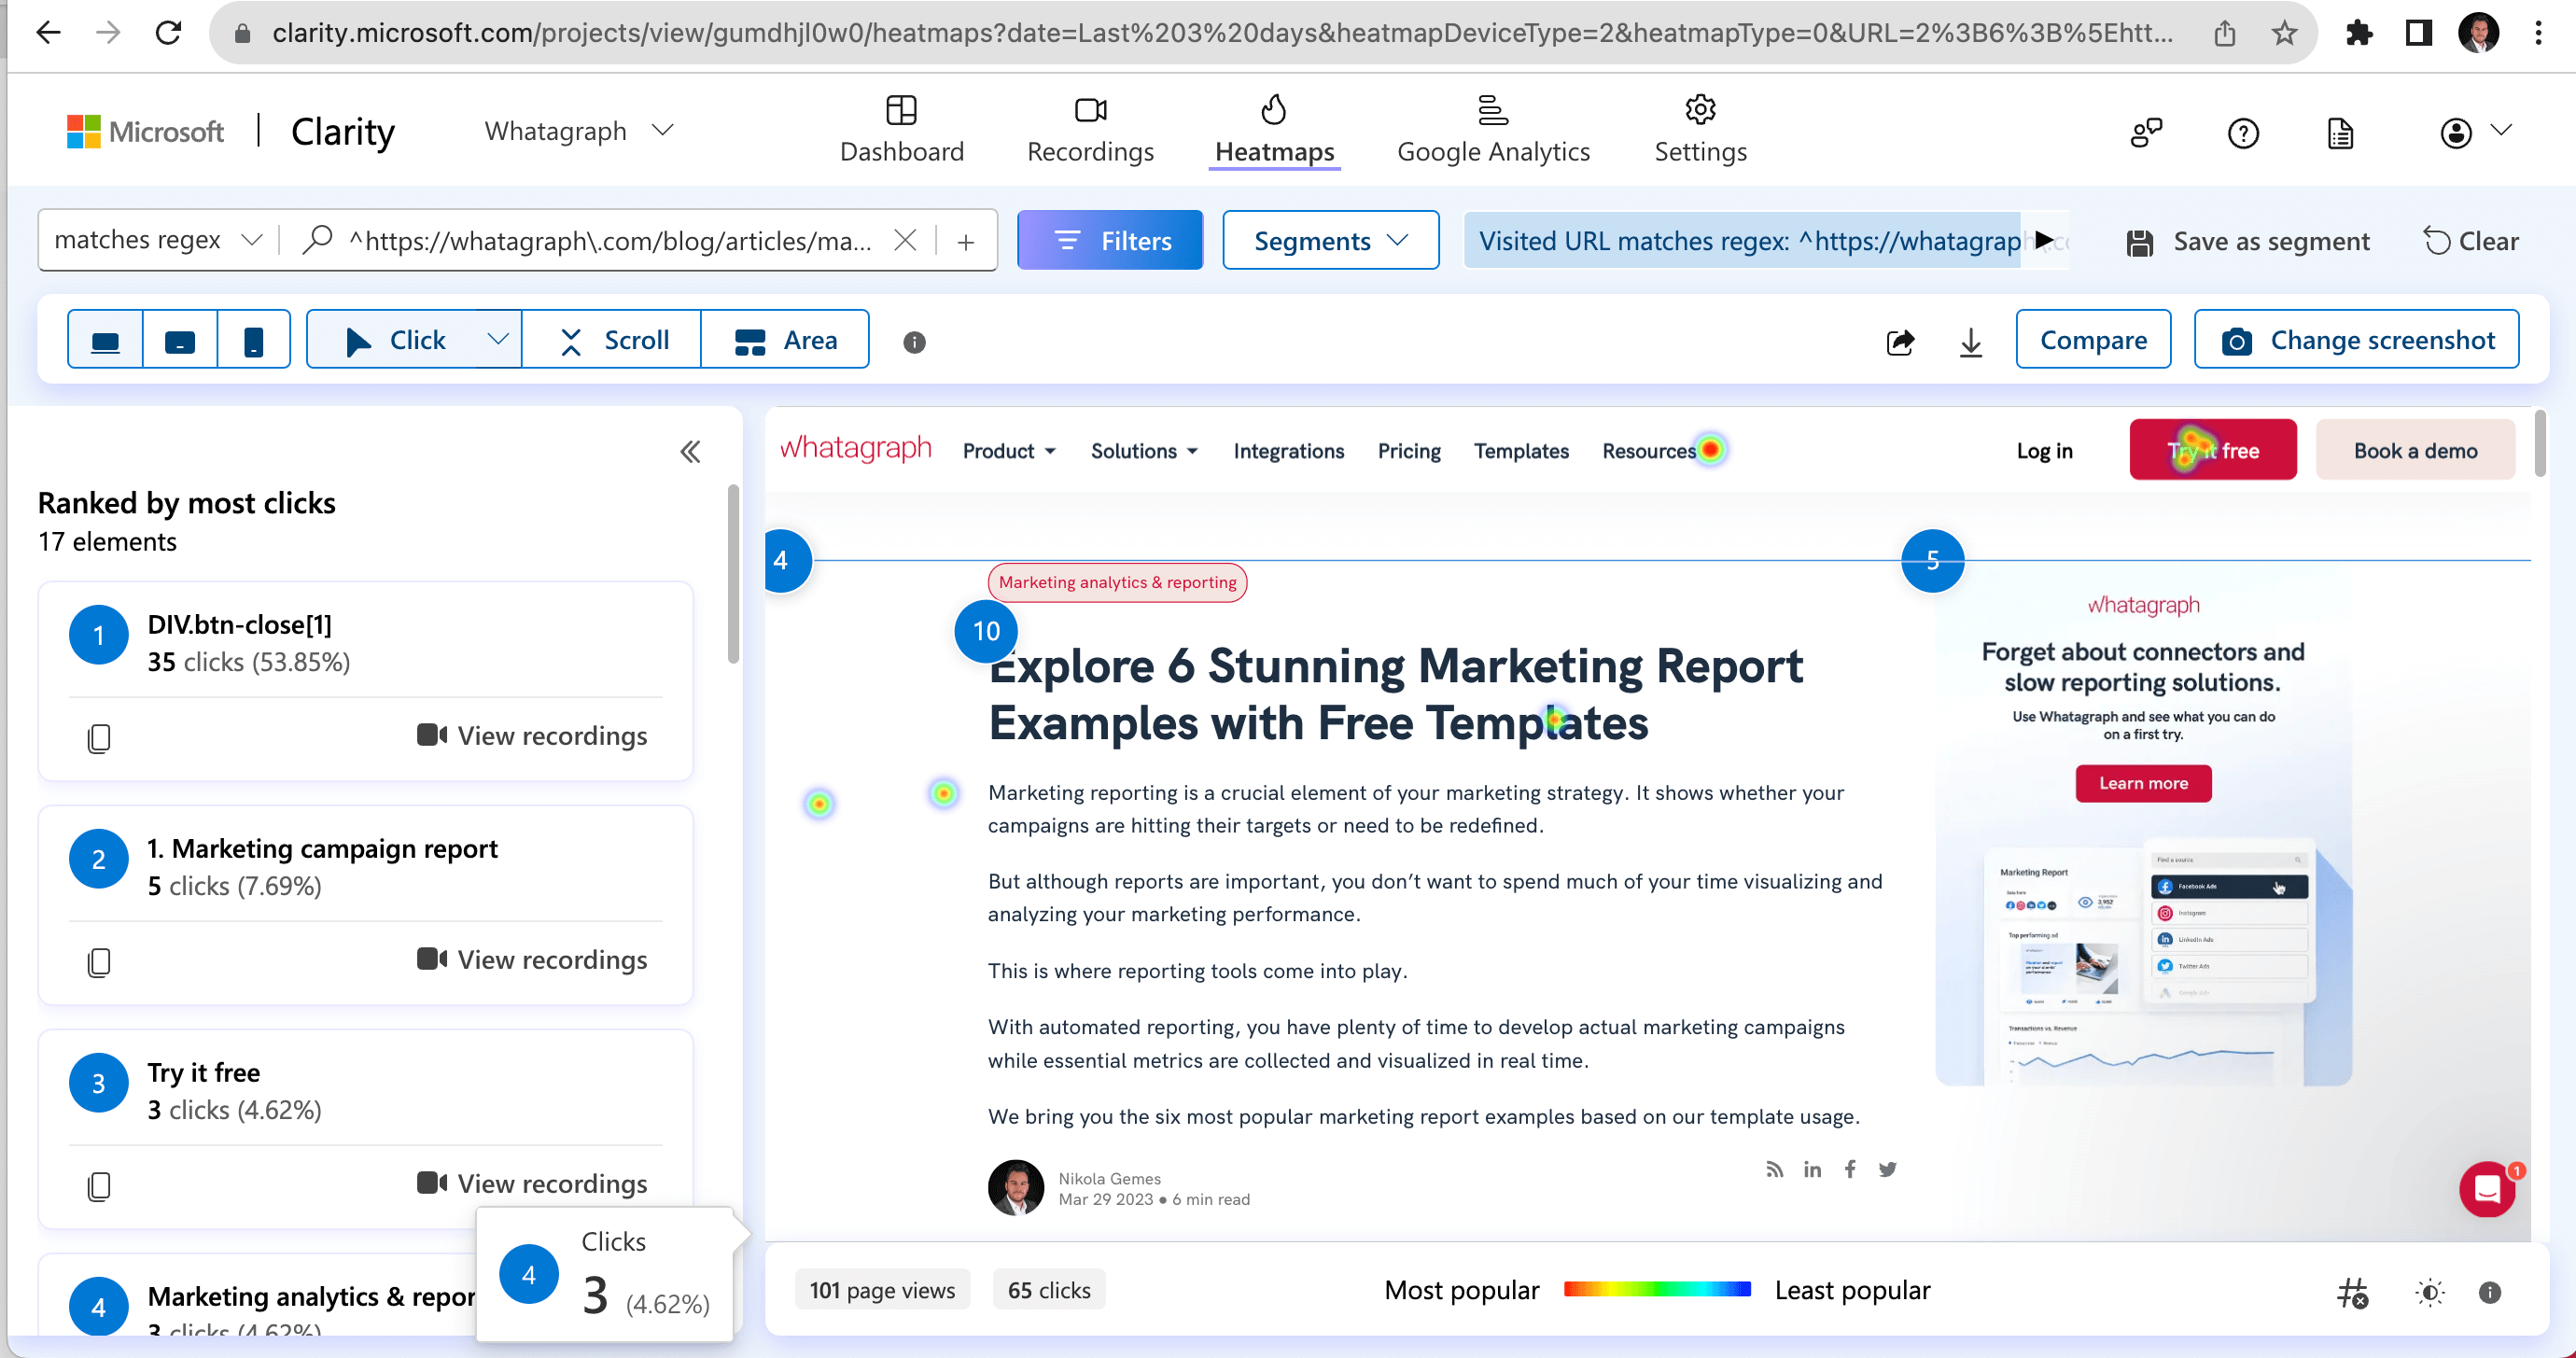
Tools like Clarity can show your support team if something on your website is not working
For example, if your service has speed issues, you may not want to make an ad creative saying how fast it is.
If you use Google Analytics 4 and come to realize that engaged sessions are low on a certain product page, your support team can identify what is confusing customers about that page.
Insights from account managers
If you are in a B2B marketing team or serve multiple clients as an agency, your account managers can be another valuable marketing data source.
What insights to look for from account managers?
The story of your marketing data should really start with you talking to account managers first. This team understands your clients on a micro and macro level and can tell you:
- What kinds of marketing campaigns do prospects respond to the most?
- What marketing trends do they pay attention to?
- What pain points lead them to you?
- What economic indicators are important to them?
Connect marketing data sources easily with Whatagraph
To gain a complete overview of your client, you need to track marketing data that lives on different marketing platforms. Until recently, marketing agencies have often used several tools to connect marketing data sources into a unified view — one tool for social media, another for Google-based platforms, the third for paid advertising, etc.
It’s not rare that marketers still use one tool to connect data sources and another to visualize and share insights with their clients.
In either case, relying on multiple marketing SaaS complicates data aggregation and reporting.
If any of the tools encounters a problem, you can’t complete your data journey. Not to mention the cost and logistics of managing several tool subscriptions.
Whatagraph solves these problems by offering a marketing data platform to connect, visualize, and share marketing data from diverse sources.
What makes Whatagraph an ideal choice for marketing agencies?
One platform
Whatagraph allows you to connect, visualize, and share your marketing data within the same tool. Thanks to over 45 native integrations with popular website analytics, social media, paid ads, e-commerce, email marketing, and CRM tools, your connections are fast and stable. Add your data sources once and create stunning reports and dashboards with accurate marketing data. All the supported integrations are available in all pricing plans.
Easy cross-channel insights
Bring cross-channel data together in just a few clicks by simply connecting the multiple data sources to a single report and dashboard and pick the widgets you need for cross-channel visualization. You can set individual data sources for every graph, chart, table, and even a single-value widget.
Use separate widgets for each channel or blend data within a single widget for unified metrics. Thanks to custom formulas, you can blend existing metrics from multiple sources and create new metrics that original platforms don’t provide.
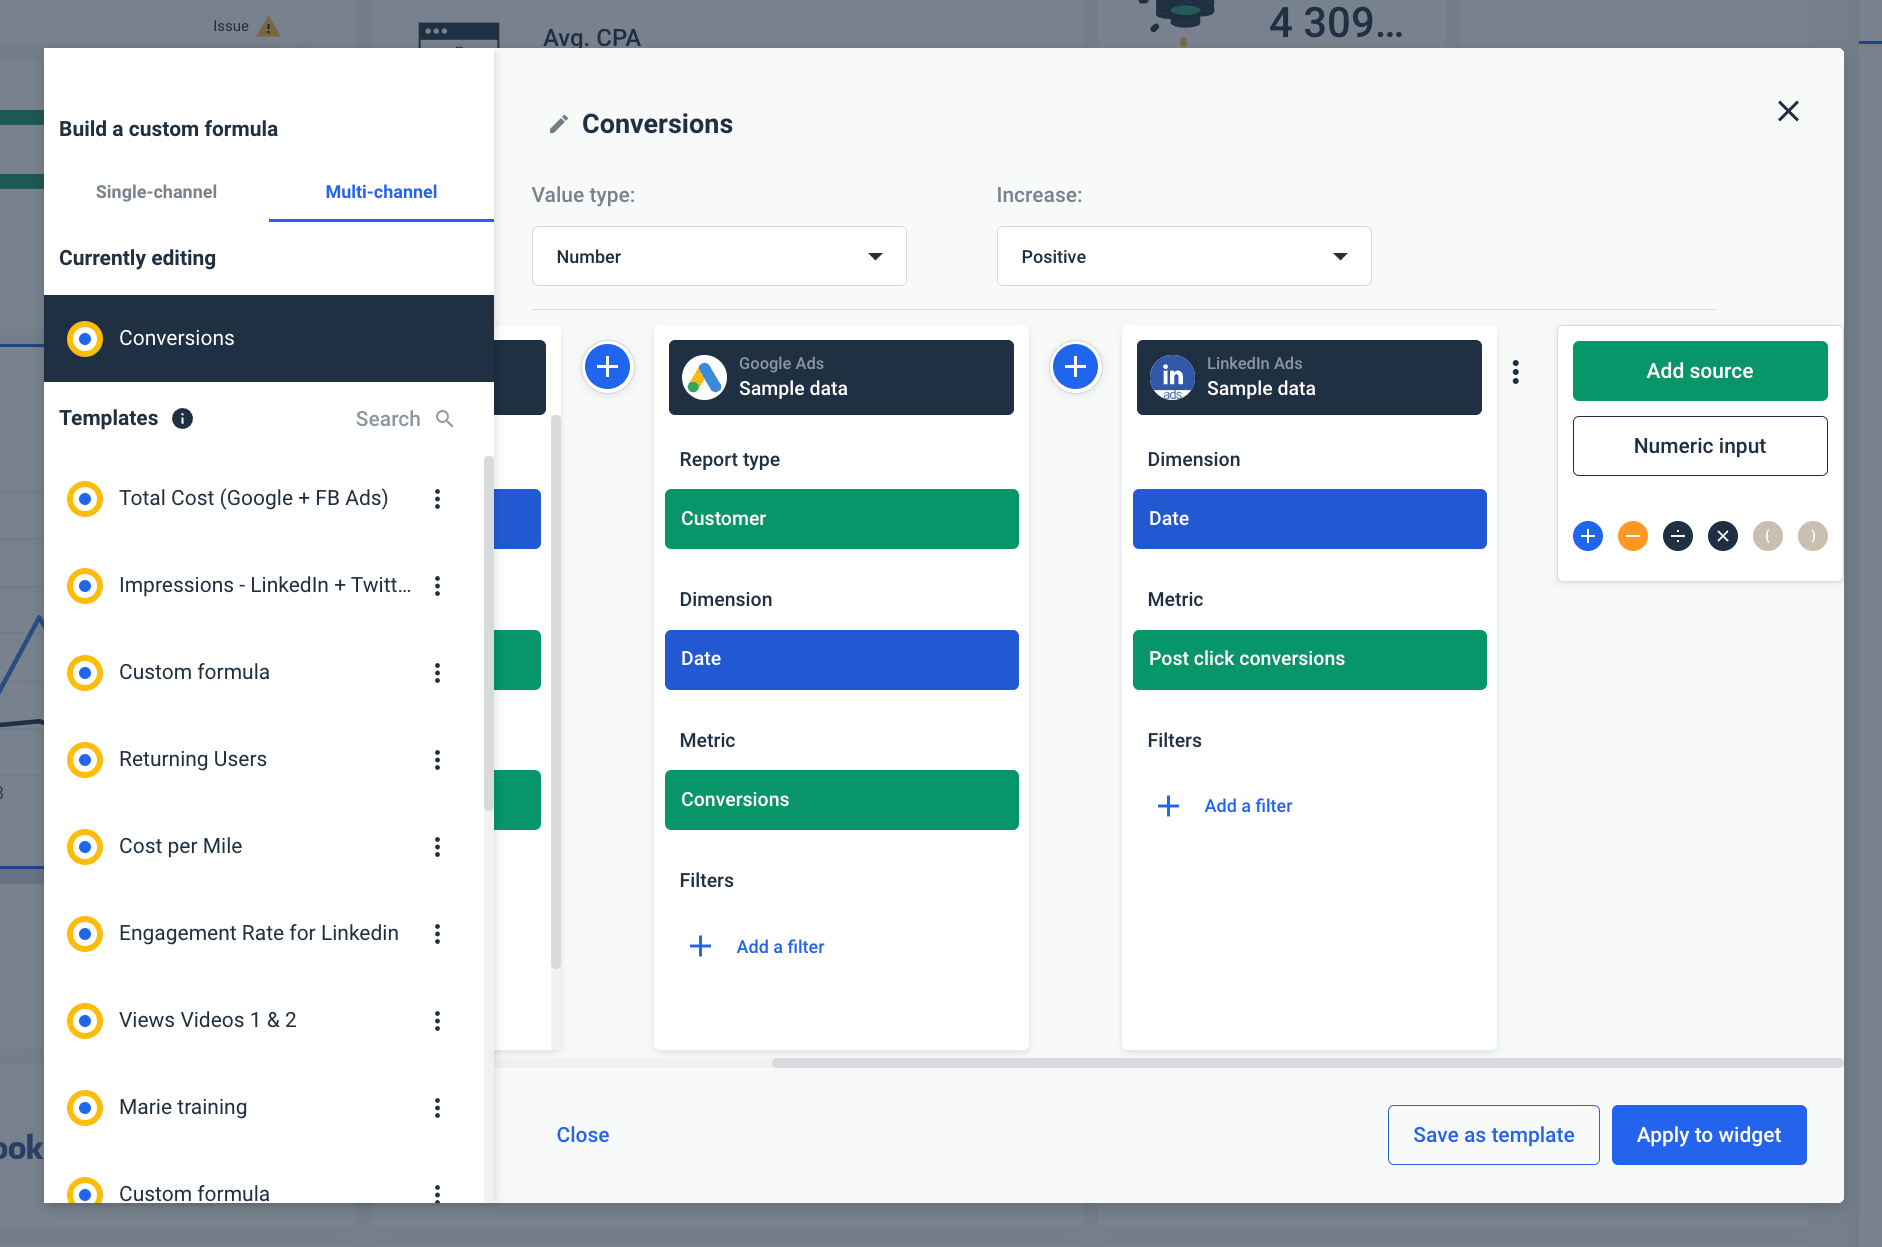
Multi-source tables are another handy cross-channel feature you can use to compare metrics of choice from comparable sources, like paid advertising or social media.
Connect any marketing data source
Our list of native integrations is growing constantly, but if you currently have a data source you want to connect and report on, Whatagraph gives you three workarounds:
- Create a custom API,
- Move data to Google BigQuery and connect it as a source,
- Export data to Google Sheets and connect it as native integration.
The last option is useful if you want to include additional formulas like exchange rates to your data before unifying it in one of the Whatagraph reports.
Report automation and live dashboard links
Whatagraph enables you to automate much of the data collection and reporting process. Once you add your data sources, create a report, and specify the recipients: email addresses, frequency, and time of sending, you can set the whole process on autopilot, and your clients will receive every report on time.
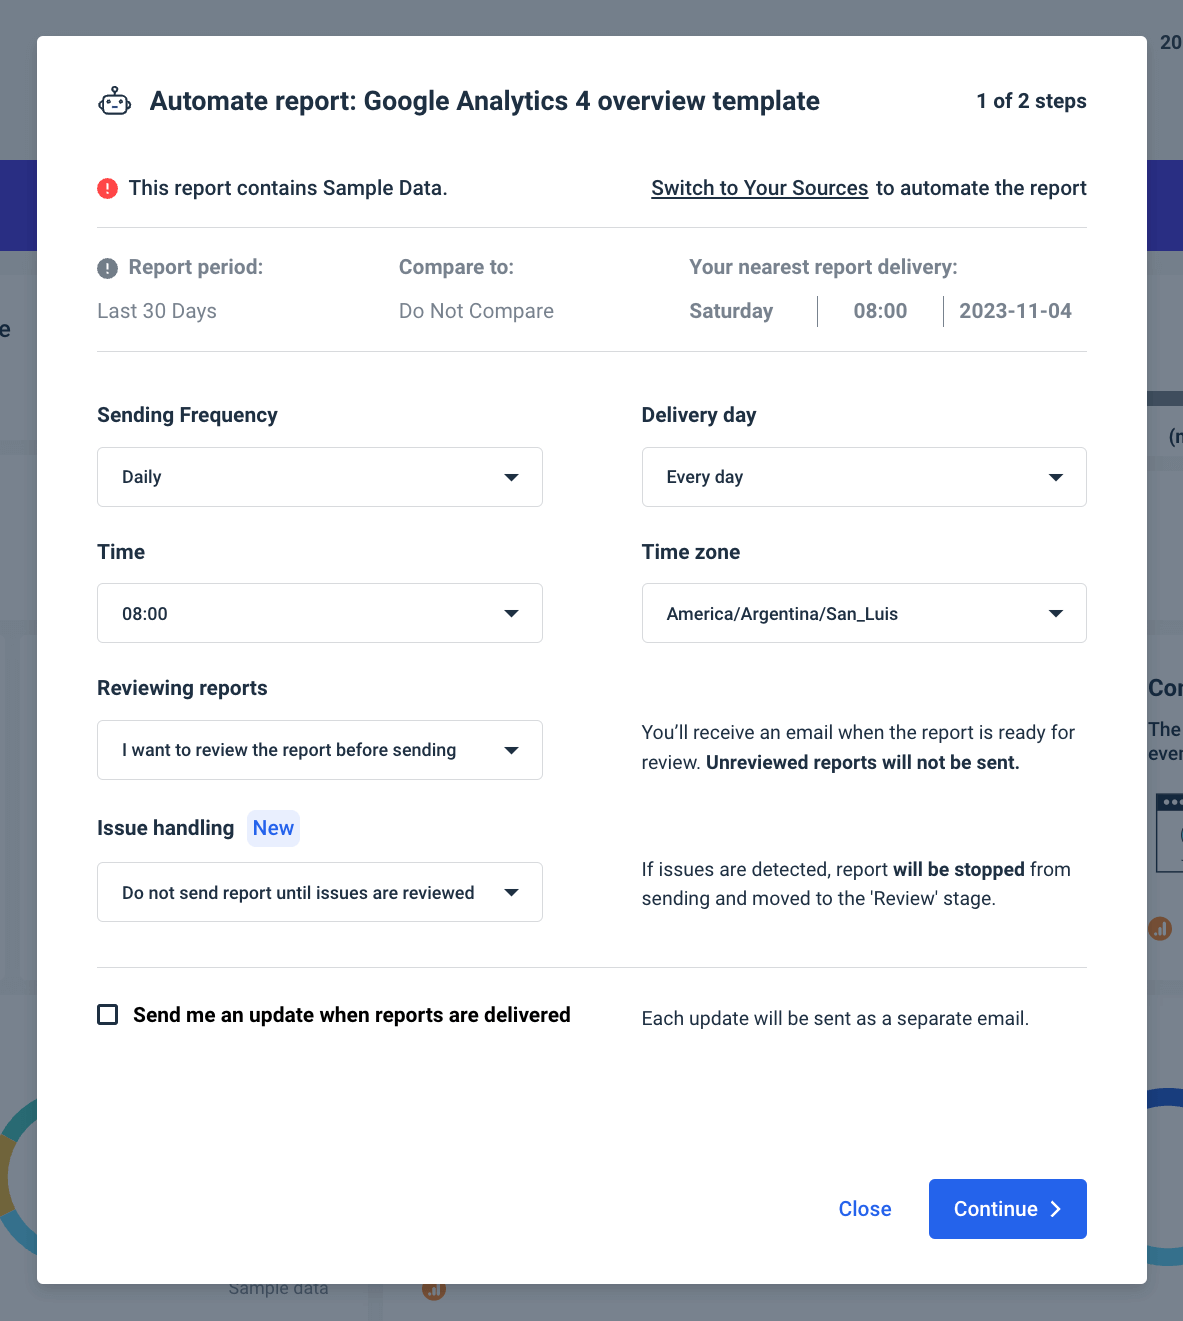
Of course, you can add a review step if you want to inspect what gets sent and include additional comments and recommendations.
Another handy reporting feature is live links to reports and dashboards.
Emailed .pdf reports are great for periodical reporting and allow clients to reference data from previous periods.
Live links, however, give additional transparency to reporting as they remove all the steps between clients and their marketing data. They reduce the possibility of human error and speed up client-agency communication as clients can access real-time data at any time, from any place.
Code-free data transfers to BigQuery
Whatagraph offers an intuitive, no-code way to transfer data from multiple marketing platforms to Google BigQuery data warehouse.
Data warehousing gives you total ownership of the marketing data you collect. Instead of trusting multiple platforms to keep your data, move it to a warehouse and run data analysis whenever you need, without date range or API limitations.
And the best thing is that you don’t have to build or maintain your connection. With Whatagraph, setting up a date transfer to BigQuery takes just a few clicks.
Wrapping up
Although quantitative marketing data is the essence of marketing analytics, qualitative data can help you see the whole picture of your clients’ marketing performance.
However, qualitative and quantitative marketing data sources don’t need to be siloed from each other. Account managers can provide useful notes on the customer journey, which you can transform into comments or recommendations in client reports.
This combination of metrics and human observation ensures an accurate interpretation of your marketing results.
Yet, in spite of marketing data sources often being widely diversified, data gathering shouldn’t take much of your time.
More precisely, it shouldn’t take more than a couple of minutes of what it takes to connect a new client’s accounts in Whatagraph.
Connect the accounts once and use our intuitive drag-and-drop data visualization to create unlimited reports and dashboards.
Request a free trial of Whatagraph today — connect your marketing sources and start analyzing your marketing data with no limits.
Published on Nov 08 2023
WRITTEN BY
Nikola GemesNikola is a content marketer at Whatagraph with extensive writing experience in SaaS and tech niches. With a background in content management apps and composable architectures, it's his job to educate readers about the latest developments in the world of marketing data, data warehousing, headless architectures, and federated content platforms.