Free ChatGPT Daily Report Template

Track exactly how many sessions, views, and conversions you’re getting from ChatGPT every day.

Visualize key metrics, see trends, and break down top performing pages all in this ChatGPT daily report template.

ChatGPT Daily Report Template - Dashboard showing key metrics like users, views, sessions and integrations.

How to Use Whatagraph’s ChatGPT Daily Report Template

Try Our Custom ChatGPT Report Generator

With Whatagraph IQ, just tell us what you need, and we'll build a stunning ChatGPT marketing report for you. No templates or manual setup needed.

What To Include in a ChatGPT Daily Report Template

A ChatGPT daily report helps you understand how much website traffic, engagement, and revenue you generated today, and how that compares to yesterday.

It’s built for fast decision-making, giving marketers and SEO teams a simple snapshot of key metrics without digging through dashboards or exporting Excel files.

Below is everything your daily performance report should include, based on the real templates used by teams tracking ChatGPT and OpenAI traffic every day.

1. Performance Summary

ChatGPT Daily Report Template - Performance Summary - Performance dashboard with metrics, charts and recommendations.
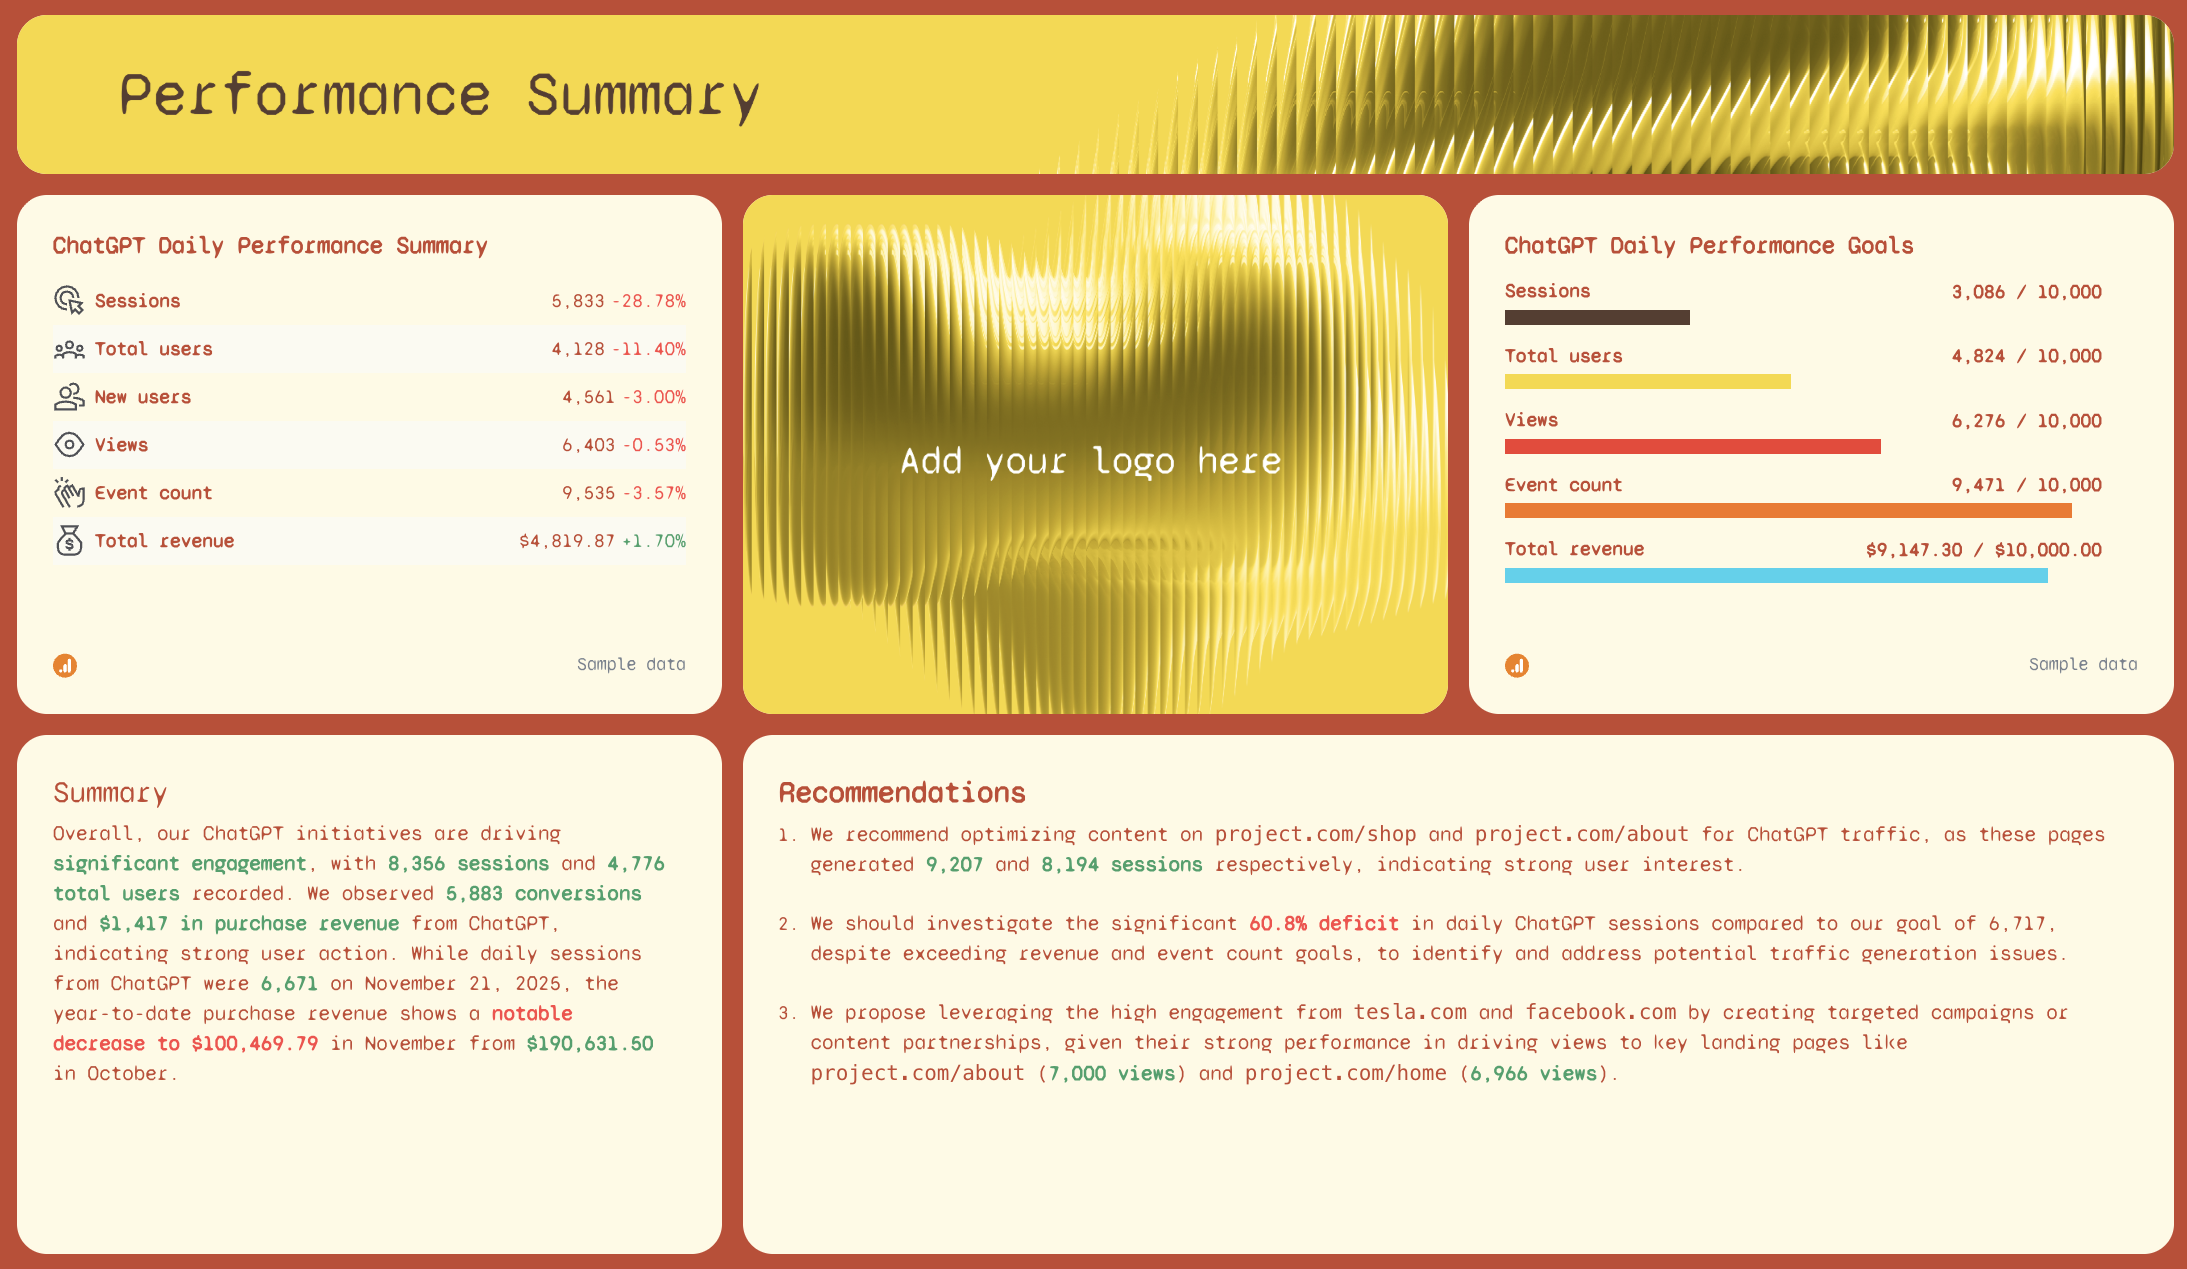
This is the first thing stakeholders expect to see—your “big picture” daily view in one place.

Your Performance Summary should include:

  • A daily performance report widget showing today’s sessions, total users, new users, views, event count, and revenue from ChatGPT.
  • A comparison column showing how each metric moved versus yesterday (+/- %).
  • A goals progress widget showing how close you are to your daily KPIs—helpful for daily standups, quick follow-up conversations, and internal workflow reviews.
  • A text section for summaries and actionable insights.

With Whatagraph IQ, you can just ask AI to write performance summaries based on your data to save you time. It’s available in 18 languages and 5 different formats—Summary, Recommendations, Wins, Issues, or custom prompt.

There’s no hallucinations because it’s based on your actual connected data, and you don’t have to worry about data breaches either because the data stays on Whatagraph.

Whatagraph comes with some strong security measures like ISO27001, GDPR compliance, AES-256 encryption, EU data hosting and SSO/SAML.

2. Performance Overview

ChatGPT Daily Report Template - A dashboard showing sessions, users, views, and conversions data.

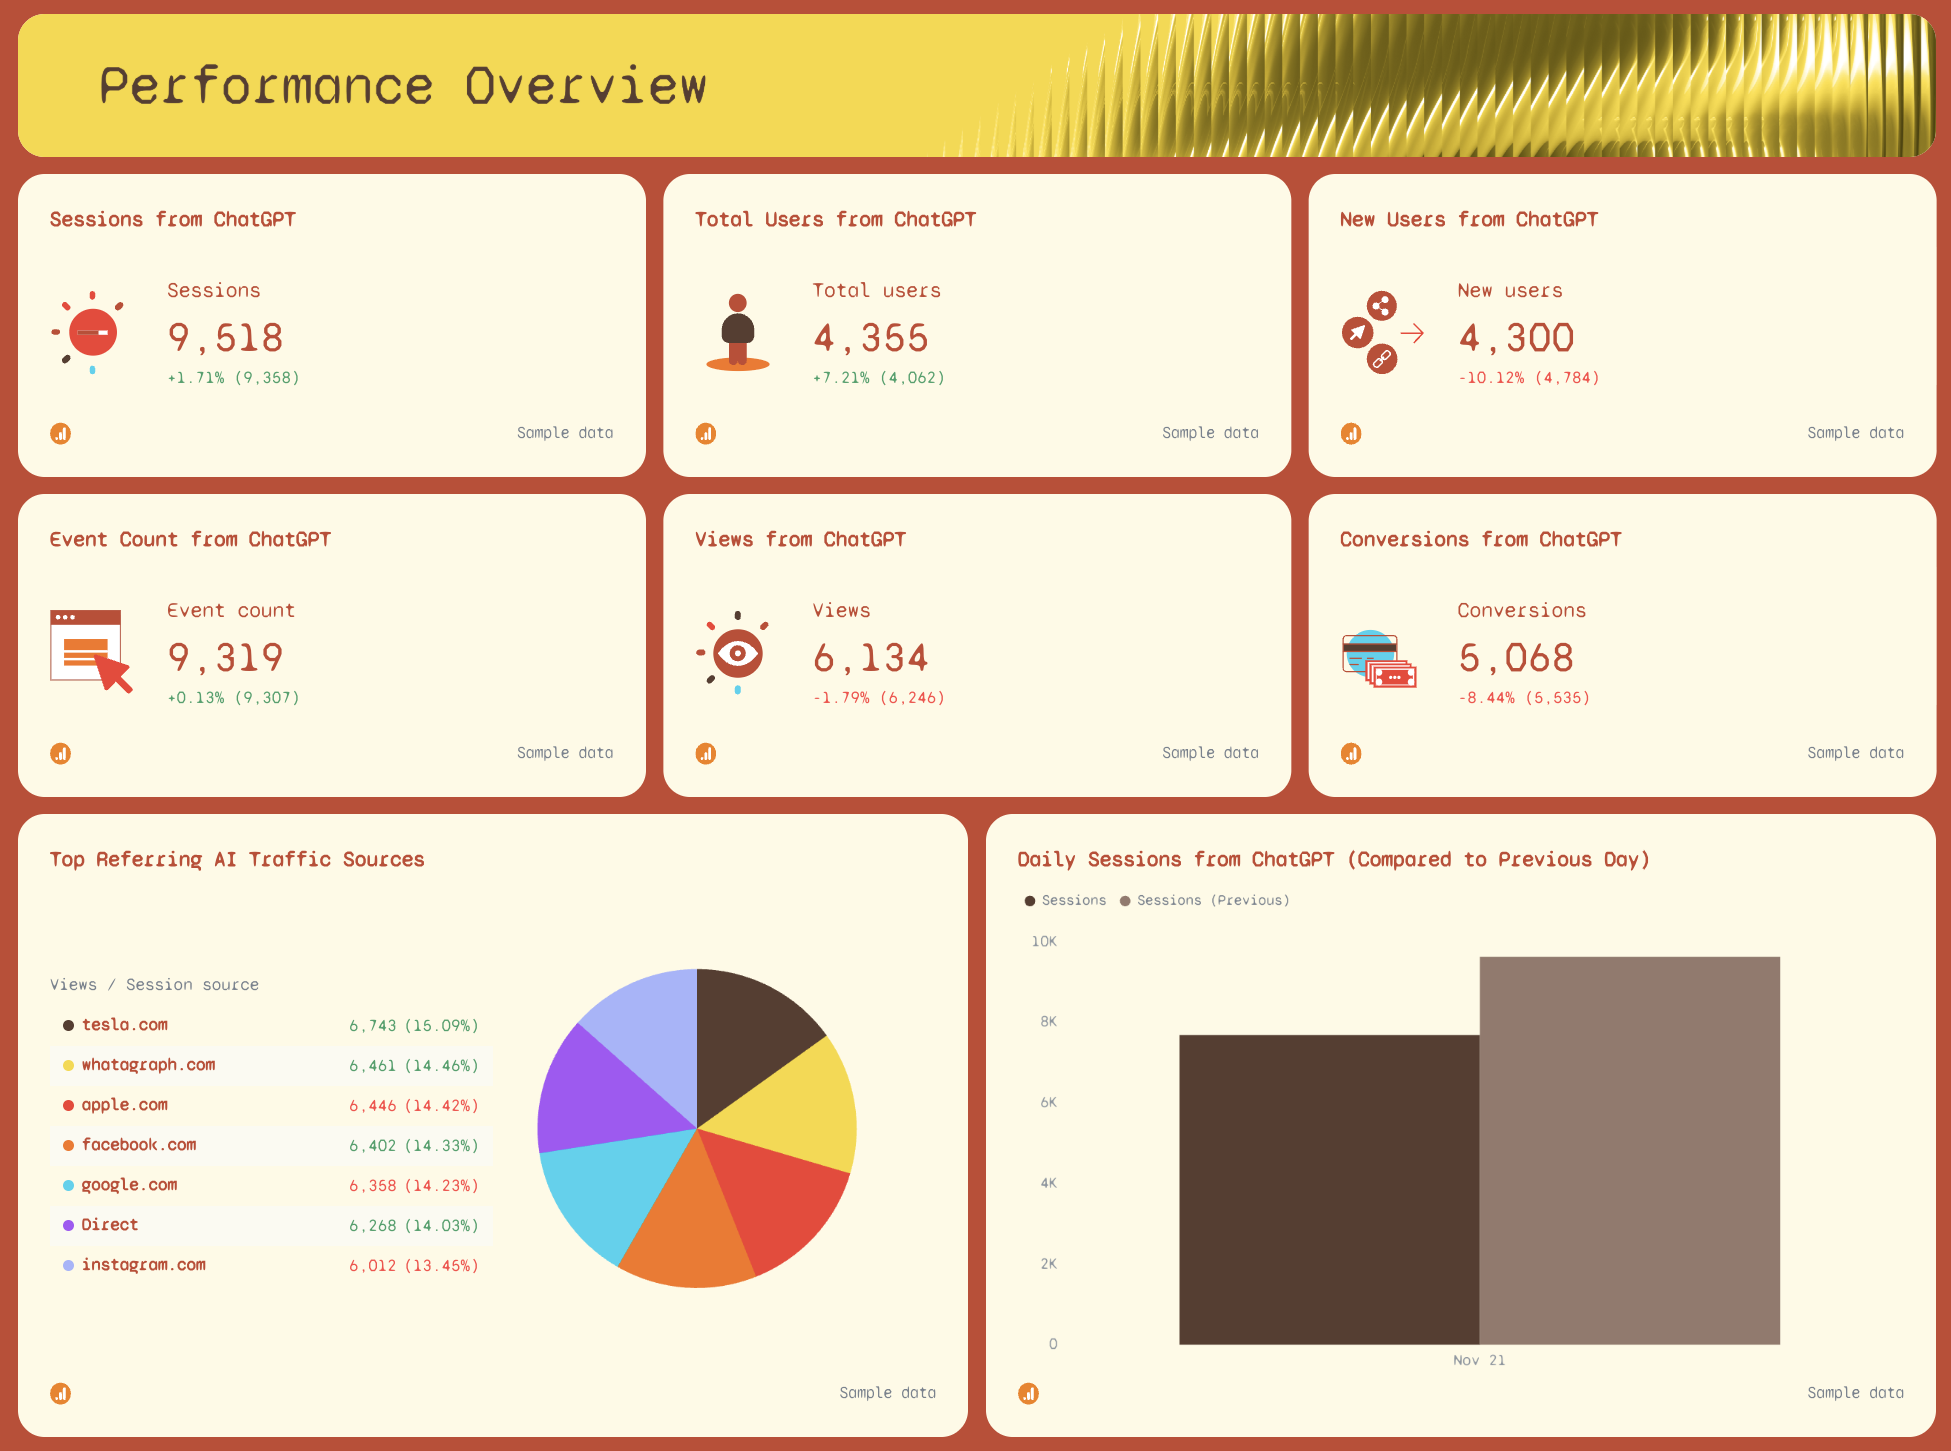
This section breaks down today’s performance into simple widgets and trend graphs, helping you understand how users from ChatGPT behave day-to-day.

It should include:

  • Individual widgets for sessions, total users, new users, views, conversions, and event count from ChatGPT only.
  • Data filtered in the backend using GA4 + a custom condition:
    Source / Medium → matches regex → chatgpt | openai
  • A daily bar graph comparing today vs. yesterday sessions.
  • A trend line visualizing daily patterns for the past few days.
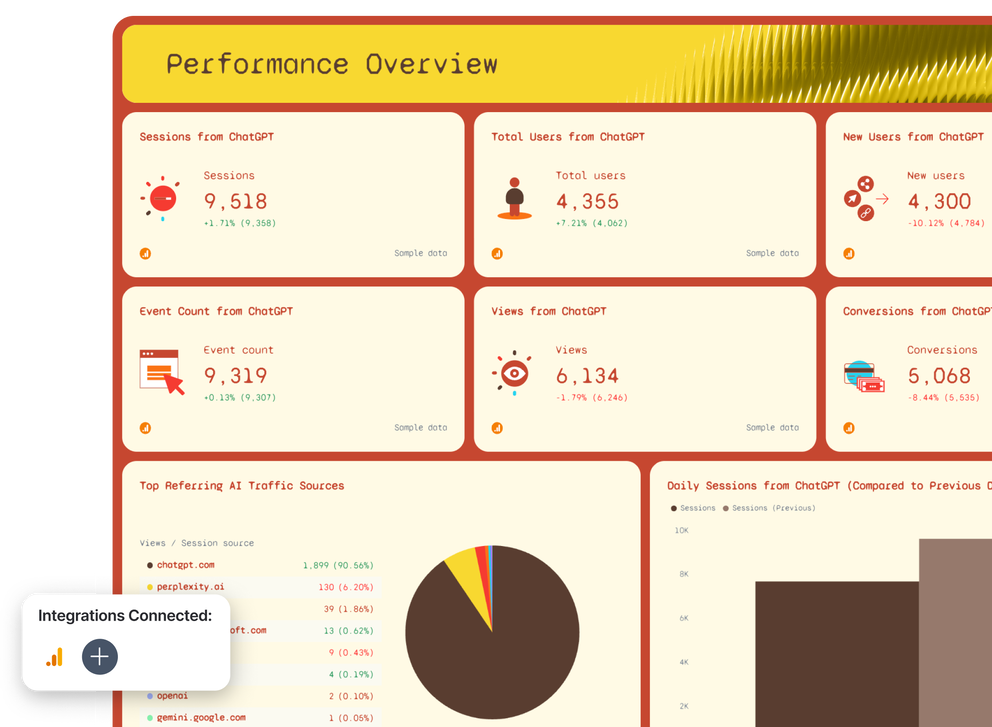
  • A pie chart of Top Referring AI Traffic Sources (Tesla.com, ChatGPT, Instagram, Google.com, Apple.com, etc.).

Important: Although this is a daily report, the “Top Referring AI Traffic Sources” pie chart uses a monthly dataset. Traffic sources don’t meaningfully shift every 24 hours, so the monthly dataset provides more reliable insights for marketers, SEO specialists, and anyone reviewing daily patterns.

3. eCommerce Overview

ChatGPT Daily Report Template - Ecommerce overview dashboard with line and bar graphs.

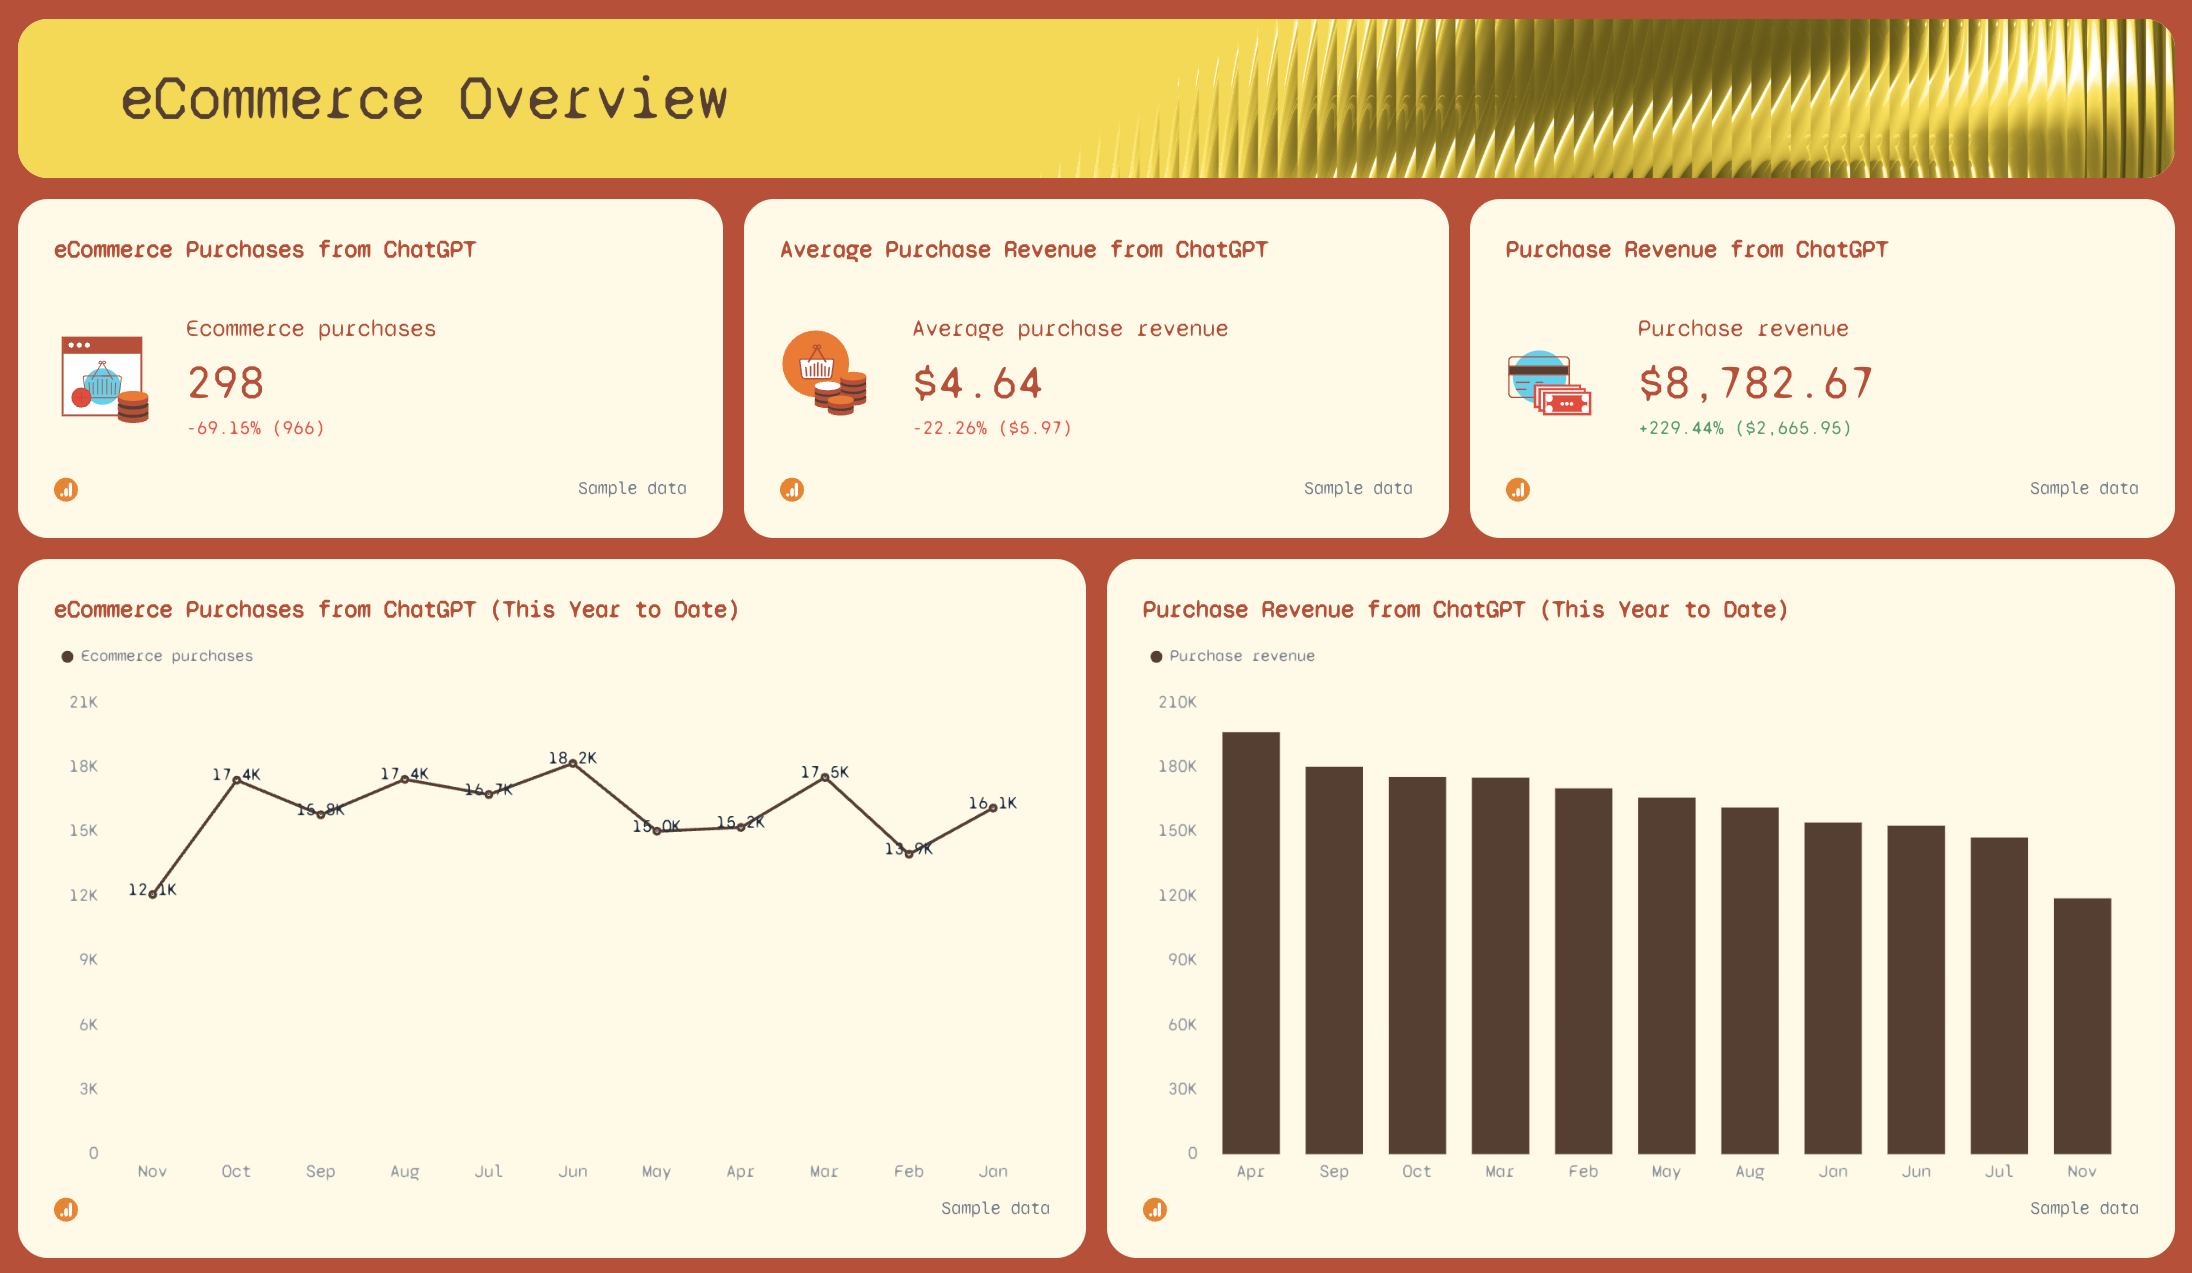
This section is ideal for online stores tracking revenue influenced by ChatGPT and similar AI tools.

Your eCommerce section should include:

  • Today’s ecommerce purchases, average purchase revenue, and total purchase revenue from ChatGPT.
  • A year-to-date line graph showing ecommerce purchases from ChatGPT.
  • A year-to-date bar graph showing revenue trends from ChatGPT.

Why year-to-date though? Because ecommerce performance is too noisy to analyze “just for today.” Daily-only numbers make patterns hard to spot, so year-to-date datasets reveal real trends that help you optimize future campaigns.

4. Session Breakdown

Session Breakdown - Two tables showing website session data from different sources.

This section breaks down your website traffic by ChatGPT and other AI-driven sources.

Include two tables:

a. Session Breakdown by AI Source (Today vs. Yesterday)

Shows:

  • Views
  • Sessions
  • Total users
  • New users
  • Event count

…across traffic sources like ChatGPT, WhataGraph.com, Tesla.com, Google.com, Facebook.com, etc.

b. Session Breakdown by URL (Today vs. Yesterday)

This table shows where AI users actually land.

It helps teams understand:

  • Which landing pages get the most AI-driven activity
  • Where engagement is dropping
  • Where to improve marketing campaigns, content, or UX

These tables are extremely helpful for real-time troubleshooting without digging through raw datasets or time-consuming spreadsheets.

5. ChatGPT vs. Google

Chat Gpt Daily Report Template - A comparison chart showing ChatGPT versus Google performance metrics.

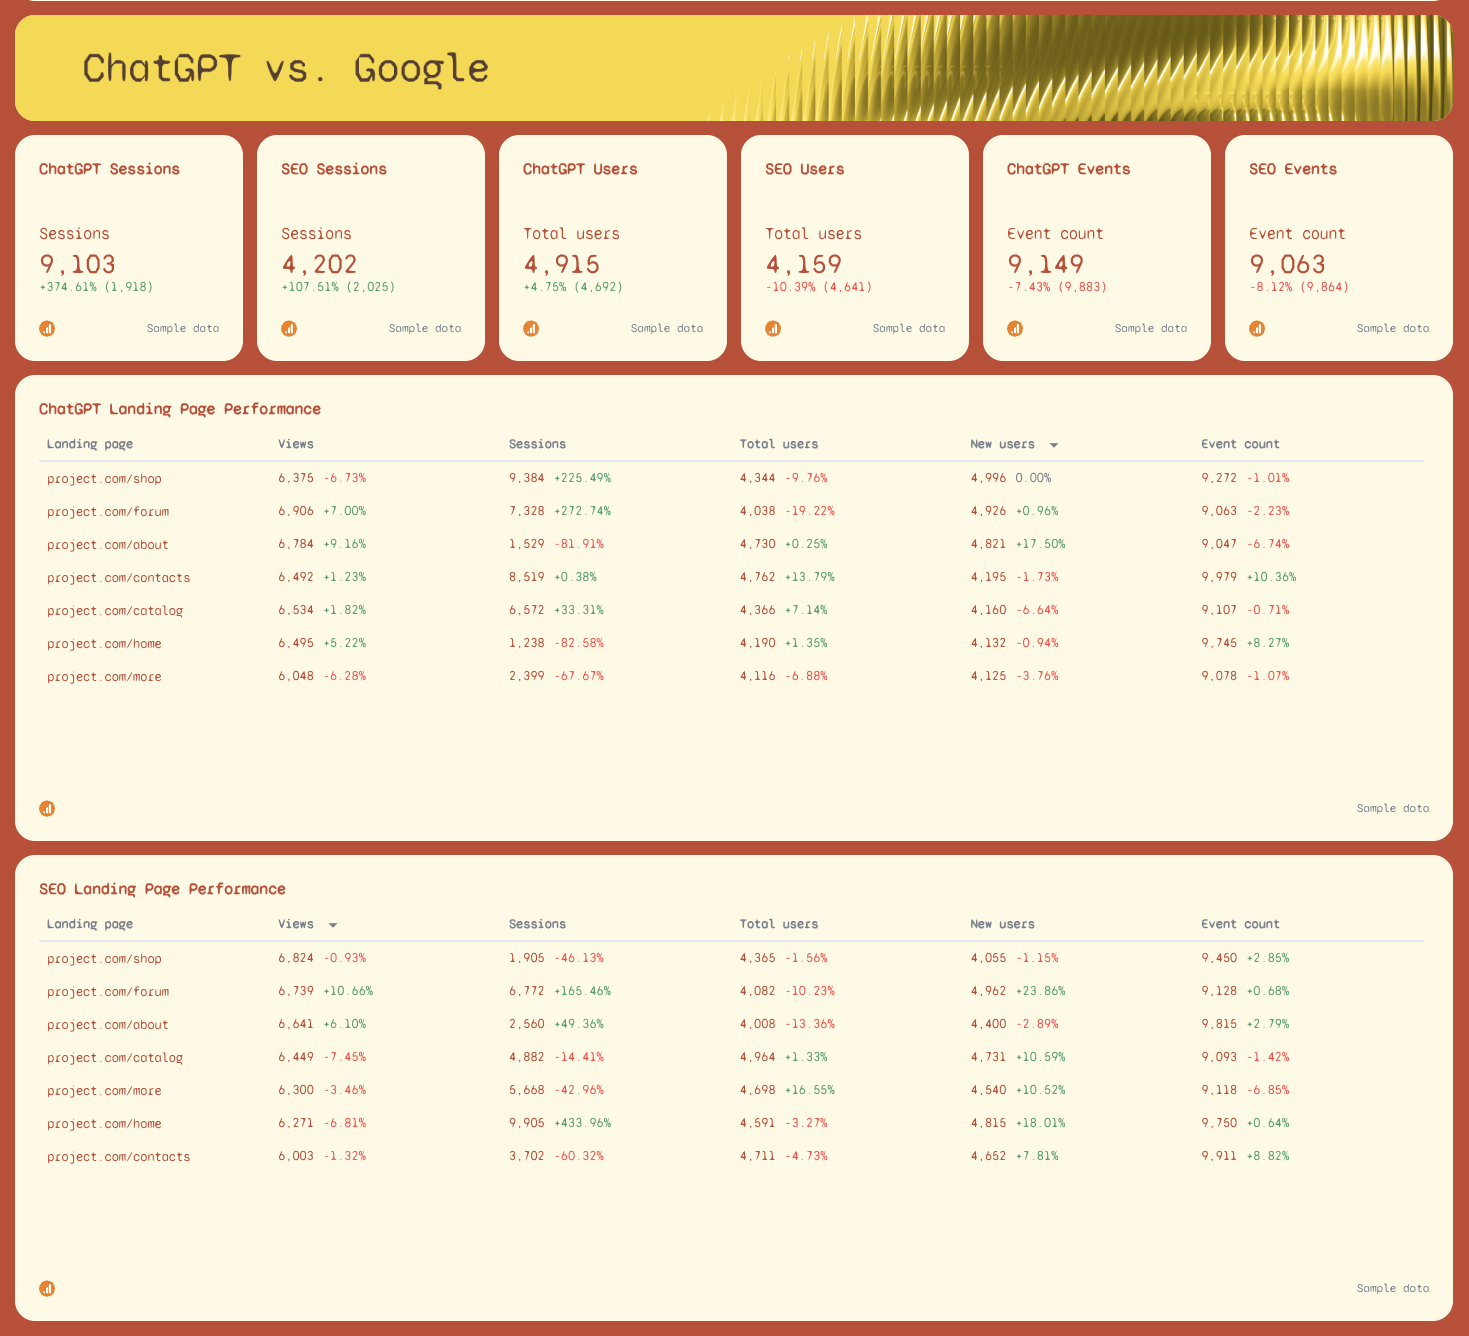
The final section compares ChatGPT-driven traffic with Google and other classic search sources in a clean side-by-side layout.

Include:

  • Sessions
  • Total users
  • New users
  • Views
  • Event count

The goal is to see:

  • Is ChatGPT gaining ground on search?
  • Is it influencing your workflow or SEO priorities?
  • When should you optimize content for AI-driven discovery instead of traditional search engines?

This comparison helps stakeholders make confident, data-driven takeaways for your next daily standup or follow-up review.

Connect All Your Marketing Data in One Place

Bring all your marketing data into one place with no-code, stable connectors that you don't need to babysit. 

Why Marketers Love Reporting on Whatagraph

Whatagraph's AI is saving so much time and energy for our marketing specialists. We now have more time to focus on strategic things that help both our agency and our clients grow.

Lars Maat

Lars Maat

Co-Founder @ Maatwerk Online

StarStarStarStarStar

Whatagraph took us to the next level with our clients and within our team. Our relationships with clients have been amazing, and we’ve even been able to retain them longer.

Kim Strickland

Kim Strickland

Digital Marketing Specialist @ Peak Seven

StarStarStarStarStar

Whatagraph is easy to use, visually attractive, and much smoother compared to tools like Looker Studio. It helped us not only get clients on board but also keep them within the agency.

Stef Oosterik

Stef Oosterik

Quality Manager @ Dtch. Digitals

StarStarStarStarStar

Whatagraph has become an essential partner for scaling our reporting, and my teams love it because it saves so much time. We’d recommend it to any team looking to automate data reporting and use AI for insights.

Danielle Roberts

Danielle Roberts

Director of Implementation & Support @ Rentable

StarStarStarStarStar

Frequently Asked Questions

Have more questions? We answered them here.

What exactly is a daily performance report?

A daily performance report is a simple snapshot of everything that happened today—how much traffic you got, how people behaved, and whether results improved or dropped since yesterday. It helps teams respond quickly, fix issues, and make better daily decisions without digging into dashboards.

What is a ChatGPT daily report template and how can it improve productivity?

A ChatGPT daily report template is a ready-made layout that shows all your ChatGPT-driven traffic for the day, including sessions, views, conversions, and engagement. It helps teams see the impact of AI-driven discovery in real time, and because it’s automated in Whatagraph, you can build full reports without spending hours collecting data or writing summaries.

How to structure a daily report?

A good daily report has five parts:


- A short summary of today’s results


- Key metrics like sessions, users, views, conversions, or revenue


- How today compares to yesterday


- Key insights or takeaways 


- Any action items for the next day


This structure makes it easy for teams and stakeholders to understand what changed and what needs attention.

Can ChatGPT generate a report?

Yes, ChatGPT can write the text for a report, but it cannot pull real data, build widgets, or create charts unless you paste the numbers in manually. If you want a complete report built from your actual GA4 data, Whatagraph can generate it for you with visualizations, comparisons, and automated summaries.

How to make a daily progress report?

With Whatagraph, you can make a daily progress report in two easy ways:


Option 1: Use a ready-made template


- Start free, create an account, and set your password.


- Connect your data source.


- Pick a report template from our template library based on your specific needs and your report is ready instantly.


Option 2: Use Whatagraph IQ


- Start free, create an account, and set your password.


- Connect your data source.


- Choose “Create a report with IQ.”


- Type a prompt like “Create a weekly AI referral traffic report”, and Whatagraph IQ will build the full report using AI—widgets, charts, graphs, and all—within seconds based on your connected data.


Both options let you generate accurate, professional reports without the heavy lifting.

How do I get AI to write a report for me?

You can use AI to write your summaries by giving it clear instructions and providing the data. But if you use ChatGPT directly, you’ll need to paste your numbers into the app, which some teams avoid due to data-safety concerns.


With Whatagraph IQ, the AI pulls from the metrics already inside your report. It writes accurate text with no hallucinations, fits your tone, and keeps all your data safe inside the same platform.

Which AI is the best for writing reports?

For raw text generation, ChatGPT is acceptable. But for real marketing or SEO reporting—where you need charts, numbers, comparisons, and analysis based on actual data—Whatagraph IQ is the best choice. It connects to your accounts, reads the data inside your report, and writes insights that match your performance.