


What To Include in a ChatGPT Weekly Marketing Report
A ChatGPT weekly marketing report helps you track how much traffic, engagement, and revenue you’re getting from ChatGPT as a source.
This breakdown shows what to include in your report template so marketers, SEO teams, and stakeholders can make smart, data-driven decisions every week.
1. Performance Summary
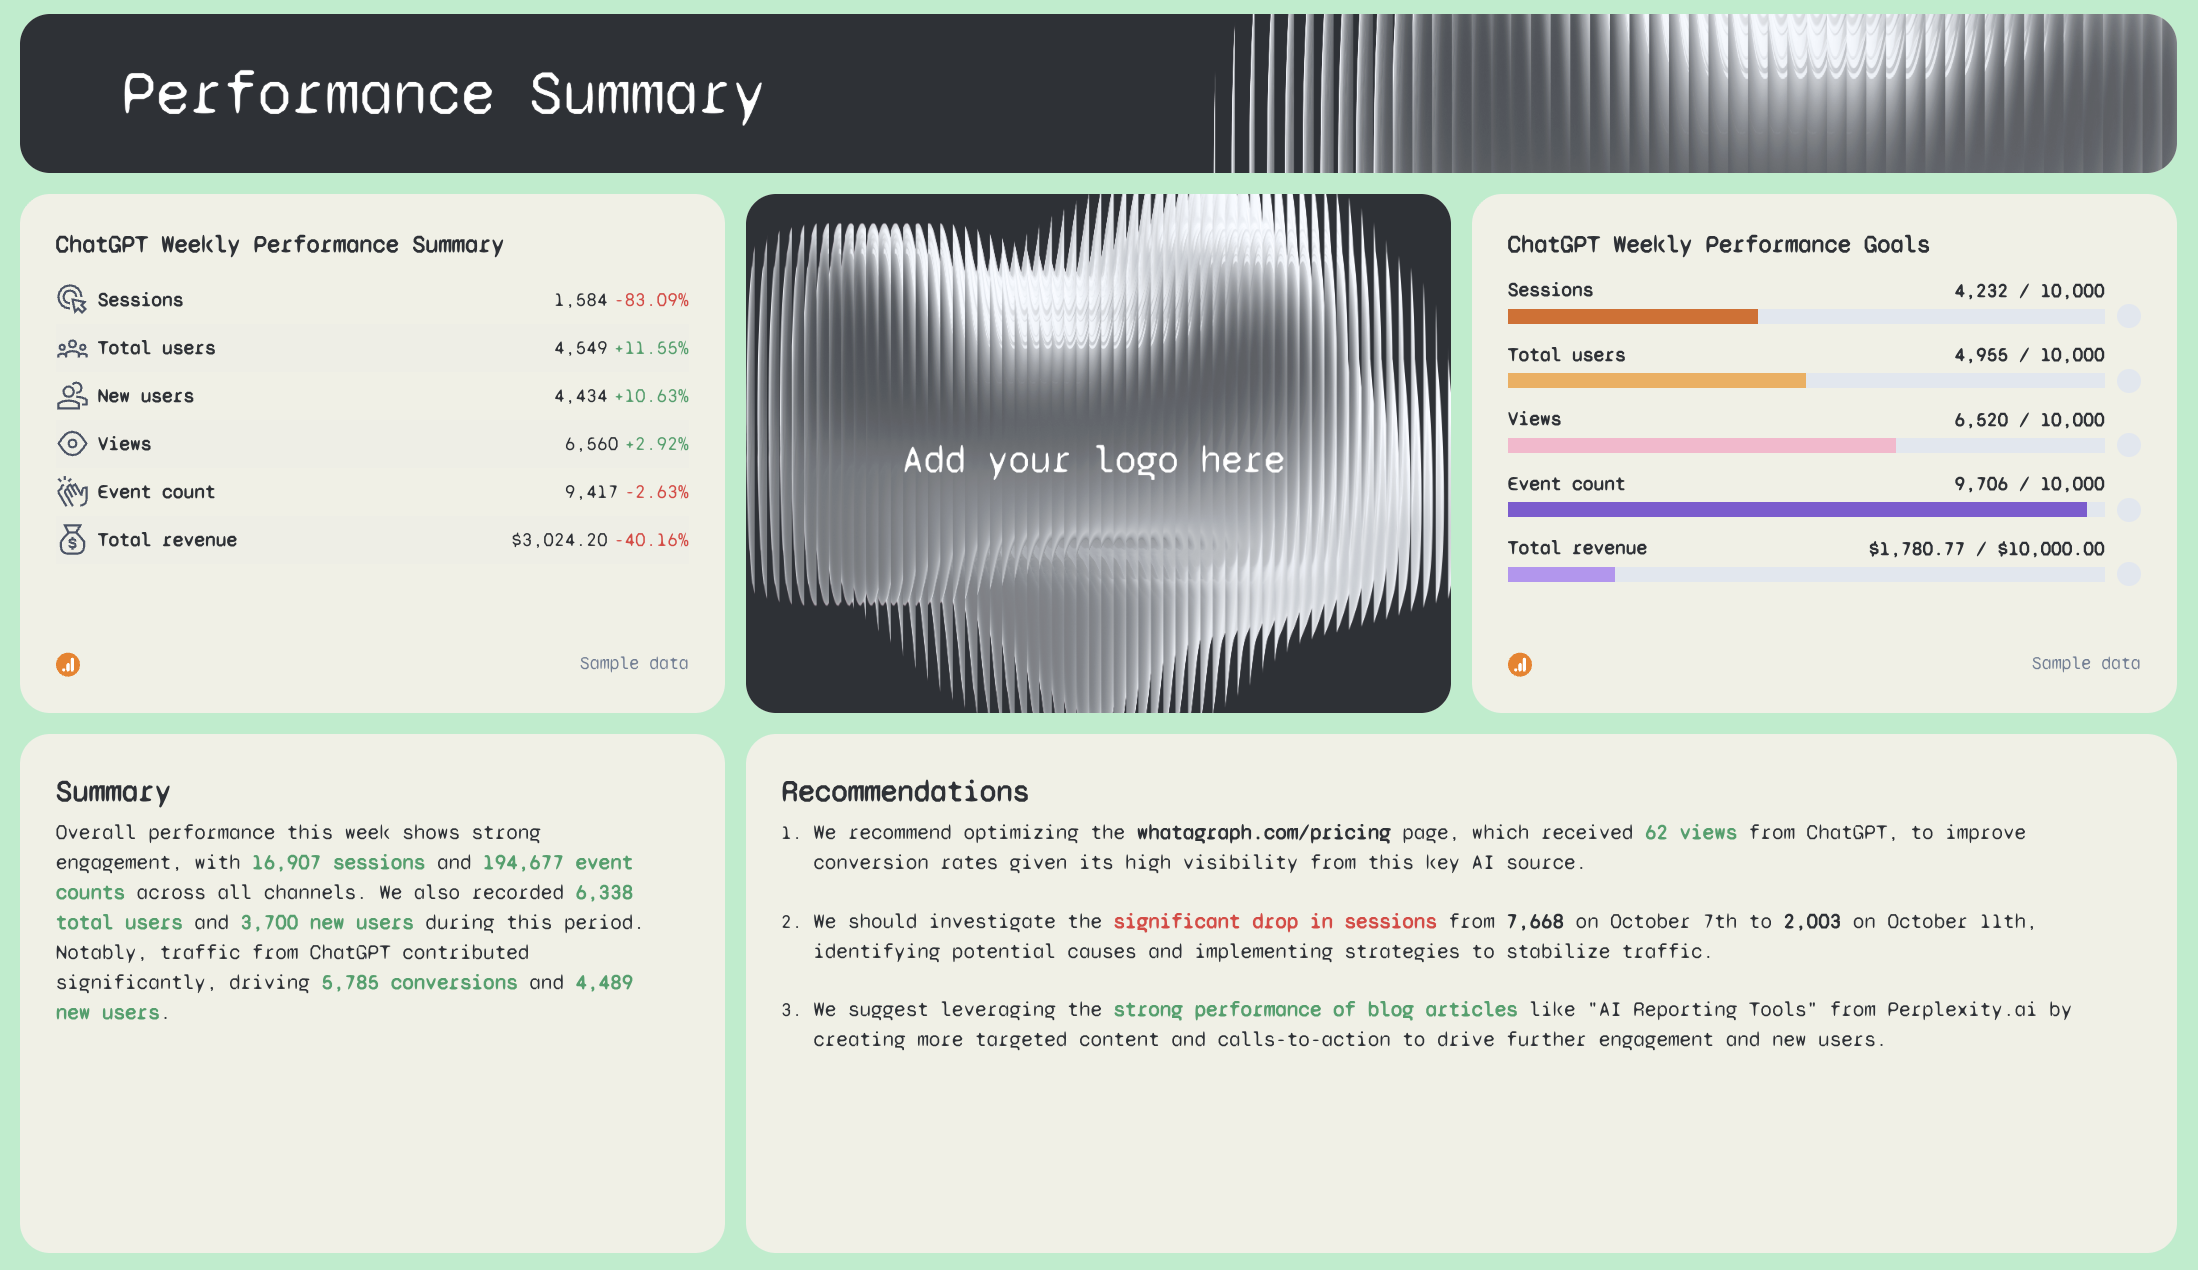 Start your weekly reports with a quick snapshot of your most important metrics. This section gives you an instant executive summary of the week so you don’t have to dig through raw data or spreadsheets.
Here’s what to include:
- A weekly performance summary widget with sessions, views, total users, new users, event count, and conversions from ChatGPT. These KPIs help you see exactly what changed compared to last week.
- A goal widget that shows whether each metric is hitting or missing your targets. This makes it easier to streamline your workflow and optimize plans for next week.
- A text block for summaries, wins, issues, and recommendations. With Whatagraph IQ, you can just ask AI to write accurate performance summaries based on the actual data on your report in 18 languages and 5 different formats—Summary, Wins, Recommendations, Issues, or Custom Prompt. IQ works with the data in your dashboard, so there are no hallucinations, and because everything stays inside Whatagraph, there are no data breaches or third-party tools involved.
This section gives you a clean set of visuals and templates that make ChatGPT’s output easy to understand, simple to share, and quick to act on.
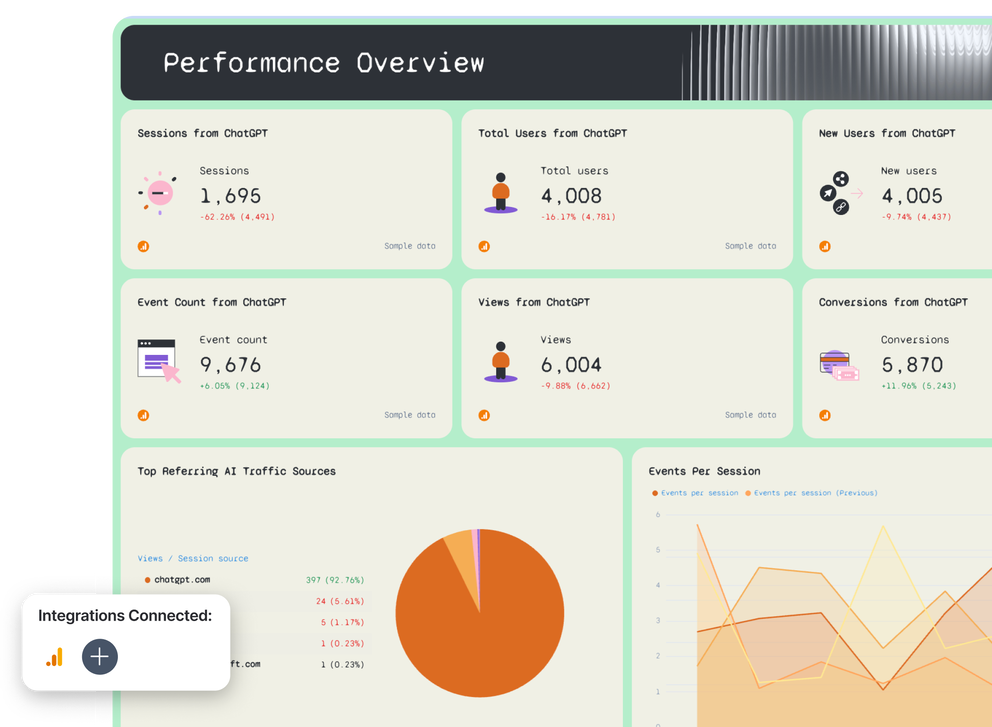
2. Performance Overview
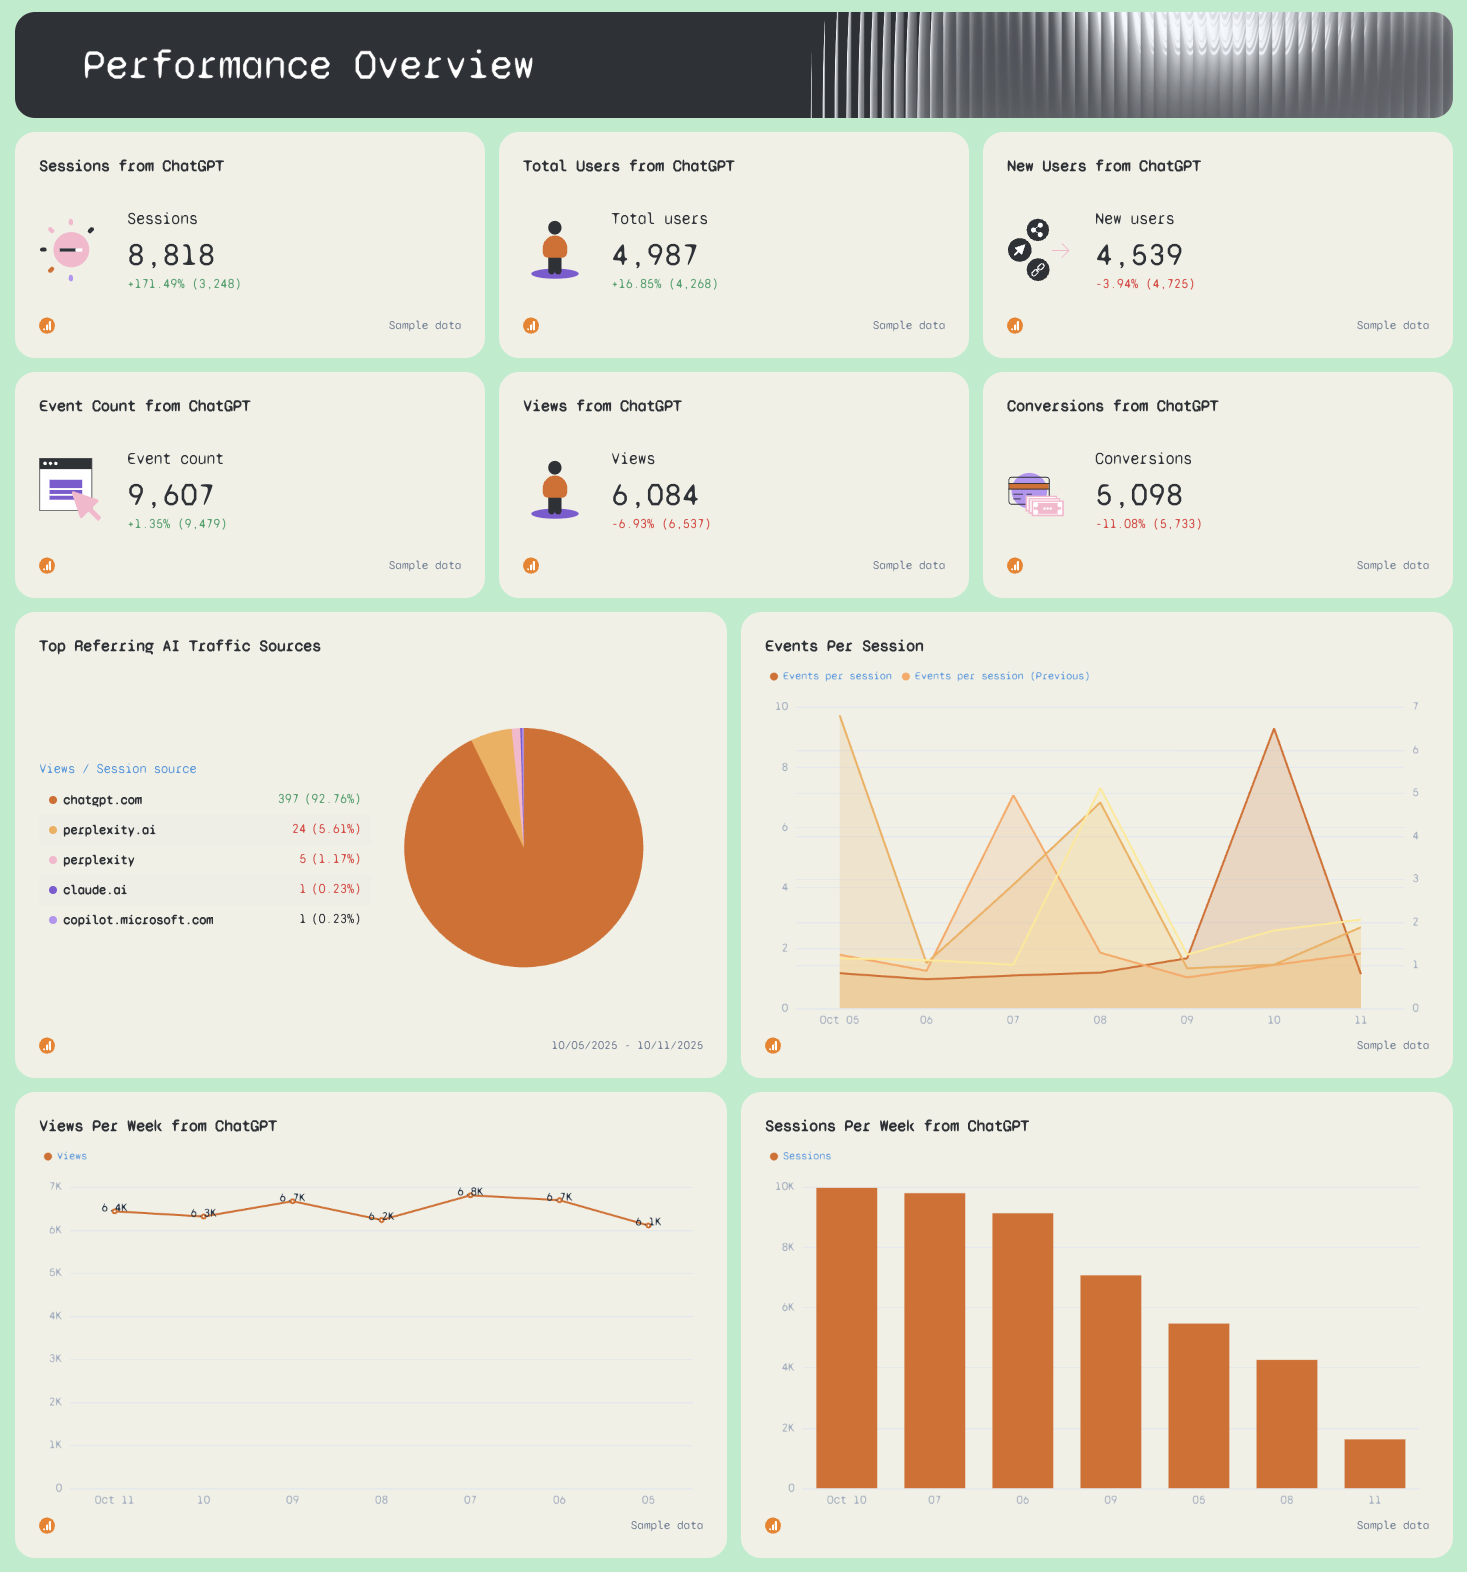
This section shows how much traffic you actually get from ChatGPT during the week.
On Whatagraph’s template, we pull the traffic data from Google Analytics 4 and applied a smart filter so you only see traffic where Source / Medium → matches regex → chatgpt / openai.
Include:
- Single-value widgets for sessions, total users, new users, views, event count, and conversions from ChatGPT only.
- A pie chart showing top referring AI traffic sources—like ChatGPT, Gemini, Perplexity, and others—so you can compare how each one performs.
- Line and bar Graph showing trends for sessions per week, events per session, and views per week. Trend visuals make it easier for your agency’s project manager or marketing team to spot patterns fast.
3. eCommerce Overview
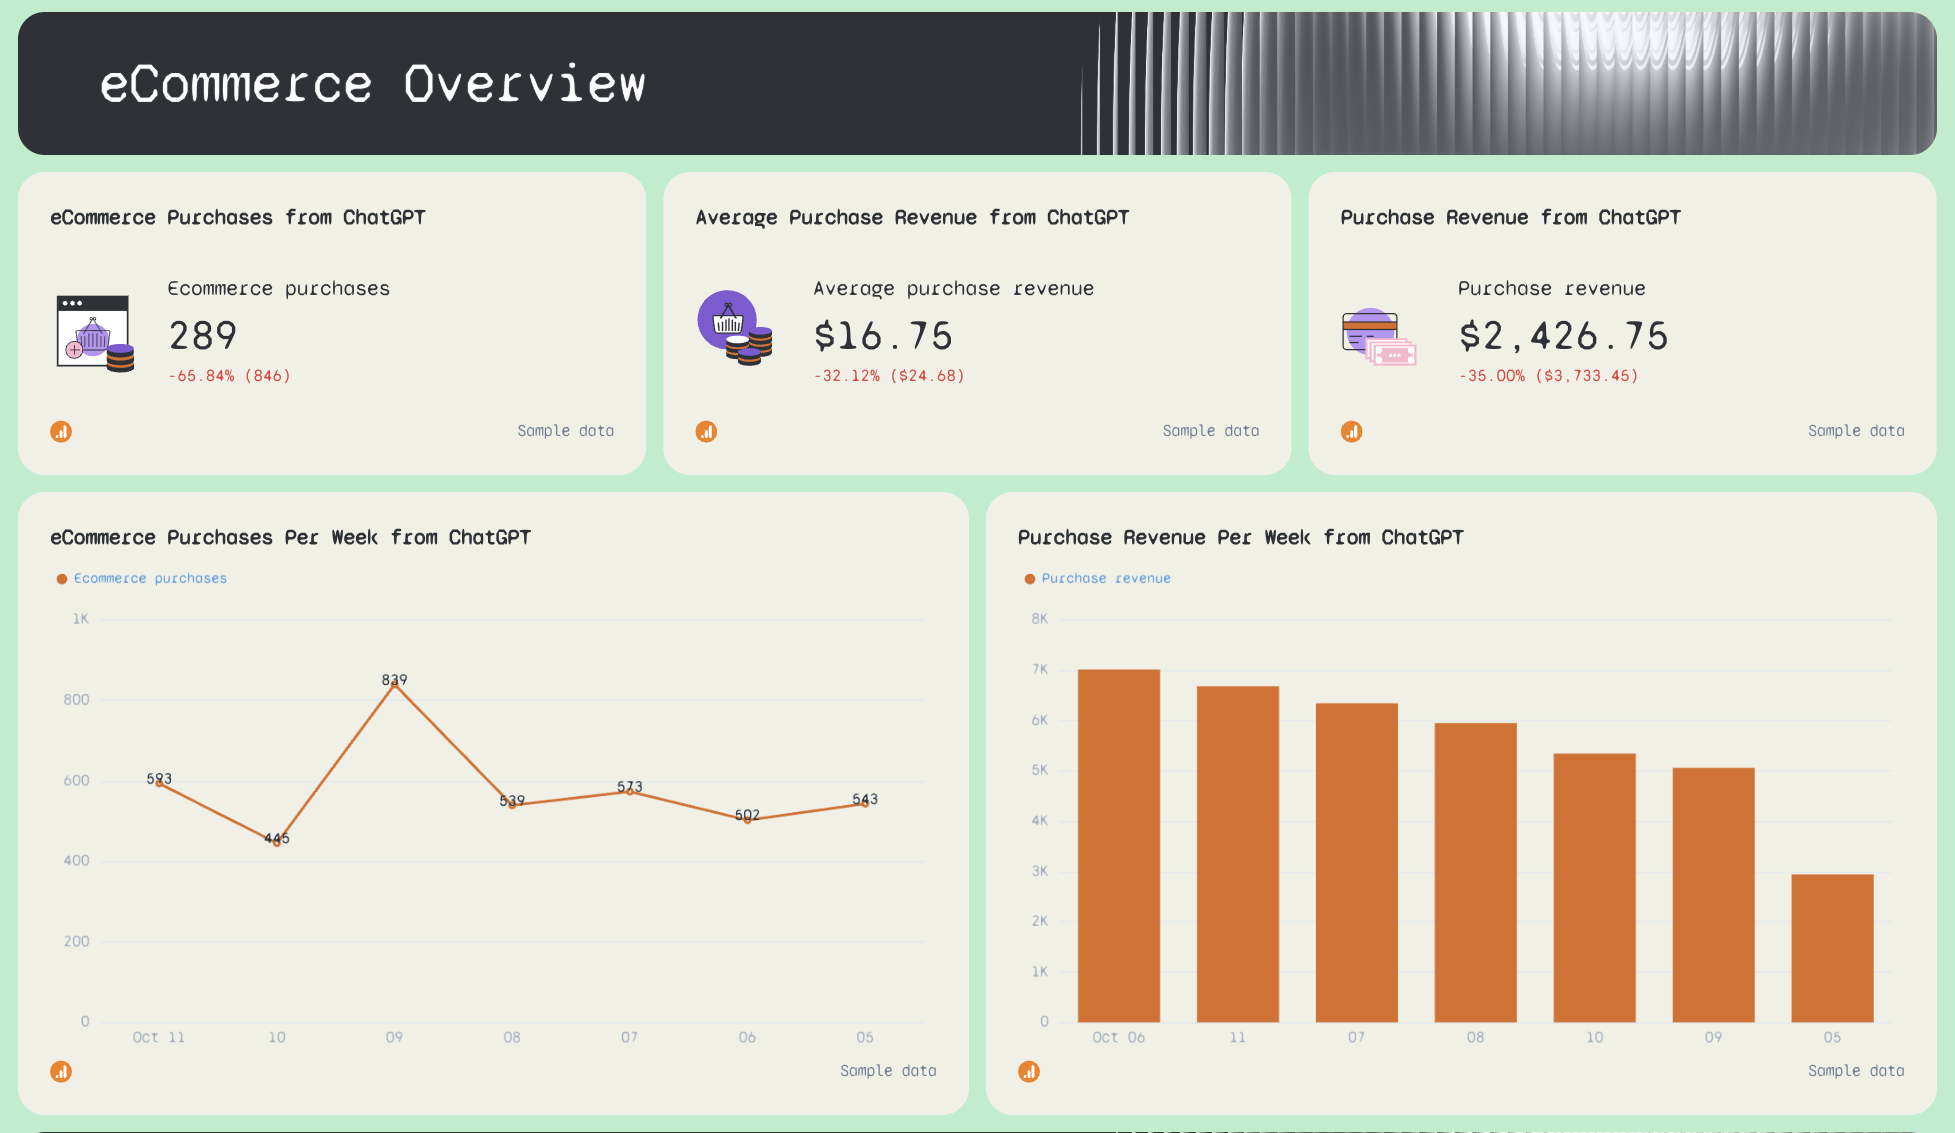
If you run an ecommerce store, this part of the template is one of the most important use cases.
Include:
- Widgets for ecommerce purchases, total sales from ChatGPT, and average purchase value.
- A weekly line graph showing ecommerce purchases from ChatGPT traffic.
- A weekly bar graph showing revenue from ChatGPT.
With these visuals, it’s easy to track whether people who use ChatGPT actually buy from your site and follow your timelines for growth.
4. Session Breakdown by AI Source (This Week)
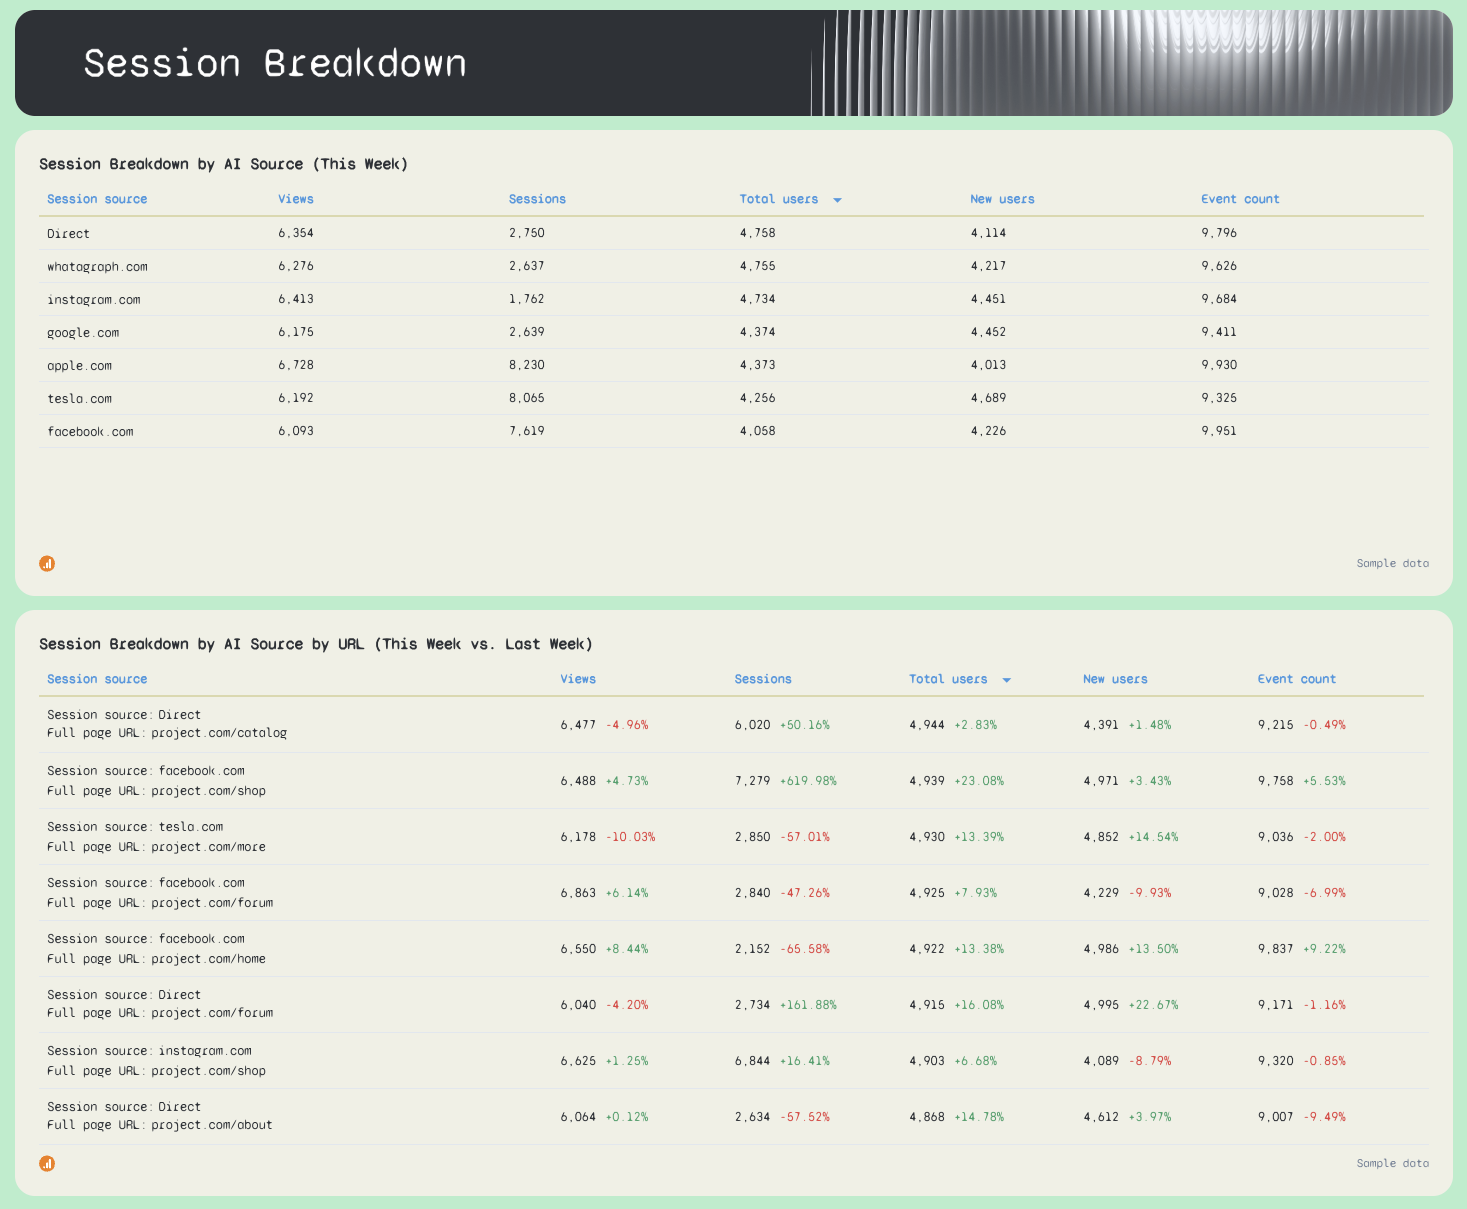
This is where you dig deeper into your traffic sources to understand which AI tools send the best traffic and to which URLs.
Include:
- A table of session metrics by AI source (ChatGPT, Perplexity, Gemini, etc.).
- A detailed table showing how much traffic each source sends to each landing page.
These tables help team members see where traffic is going, where to optimize, and what potential risks might be hiding in your data.
5. ChatGPT vs. Google
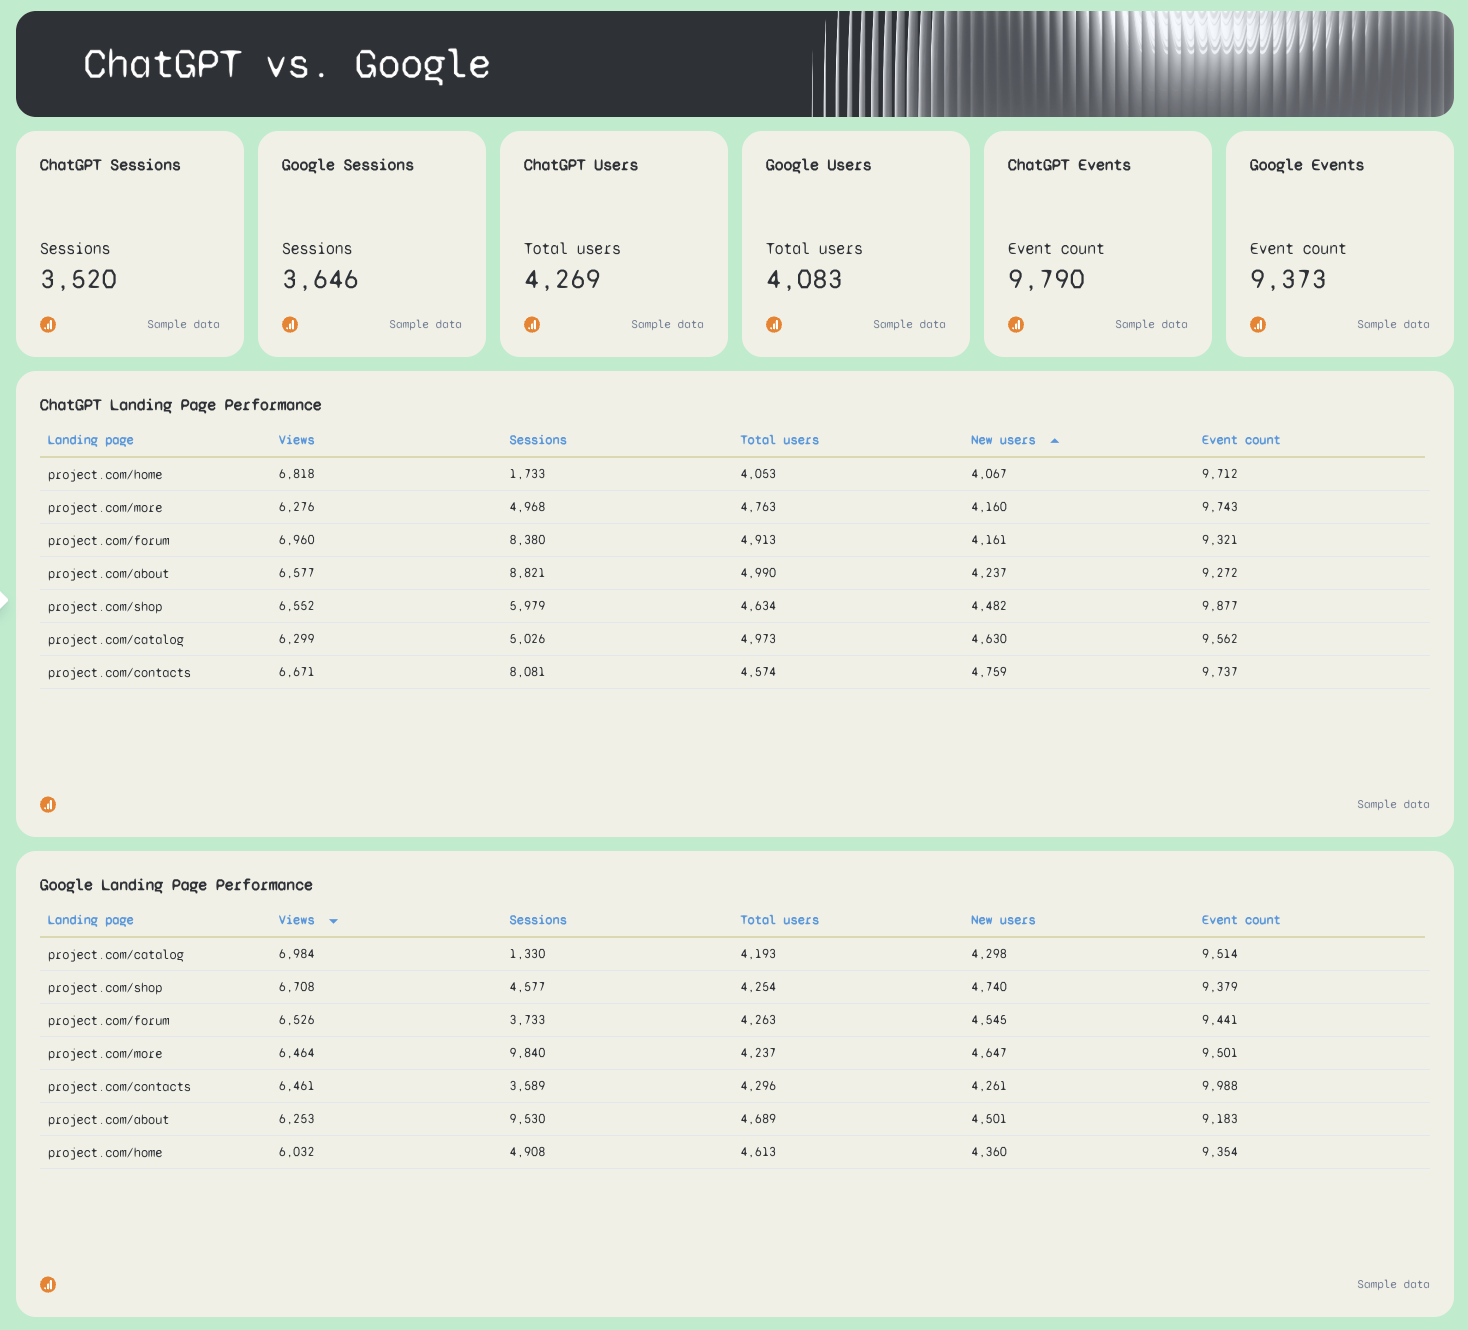
This part of your weekly report shows ChatGPT’s performance right next to Google. It’s great for marketers who want to track and measure GEO performance vs. SEO performance
Include side-by-side widgets showing:
- Views
- Sessions
- Total users
- New users
- Event counts
This lets you see whether ChatGPT is catching up to Google, where you need to optimize existing content, and which channel drives stronger team performance.


